
Understanding User Experience, Satisfaction, and Loyalty of Telecommunication Service Providers in Indonesia


Abstract
Recently, Indonesia telecommunication industry has gradually increased since the government issued the law regarding the change of economic system become oligopoly competition. This has an impact on a price war among telecommunication service providers, which one of them is cellular operators industry. This research focuses its intention to support conceptually the relationship among user experience, satisfaction, and loyalty. Research sample was 400 Indonesian users of GSM-based cellular operator with the instrument of 58 questionnaire items and collected using self-administered online survey. The model was tested using Smart PLS for variance-based structural equation modeling with the method of partial least square. The results showed that loyalty was positively influenced by satisfaction and user experience. Furthermore, satisfaction was found mediate the relationship between user experience and loyalty. It has the implication when users’ had a good experience towards their cellular operator hence they will feel satisfied and attain to be loyal. In addition, this research model was fit to the context since in the criteria of high in goodness of fit, predictive blindfolding, and coefficient of determination.
Keywords: Cellular operatorloyaltysatisfactionservice providersuser experienceIndonesia
Introduction
The competition in Indonesian industry has developed quickly. This condition prompts rivalry to reach benefit through market expansion to attract new customers and the capacity to keep up the existing customer to maintain customer loyalty. This phenomenon also occurs in the telecommunication industry which is marked by the price war of each operator since they sell the same product and service to the customer or user (Rachmawati & Mohaidin, 2017). Recently, information and Communication Technology is something that can't be isolated from public life and ended up noticeably one of the critical need to bolster individuals' exercises, for example, connecting people without limit time and distance, getting the most recent data, and supporting business activities. One of the ways to meet the needs is by using the internet data services. Advances in the internet technology have changed the ways people looking at the environment around them and the world in the era of globalization. On one hand, the globalization expands the market of products. On the other hand, it increases the sharpness of the competition involving the advancement of the information and communication technology which keeps developing to become increasingly more and more sophisticated (Sitinjak, 2005).
The Indonesian telecommunication industry showed rapid growth and become stringent since the government issued the policy of competition from monopoly became oligopoly through Law No. 36 of 1999. Besides that the competition among telecommunication industries was also accelerated by advances in communications technology that uses radio frequency spectrum as an alternative means of telecommunications that were previously only rely on cable and satellite networks (Rachmawati & Mohaidin, 2017; Utoyo, 2015). Internet subscribers in Indonesia is annually increased and the marketers predict that it will gradually enlarged until 2018 (Statista, 2016). Most of the users use internet through smartphone because this device is easy to carried anywhere and anytime (Utoyo, 2015). The smartphone can be used if there is a sim card inside which is provided by cellular operator. So that, cellular operator become one of the fast growing companies in Indonesian telecommunication industry. This is showed by the increasing demands of telecommunication technology in both quality and quantity which is causes the competition in telecommunication industry becoming more severe (Hasan & Afifah, 2007).
There are two types of cellular operators based on technology, the first is GSM-based cellular operators and the second one is CDMA-based cellular operators. GSM-based cellular operators consist of four companies, i.e. Telkomsel, Indosat Ooredoo, XL Axiata, and Hutchison 3. While, only Smartfen which is based on CDMA. This research only focus on GSM-based cellular operators for the reason that the price war is happened in this part (Hasan & Afifah, 2007). The conditions of cellular operators until this time can be concluded, such as: firstly, the numer of users is getting increased but some of them are inactive users. Secondly, the growth of users are in stagnant condition for Telkomsel, Indosat Ooredoo, and 3 but XL Axiata is getting lower. Thirdly, average revenue per user is considered in low price which is reversely with the customer churn in high number (IndoTelko, 2014).
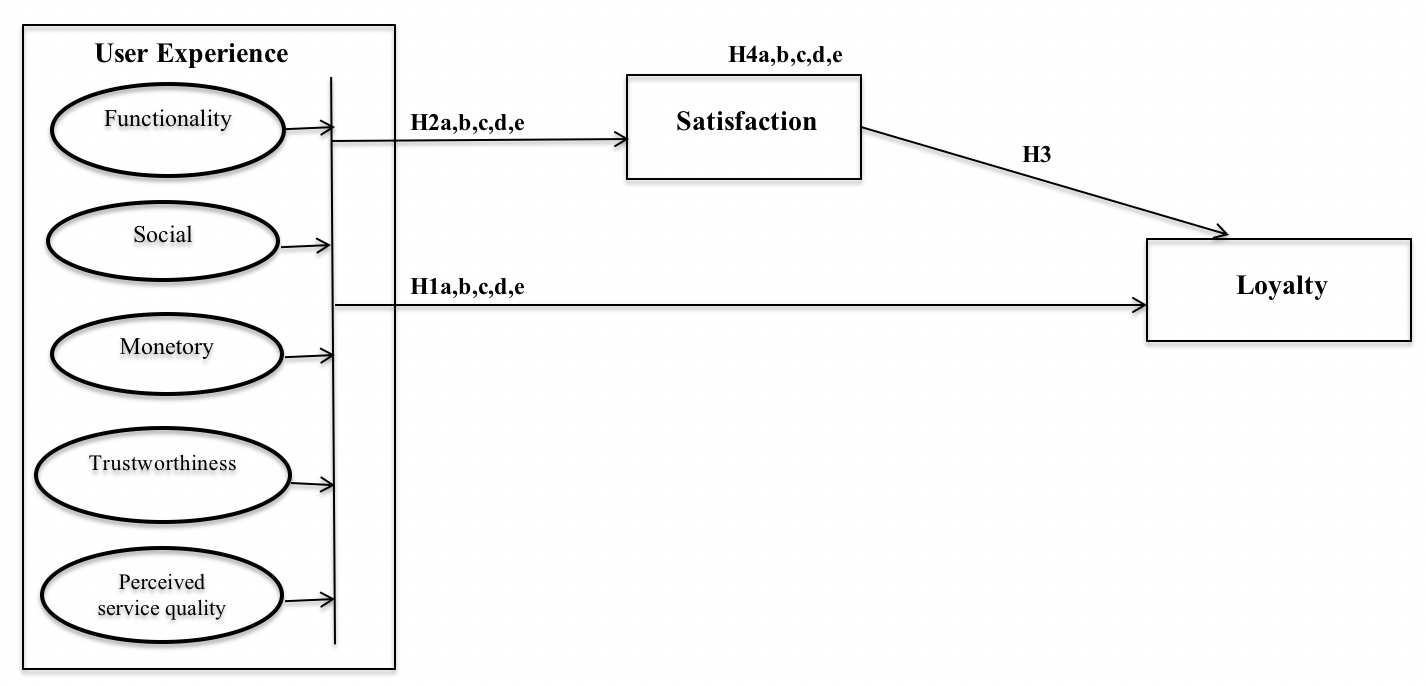
Prior researches argued that customer loyalty can be reached if customer feel satisfy with the product or service that they already got by their previous experience (Solomon, Bamossy, Askegaard, & Hogg, 2006; Chang & Chen, 2008, 2009; Deng, Lu, Kwok, & Zhang, 2010; Tarus & Rabach, 2013; Kim, Siew, Younghoon, & Park, 2016). It was found that experience in the stage of cognitive phase able to influence satisfaction in the stage of affective phase and loyalty in the stage of conative/action phase (Oliver, 1999). Additionally, the preceeding researchers stated that the relationship on these phases could be strengthen and/or mediated by corporate image (Aisya, 2016; Amin, Ahmad, & Lim, 2012; Calvo-Porral & Levy-Mangin, 2015; Gautam, 2011; Ghalandari, Babaeinia, & Jogh, 2013; Kim et al., 2016; Tarus & Rabach, 2013). Garret (2011) described that perceived user experience in using a particular technology includes the internet and the site referred to the user experience. Both marketers and telecommunication practitioners generally confirm that the obtained positive user experience with a product/service brand will affect the customers' perception of the brand into a more positive direction in building loyalty (Yoo, Donthu, & Lee, 2000). Aaker and Joachimsthaler (2000) stated that the experience gained through participation and engagement of the users on the internet are likely to be stronger than user experience gained from other conventional media. Andreassen and Lindestad (1998) defined that corporate image refers to users’ set of beliefs toward the company. Corporate image is considered related to the overall experience on a company and become the influence factor that able to mediate or moderator the relationship between experience and satisfaction (Aydin, Ozer, & Arasil, 2005; Kim & Hyun, 2011; Kim et al., 2016). The better the corporate image of a cellular operator, the more satisfied the customers to its company (Wang, 2010). In addition, Tarus and Rabach (2013) found that corporate image able to strengthen the relationship between experience and loyalty. Compared to several previous researches, this research has intention to investigate and examine the relationship among user experience, satisfaction, and loyalty with the moderating role of corporate image. User experience affects towards satisfaction as well as it affects towards loyalty. So that, satisfaction is reflected as mediator between user experience and loyalty. Corporate image is not only considered as moderator between user experience and satisfaction, but also moderate the relationship between user experience and loyalty in Indonesia cellular operators. This will be the contribution in this research.
Problem Statement
Telecommunication industry is one of the businesses from various industries in Indonesia that increasingly tight competition, it can’t be denied telecommunication provides high impact in supporting the activities of users in performing daily activities. The number of cellular operatos users in Indonesia are gradually increased but there is a downward trend in the customer loyalty due to the similarity of the products and services offered by each cellular operator which causes a price war and raises the level of customers’ behavior to move or change the operators (i.e. customer churn; split customer and switcher customer). In facing the competiveness of the Indonesian Telecommunication industry, a company can retain its customers’ loyalty by observing the users’ experience and satisfaction through their perceptions and expectations.
Research Questions
-
Is user experience significantly related to loyalty?
-
Is user experience significantly related to satisfaction?
-
Is satisfaction significantly related to loyalty?
-
Is satisfaction mediate on the relationship between user experience and loyalty?
Purpose of the Study
-
To investigate that user experience significantly related to loyalty.
-
To investigate that user experience significantly related to satisfaction.
-
To investigate that satisfaction significantly related to loyalty.
-
To investigate whether satisfaction mediates the relationship between user experience and loyalty.
Research Methods
User experience
Loyal customers in technology-based products / services are positively influenced by user satisfaction based on the experience provided. Therefore, when a product is being developed, people pay much attention to what it can do. The user experience is another side that is often overlooked, but is able to make the difference between success and failure of the product. Garret (2011) revealed that user experience is what a person perceives from a product or service he or she has actually used. When a product or service is developed, the customer gives much attention to it. Solomon et al., (2006) defined experience as a scheme to develop a cognitive phase based on the user's knowledge, beliefs, or perceptions. Referring to the four-stage loyalty framework, cognitive loyalty relates to prior knowledge or vicarious experience or recent experience-based information. The framework begins with cognitive loyalty, affective loyalty, conative loyalty, and action loyalty (Oliver 1997, 1999). Cognitive phase is loyalty to information, affective phase is loyalty to a liking, conative phase is loyalty to an intention, and action phase is loyalty to inertial action. According to Fishbein and Ajzen (1975), user experience is often defined as the achievement of a product or service that the user deems unsuccessful or unsuccessful before the user expresses likes / dislikes, satisfied / dissatisfied, and then the user will have the intention and take action to be loyal to it. Chang and Chen (2009) found that experience is important in understanding user perceptions, attitudes, and behaviors. Additionally, Deng et al. (2010) found that trust, perceived value, and service quality are indicators in experience-based information which significantly affects the affective and action phases of the mobile instant messaging usage in China. Kim et al. (2016) confirmed that usage experience, device features, and corporate factors significantly affect customer satisfaction in the Korean smart phone market (Figure
Research Framework
Satisfaction
Satisfaction, in affective phase (i.e., loyalty to a liking phase), is determined by the overall feeling or attitude a person has about a product after it is purchased. It can be said that users / customers are involved in a constant evaluation process of what they have bought when they integrate the products / services into their daily usage activities. Satisfaction has a real impact on loyalty and profitability (Solomon et al., 2006). Oliver (1997, 1999) defines satisfaction as the feeling of fullfillment; customers feel that consumption gives results to the standard of pleasure rather than displeasure. Recent studies have found that perceptions of a product / service quality affect customer satisfaction, which in turn results in increased profitability for the company providing the product (Chang & Chen, 2008, 2009; Deng et al., 2010; Venkat, 2007). Satisfaction includes user emotions, attributes, perceptions, and others which can develop customer satisfaction. Positive emotions like happiness will increase user satisfaction. Conversely, negative emotions such as sadness, regret, and anger can reduce the level of satisfaction (Zeithaml, 2009). In addition, satisfaction is the comparison between people's perceptions and expectations.
Loyalty
Oliver (1997) divides behavior in two phases, namely conative and action phases. Loyalty to an intention and loyalty to an inertial action is included into behavioral phase (Fishbein & Ajzen, 1975; Hilgard, 1980 in Khalid, Radha, Helander, & Yang, 2010; Rosenberg & Hovland, 1960 in Khalid et al., 2010). Taylor, Celuch, and Goodwin (2004) argue that customer loyalty (including behavioral loyalty and attitude loyalty) is positively related to satisfaction, value and resilience to change, influence, brand trust, and brand equity. Loyalty is defined as repurchase behavior driven by a good attitude towards a product, including attitudinal loyalty and behavioral loyalty (Chang & Chen, 2008, 2009; Oliver, 1999; Taylor et al., 2004). Attitudinal loyalty (behavioral intention) is a loyalty to the commitment to buy back or rejuvenate a product. In other words, conative phase is about intention to do something and behavioral loyalty is an act to buy back or rejuvenate a product (Kotler & Keller, 2012). Loyalty is also a commitment to buy back or rejuvenate a preferred product (goods or services) in the future despite situational influences and marketing efforts that could potentially lead to behavioral transfers (Kotler & Keller, 2012; Oliver, 1999). In this research, customer loyalty of telecommunication service providers in Indonesia becomes the dependent variable influenced by user experience as the independent variable through user satisfaction as the mediator.
Research Methodology
Questionnaire is developed to measure respondent perceptions of the research constructs. This research contains 58 questionnaire items that divided into 7 constructs. These items are measures by seven-point numerical scale, which is anchored by 1 = strongly disagree, 3 = neutral (undecided; neither agree nor disagree), and 7 = strongly agree. The questionnaires items were adopted from the prior researches that the same in common in ICT industry, for instance: Anderson and Srinivasan (2003); Aydin et al. (2005); Calvo-Poral and Levy-Mangin (2015); ); Chen and Dubinsky (2003); Cronin, Brady, & Hult (2000); Deng et al. (2010); Gefen et al. (2003); Kim et al. (2016); Lam, Shankar, Erramilli, & Murthy, (2004); Nguyen and Leblanc (2001); Sweeny and Soutar (2001). User experience contains Functionality (13 items), Social (5 items), Monetary (8 items), Trustworthiness (7 items), and Perceived service quality (7 items). Satisfaction consists of 9 items and loyalty includes 9 items. The questionnaires were distributed by self-administered online survey by Google forms. Pilot study was done to check the reliability and validity of each questionnaire items that distributed to 30 respondents with the result all of 65 items are reliable and valid. Post-test study was distributed to 400 respondents of Indonesia GSM-based users and the result showed that all of the items are fulfilled the criteria of convergent validity, reliability, and discriminant validity.
Findings
Based on Table
Respondents profile based on age, occupation, province, gender, cellular operator, usage time, card type, income, and usage cost. The results show that all of 400 respondents are spread evenly. The next process is analysing using Smart PLS software. Structural equation modeling tests is divided into assessment of the measurement model and assessment of the structural model. Assessment of the measurement model aims to assess convergent validity, discriminant validity, composite reliability, and cronbach’s alpha. Assessment of the structural model aims to assess Hypotheses testing, R2,
Conclusion
Based on the results in Table
Acknowledgments
The authors wish to express gratitude towards School of Economics and Business, Telkom University and Graduate School of Business, Universiti Sains Malaysia, who greatly support this research.
References
- Aaker, D., & Joachimsthaler, E. (2000). Brand Leadership. New York: the free press.
- Aisya, A. (2016). The moderating effects of corporate image: the influence of service quality and trust on purchase intention. Online. Accessed 12th May 2016. Available from World Wide Web: http:// www.academia.edu/4024075/The moderating effects of corporate image the influence of service quality and trust on purchase intention.
- Amin, S. M., Ahmad, U. N. U., & Lim, S.H. (2012). Factors Contributing to Customer Loyalty towards Telecommunication Service Provider. Procedia the 2012 International Conference on Asia Pacific Business Innovation & Technology Management-Social and Behavioral Sciences, 40, 282-286.
- Anderson, R. E., & Srinivasan, S. S. (2003). E-satisfaction and e-loyalty: A contingency framework, Psychology & Marketing, 20(2), 123–128.
- Andreassen, T. W., & Lindestad, B. (1998). The effect of corporate image in the formation of customer loyalty. Journal Services Research, 1(1), 82–92.
- Andrews, L., Drennan, J., & Russell-Bennett, R. (2012). Linking perceived value of mobile marketing with the experiential consumption of mobile phones. European Journal of Marketing, 46(3-4), 357-386.
- Aydin, S., Ozer, G., & Arasil, O. (2005). Customer loyalty and the effect of switching costs as a moderator variable: A case in the Turkish mobile phone market. Marketing Intelligence & Planning, 23(1), 89–103.
- Calvo-Porral, C., & Levy-Mangin, J. P. (2015). Switching behavior and customer satisfaction in mobile services: analyzing virtual and traditional operators. Computer Human Behavior, 49, 532–540.
- Carlson, J., O’Cass, A., & Ahrholdt, D. (2015). Assessing customers’ perceived value of the online channel of multichannel retailers: A two country examination. Journal of Retailing and Consumer Services, 27, 90-102.
- Caruana, A. (2002). Service loyalty: The effects of service quality and the mediating role of customer satisfaction. European Journal of Marketing, 37(7–8), 811–828.
- Chang, H. H., & Chen, S.W. (2008). The impact of customer interface quality, satisfaction and switching costs on e-loyalty: Internet experience as a moderator. Computers in Human Behavior, 24, 2927-2944.
- Chang, H.H., & Chen, S.W. (2009). Consumer perception of interface quality, security, and loyalty in electronic commerce. Information & Management, 46, 411-417.
- Chen, A., & Dubinsky, A.J. (2003). A conceptual model of perceived customer value in e-commerce: a preliminary investigation. Psychol. Mark., 20, 323–347.
- Chuah, S. H. W., Marimuthu, M., Kandampully, J., & Bilgihan, A. (2017). What drives Gen Y loyalty? Understanding the mediated moderating roles of switching costs and alternative attractiveness in the value-satisfaction- loyalty chain. Journal of Retailing and Consumer Services, 36, 124-136.
- Cronin, J., Brady, M., & Hult, G. (2000). Assessing the effects of quality, value, and customer satisfaction on behavior intentions in service environments. Journal of Retailing, 76(2), 193–218.
- Deng, Z., Lu, Y., Kwok, K.W., & Zhang, J. (2010). Understanding customer satisfaction and loyalty: An empirical study of mobile instant messages in China. International Journal of Information Management, 30, 289-300.
- Fishbein, M., & Ajzen, I. (1975). Belief, Attitude, Intention, and Behavior: An Introduction to Theory and Research. Philippines: Addison-Wesley Publishing Company, Inc.
- Garrett, J. J. (2011). The Elements of User Experience: User-Centered Design for the Web and Beyond. 2nd Edition. Berkeley: Pearson Education.
- Gautam, V. (2011). Investigating the Moderating Role of Corporate Image in the Relationship between Perceived Justice and Recovery Satisfaction: Evidence from Indian Aviation Industry. International Review of Management and Marketing, 1(4), 74-85.
- Gefen, D., Karahanna, E., & Straub, D. W. (2003). Trust and tam in online shopping: An integrated model. MIS Quarterly, 27(1), 51–90.
- Gerpott, T. J., Rams, W., & Schindler, A. (2001). Customer retention, loyalty, and satisfaction in the German mobile cellular telecommunications market. Telecom- munications Policy, 25(4), 249–269.
- Ghalandari, K., Babaeinia, L., & Jogh, M. G. G. (2013). The Moderating Effects of Corporate Image On The Relationship Between Perceived Justice Dimensions And Consumer Attitudes And Repurchase Intentions From Online Shopping in Iran. Research Journal of Applied Sciences, Engineering and Technology, 5(1), 303-318.
- Gijon, C., Garin-Munoz, T., Perez-Amaral, T., & Lopez-Zorzano, R. (2013). Satisfaction of Individual Mobile Phone Users in Spain. Telecommunication Policy, 37, 940-954.
- Hasan, M. F., & Afifah, E. N. (2007). Dampak Kepemilikan Silang terhadap Persaingan Usaha: Kasus Industri Telekomunikasi Seluler di Indonesia. Bisnis & Ekonomi Politik: Quarterly Review of the Indonesian Economy, 4(4).
- Heung, V. C. S., & Ngai, E. W. T. (2008). The mediating effects of perceived value and customer satisfaction on customer loyalty in the Chinese restaurant setting. Journal of Quality Assurance in Hospitality & Tourism, 9(2), 85– 107.
- IndoTelko. (2014). Registrasi Ulang Bisa Tekan Churn Rate? Retrieved March 31, 2017, from http://www.indotelko.com/kanal?c=id&it=registrasi-ulang-bisa-tekan-churn-rate/.
- Kao, T. W., & Lin, W. T. (2016). The relationship between perceived e-service quality and brand equity: A simultaneous equations system approach. Computers in Human Behavior, 57, 208-218.
- Kassim, N. M., & Abdullah, N. A. (2008). Customer loyalty in e-commerce settings: An empirical study. Electronic Markets, 18(3), 275–290.
- Khalid, H. M., Radha, J. K., Helander, M. G., & Yang J. X. (2010). Attitudinal Modeling of Affect, Behavior And Cognition: Semantic Mining of Disaster Text Corpus (Final Report of investigation into the attitudes of disaster experience from text corpora of narratives and report), Damai Science Malaysia, Nanyang Technological University, Singapore.
- Kim, J. H., & Hyun, Y. J. (2011). A model to investigate the influence of marketing-mix efforts and corporate image on brand equity in the IT software sector. Ind., Mark. Manage, 40(3), 424–438.
- Kim, M. K., Siew, F. W., Younghoon, C., & Park, J. (2016). Determinants of customer loyalty in the Korean smartphone market: Moderating effects of usage characteristics. Telematics and Informatics, 33, 936-949.
- Kotler, P., & Keller, K. L. (2012). Marketing Management (14th ed.). Englewood Cliffs, New Jersey: Prentice-Hall.
- Kotler, P., & Keller, K. L. (2016). Marketing Management (15th ed.). Englewood Cliffs: Pearson Education Limited.
- Lai, F., Griffin, M., & Babin, B. J. (2009). How quality, value, image, and satisfaction create loyalty at a Chinese telecom. Journal of Business Research, 62(10), 980-986.
- Lam, S. Y., Shankar, V., Erramilli, M. K., & Murthy, B. (2004). Customer value, satisfaction, loyalty, and switching costs: an illustration from a business-to-business service context. J. Acad. Mark. Sci., 32 (3), 293–311.
- Lopez-Miguens, M. J., & Vazquez, E. G. (2017). An integral model of e-loyalty from the consumer's perspective. Computers in Human Behavior, 72, 397-411.
- Nguyen, N., & Leblanc, G. (2001). Corporate image and corporate reputation in customers’ retention decisions in services. Journal of Retailing and Consumer Services, 8, 227-236.
- Oliver, R. L. (1999). Whence consumer loyalty? Journal of Marketing, 63(4), 33–44.
- Rachmawati, I. S., & Mohaidin, Z. (2017). The role of user experience towards customer loyalty in Indonesian cellular operator with the mediating role of user satisfaction and customer-based brand equity. Advanced Science Letter, 23(1), 177-180.
- Ramayah, T., Cheah, J., Chuah, F., Ting, H., Memon, M.A. (2016). Partial Least Squares Structural Equation Modeling (PLS-SEM) using SmartPLS 3.0: An updated and practical guide to statistical analysis. 2nd Edition. Kuala Lumpur: Pearson.
- Sheth, J. N., Newman, B. I., & Gross, B. L. (1991). Why we buy what we buy: A theory of consumption values, Journal of Business Research, 22(2), 159-170.
- Sitinjak, T. (2005). Pengaruh Citra Merek dan Sikap Merek Terhadap Ekuitas Merek. Jurnal Ekonomi Perusahaan. 12(2), 166-182.
- Solomon, M., Bamossy, G., Askegaard, S., & Hogg, M. K. (2006). Consumer Behavior: A European Perspective (3rd ed.): Pearson Education.
- Statista. (2016). Number of mobile phone users in Indonesia from 2013 to 2019 (in millions). Retrieved July 14, 2016, from http://www.statista.com/statistics/274659/forecast-of-mobile-phone-users-in-indonesia/.
- Sweeney, J. C., & Soutar, G. N. (2001). Consumer perceived value: the development of a multiple item scale. Journal of Retail, 77, 203–220.
- Tarus, D. K., & Rabach, N. (2013). Determinants of customer loyalty in Kenya: does corporate image play a mediating role? The TQM Journal, 25(5), 473-491.
- Taylor, S. A., Celuch, K., & Goodwin, S. (2004). The importance of brand equity to customer loyalty. Journal of Product & Brand Management, 13(4), 217-227.
- Tseng, F. M., & Lo, H. Y. (2011). Antecedents of consumers’ intentions to upgrade their mobile phones. Telecommunication Policy, 35(1), 74–86.
- Utoyo, I. (2015). Accessed 9th January 2016. Available from World Wide Web: http://www.telkom.co.id/UHI/CDInteraktif2013/ID/0031_industri.html.
- Venkat, R. (2007). Impact of customer experience on satisfaction, brand image and loyalty: a study in a business-to-business context. ASAC Proceedings, 101-114.
- Wang, C. Y. (2010). Service quality, perceived value, corporate image, and customer loyalty in the context of varying levels of switching costs. Psychology Marketing, 27(3), 252–262.
- Woodruff, R. A. (1997). Customer value: The next source for competitive advantage. Journal of the Academy of Marketing Science, 25(2), 139–153.
- Yoo, B., Donthu, N., & Lee, S. (2000). An Examination of Selected Marketing Mix Elements and Brand Equity. Journal of the Academy of Marketing Science, 28(2).
- Zeithaml, V. A. (2009). Service Marketing. New York: McGraw-Hill.
Copyright information

This work is licensed under a Creative Commons Attribution-NonCommercial-NoDerivatives 4.0 International License.
About this article
Publication Date
02 August 2019
Article Doi
eBook ISBN
978-1-80296-064-8
Publisher
Future Academy
Volume
65
Print ISBN (optional)
-
Edition Number
1st Edition
Pages
1-749
Subjects
Business, innovation, sustainability, environment, green business, environmental issues
Cite this article as:
Rachmawati, I., & Mohaidin, Z. (2019). Understanding User Experience, Satisfaction, and Loyalty of Telecommunication Service Providers in Indonesia. In C. Tze Haw, C. Richardson, & F. Johara (Eds.), Business Sustainability and Innovation, vol 65. European Proceedings of Social and Behavioural Sciences (pp. 360-372). Future Academy. https://doi.org/10.15405/epsbs.2019.08.36