
Application Of Correlation Analysis In The Study Of Passenger Service Quality Indicators


Abstract
In order to increase competitiveness in the market of transport services, railway transport enterprises pay attention to the passenger service quality. Currently, the insufficiently developed regulatory and methodological base and the absence of an approved for procedure of passenger service quality assessing slow down the efficiency of the Russian railways. Competitive advantages are determined by the scale and depth of coverage of the transport market. To assess the level of quality of services, it is necessary to determine a number of limiting factors: the type of potential consumers, the assortment set of service parameters, the level of competitiveness in the transport market, taking into account objective and subjective factors. Railway transport services quality is assessed by to the certain criteria. It is recommended to distinguish the following indicators: accessibility, efficiency, reliability, and convenience. The assessment made in this research revealed a number of problems. They can be solved by the method of assessing the quality of the organization of passenger transport services, with the use of correlation analysis of the pairwise dependence of market research indicators and the implementation of customer service parameters. This will allow us to determine the dependence of the estimated indicators for further selecting and to establish a unified list of criteria for a joint analysis of the transport services quality.
Keywords: Customer focus, marketing research indicators, performance parameters, quality of passenger service
Introduction
The process of passenger service is a combination of tens and hundreds of individual operations, and building a quality system for passenger service is a complex and painstaking work, which includes the following groups of tasks, the solution of which requires a certain sequence:
- identifying the level of expectations of passengers, providing feedback, benchmarking;
- analysis of processes, development and implementation of a system of quality indicators for passenger service, control of quality indicators;
- reengineering of business processes, ensuring a balance between quality, costs and profit;
- regulation of processes, creation of work instructions and memos, work with personnel;
- formation of the image of the passenger complex of railway transport as focused on the quality of service (Development strategy of Federal Passenger Company JSC until 2030; Railway transport in Russia: challenges until 2025).
The development of railway transport can be achieved not only by increasing the volume of transportation of goods and passengers, but also by improving the quality of services provided. The latter, in turn, ensures a high level of competitiveness of the industry. Therefore, the primary task is to increase the competitiveness of the industry by improving the quality of transport services for the population (Gromyshova et al., 2019; Larin & Larina, 2017; Silicheva et al., 2016; Surkov & Silicheva, 2016; Tereshina et al., 2017).
Problem Statement
The transport services organization for the population is a system of organizational measures and management actions, the purpose of which is to meet the need for transportation of the population of a certain territory. One of the main indicators of the efficiency of the transport services system is the quality of the services provided. This is the ability to organize the necessary trips and cover the needs associated with them. There are several conditions that should be met (Bulokhova & Bulokhov, 2015; Elizariev, 2012):
- transport availability – every person who wants to make a trip can carry out the process of movement without hindrance;
- customer satisfaction – consumers like the services of the transport system; they appreciate a high level of comfort and do not have a negative experience;
- high level of technology – the transport system is serviceable, profitable, safe; the number of defects is within acceptable limits.
The absence in the middle of the 20th century of an effective quality control mechanism was one of the prerequisites for the development of quality management practice. One of the first countries to develop quality management practices was Japan. By the beginning of the 70s, Japan managed to increase the export of its goods to the US and European markets thanks to the production of better products. As a result of the research, it was found that although the views of researchers and scientists are basically the same, it seems possible to divide the opinions of scientists into two different approaches to measuring quality: the first approach is based on a numerical measurement of quality, while the second involves a qualitative measurement. services, namely the level of customer satisfaction.
Research Questions
Assessment of the quality of railway transport services is carried out according to the criteria set out in the regulatory documents. When assessing the quality of transport services for passengers, it is recommended to distinguish the following indicators: accessibility, efficiency, reliability, and convenience. The Federal Passenger Company (hereinafter - JSC "FPC") uses a two-level quality assessment system. Marketers evaluate the "perceived" quality of services, and the customer service sector evaluates "the quality of service provided" (Bulokhova, 2016; European Union standard EN 13816, 2002; GOST R51004-96).
Every quarter, marketing specialists evaluate the quality of the services provided using a questionnaire of 90 questions. The customer service sector tracks this on a monthly basis and conducts a survey of 250 questions. Table 1 provides a summary of the data.
We see that the trip comfort and the schedule convenience are not the zones of responsibility of the customer service sector. Accordingly, these indicators are not considered. Moreover, other "joint" indicators are evaluated using different methods. Marketers use passenger surveys, while the customer service sector relies on personal checks. This often leads to conflicting data.
Source data
For solving this issue, a study is conducted of the relationship between the indicators for evaluating the quality of the services provided by the marketing department and the customer service department by the method of correlation analysis. The correlation analysis is used to assess how strong is the relationship between random variables that characterizes some actual process. Such research will allow to measure how close and coherent the quality assessment indicators obtained by different departments are. It will also let us develop a united list of criteria for joint analysis of the transport services quality (Makeev & Oksenyuk, 2013; Olentsevich, & Belogolov, 2016). Moreover, GAP-analysis can be used for comparison of the actual quality assessment indicators with the target ones for developing corrective measures to achieve the target quality (Olivková, 2016). Using this method, we can study the problem considering it as a gap that arises during the implementation of the change plan, between the indicators and results that were planned to be achieved, and what happened in reality (Kukartseva, 2016).
When using the method of the correlation analysis, statistical data for four main areas of responsibility were used:
- cashiering;
- services on the way;
- vehicles technical conditions;
- catering en route.
To analyze the current state of the "perceived" and "supplied" quality of services in JSC Federal Passenger Company (JSC FPK), it is necessary to study the change in time of the average score (B ́) (obtained by the marketing sector) and that of the average percentage (P ́) of fulfilling the controlled quality parameters for a set period (1-4 years). Having grouped the statistics of marketing research over four years, we will determine their average score. Table 02 presents the results for marketing research indicators.
Table 03 let us calculate the average percentage of completion by grouping the statistics of the tracked parameters by the client services sector over four years.
Table 04 presents the results of the correlation analysis for the East-Siberian branch of JSC FPC as a whole for all periods assessed.
Then, a correlation dependence of the parameters was build, and a gap analysis of the indicators was performed. The results are presented in table 05.
Research methodology for the quality of passenger travel service
As table 05 shows, the correlation coefficient was 0.4 for the indicator "Cashiering". This means that the correlation factors are absent. The data for marketing research and the client services sector do not always correlate, as well as the data for different monitoring periods. To avoid such situation, we should analyse why this happened. We should also establish and implement a united pool of quality parameters evaluated with the help of questionnaires. Figure 01 shows the correlation dependence of the indicator "Vehicles technical condition".
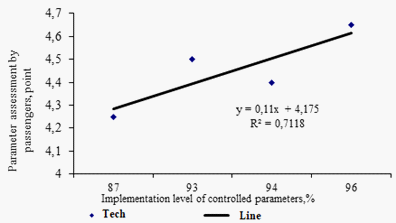
The correlation coefficient for the “technical condition” indicator was R = 0.89, which means a high dependence between the data.
A “positive” correlation implies that the higher level of achievement of the controlled quality parameters in trains results in the higher level of customer focus of the company. Consequently, this reduces the “gap” between the “provided” to the passenger and the “perceived” be the passenger. The correlation dependence of the indicator "Passenger service" is shown in figure 02.
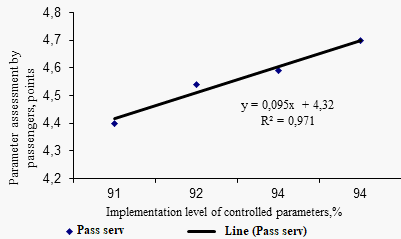
The correlation coefficient for the “Passenger Service” indicator was R = 0.9. That means a high dependence between the data. As the GAP analysis showed, the gap between “perceived” and “provided” quality of services is minimal. This also means that the indicators strongly depend on each other.
Figure 3 shows the correlation dependence for the indicator "Organization of meals on the way".
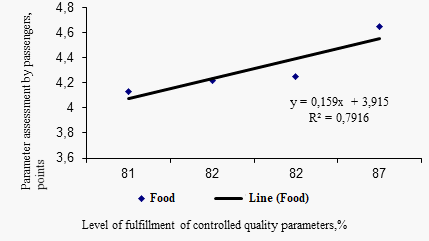
The correlation coefficient for the criterion "Organization of meals on the way" was R = 0.9, that also indicates a high dependence between the data.
Figure 04 presents a general correlation analysis for all the indicators considered in the table.
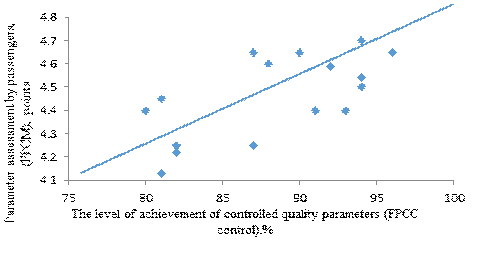
The value of the indicator is R = 0,65, which is more than the critical value. Therefore, there is a relationship between the indicators.
Figure 05 shows the example of GAP-analysis made for the criterion "Cashiering".
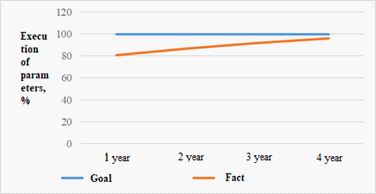
As Figure 05 shows, the gap between the target indicator of the travel service quality and the actual values has been narrowing over 4 years of the study. This means that the actual service quality was improved, and the target state has been actually achieved.
Purpose of the Study
The purpose of the study is to develop a methodology for researching indicators of the quality of passenger service to increase the customer focus of railway companies.
Research Methods
The study was carried out using the analysis of processes that ensure the quality of passenger service.
Findings
We have proposed a method to evaluate the quality of transport services organized for passengers. When studying the correlation between the evaluated indicators, we recommend to additionally use the GAP-analysis for determining the discrepancy between the estimated indicators. This will let us develop a unified list of criteria for joint analysis of the transport services quality.
Conclusion
An analysis of the processes related to passenger service allowed us to diagnose significant gaps in the quality of service. Railway transport works in conditions of tough competition with other types of transport (Good & Olentsevich, 2019; Panova et al., 2014). Competitiveness can be improved, for example, by applying a client-oriented approach. For this, it is relevant to conduct a more complex study of the indicators of the service quality. Correlation analysis can be used for proving the hypothesis about the statistical dependence of the values of the estimated indicators obtained by the marketing research and from the client service sector research. For obtaining the correlation between the evaluated indicators, we recommend to additionally use the GAP-analysis for determining the inconsistency between the estimated indicators.
The use of correlation analysis will allow to timely identify inconsistencies in the data obtained by the client services sector and the marketing sector. This will help to receive a more realistic view of the quality of passenger services.
References
Bulokhova, T. A. (2016). On the issue of improving the quality of transport services. Modern approaches to management in transport and logistics: collection of materials of the All-Russian scientific and practical conference, (p. 33) Moscow State Transport University.
Bulokhova, T. A., & Bulokhov, A. P. (2015). Improving methodological approaches to assessing the quality of passenger traffic. Transport infrastructure of the Siberian region: materials of the Sixth International Scientific and Practical Conference dedicated to the 40th anniversary of the founding of Irkutsk State University of Railways, 2, (p. 62) Irkutsk: IrGUPS.
Development strategy of Federal Passenger Company JSC until 2030 (2018). Reporting materials in accordance with the terms of reference.
Elizariev, M. Yu. (2012). Assessment of the quality of transport services for the population. Economy of railways, 5, 92-97.
European Union standard EN 13816 (2002). "Transportation - Logistic and Services - Public passenger transport - Service quality definition, Targeting and measurement".
GOST R51004-96 “Transport services. Passenger Transportation. Nomenclature of quality indicators”.
Good, Yu. O., & Olentsevich, A. A. (2019). Analysis of the factors affecting the indicators of the detailing of the RDZhV Armed Forces, taking into account the basic principles of customer focus. In the collection: SOCIETY - SCIENCE - INNOVATIONS. A collection of articles on the results of the All-Russian Scientific and Practical Conference, pp. 60-62.
Gromyshova, S. S., Astashkov, N. P., Olentsevich, V. A., & Lobanov, O. V. (2019). Assessment of the level of safety of complexly structured transport systems in order to increase their competitiveness in the market of transport services. Modern technologies. System analysis. Modeling, 2(62), 250-259.
Kukartseva, A. V. (2016). GAP - analysis as a tool to improve the efficiency of the Company's strategy implementation. Integration of modern scientific research into the development of society: materials of the International Scientific and Practical Conference: in 2 volumes, (pp. 375-378) Kemerovo: West Siberian Scientific Center.
Larin, A. N., & Larina, I. V. (2017). Customer-oriented approach in the structural divisions of JSC Russian Railways. Economy of railways, 11, pp. 30-37.
Makeev, V. A., & Oksenyuk, E. E. (2013). The quality system of transport activities: the sequence of construction and assessment of parameters. Bulletin RGUPS, 2.
Olentsevich, V. A., & Belogolov, Yu. I. (2016). A systematic approach to the management and control of human resources in the organization of the uninterrupted operation of the railway transport system. Modern technologies. System analysis. Modeling, 2(50), 90-95.
Olivková, Ivana (2016). Evaluation of quality transport criteria in terms of passenger satisfaction. Transport and Telecommunication, 17(1), 18-27.
Panova, Y., Korovyakovsky, E., & Bessolitsyn, A. (2014). Rail passenger transport of Russia: analysis and prospects (Review article). Russian Journal of Logistics and Transport Management: Petersburg State Transport University, 1(2).
Railway transport in Russia: challenges until 2025 (2019). Institute of Natural Monopolies.
Silicheva, G. V., Bulokhova, T. A., & Podgornova, E. S. (2016). Methodological approaches to quality management in railway transport in the context of industry reform. Irkutsk: IrGUPS,
Surkov, L. P., & Silicheva, G. V. (2016). Customer focus: “one-stop shop” services. Economics and Entrepreneurship, 0-1(75), pp. 491-497.
Tereshina, N. P., Zhakov, V. V., & Filimonova, Z. V. (2017). Increasing the competitiveness and quality of freight traffic. Economy of railways, 8, pp. 41-49.
Copyright information

This work is licensed under a Creative Commons Attribution-NonCommercial-NoDerivatives 4.0 International License.
About this article
Publication Date
01 July 2021
Article Doi
eBook ISBN
978-1-80296-112-6
Publisher
European Publisher
Volume
113
Print ISBN (optional)
-
Edition Number
1st Edition
Pages
1-944
Subjects
Land economy, land planning, rural development, resource management, real estates, agricultural policies
Cite this article as:
Gozbenko, V. E., Olentsevich, V. A., Kargapoltsev, S. K., Bulokhova, T. A., Karlina, Y. I., Shtayger, M. G., & Karlina, A. I. (2021). Application Of Correlation Analysis In The Study Of Passenger Service Quality Indicators. In D. S. Nardin, O. V. Stepanova, & V. V. Kuznetsova (Eds.), Land Economy and Rural Studies Essentials, vol 113. European Proceedings of Social and Behavioural Sciences (pp. 898-906). European Publisher. https://doi.org/10.15405/epsbs.2021.07.107