
The European Parliament after Brexit


Abstract
The allocation of seats in the European Parliament (EP) according to the Treaty of Lisbon, must comply with the principle of degressive proportionality. The rule can be either in the form of rounded degressive proportionality or unrounded degressive proportionality. This paper deals with expected compositions of the EP after the likely exit of the United Kingdom from the European Union bodies. We present the allocations of seats among the member states generated by means of simulation algorithms selected from the literature. These allocations are mostly unrounded degressively proportional, whereas using the approach developed in previous papers and considering all feasible allocations, we always achieve rounded degressively proportional allocations. We discuss the attained results and indicate the most appropriate allocation and methodology.
Keywords: Degressive proportionalityEuropean ParliamentBrexit
Introduction
The decision made by people voting in the United Kingdom European Union membership referendum that took place on 23 June 2016 has significantly changed many economic and political circumstances. Among other problems evidently affected by Brexit is how the composition of the European Parliament is developed. The main legal act regulating the issue is adopted in 2007 Treaty of Lisbon. Since its ratification, the binding rule of the allocation of seats among the European Union member states has been the degressive proportionality approach that departs from the classic Aristotelian principle of how goods should be distributed and gives preference to smaller countries of the Community to greater countries’ disadvantage. The respective provision concerning this issue reads precisely as follows: “
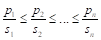
Considering the additional specification made by the European Parliament 2007 resolution (Lamassoure & Severin, 2007), the idea of degressively proportional allocation can be expressed as a set of four conditions. Assume that


(DP 1)

(DP 2)
(DP 3)


(DP 4)
Conditions (DP 1) and (DP 2) express the essence of degressive proportionality. Conditions (DP 3) and (DP 4) are arbitrarily imposed due to technical and political reasons, and we call them boundary conditions.
Mathematical analysis of the boundary conditions the reader will find in (Łyko 2012). The rule of degressive proportionality identified in this way is known in the literature as “rounded degressive proportionality” (RDP). Because of some difficulties with the consent regarding the allocation algorithm, this rule is endorsed in a weaker form as a so-called “unrounded degressive proportionality” (UDP). According to the UDP, the numbers of seats allocated are established subject to the condition (DP 2) only before rounding to integers (Ramírez González et al., 2012; Delgado-Márquez et al., 2013). A suggestion to introduce required legal amendments that would endorse the UDP, was made among others by Grimmett et al. (2011).
During the first four terms of the European Parliament, i.e. before the Treaty of Lisbon was passed, the seats were allocated in compliance with the degressive proportionality rule, even in its RDP form, although the rule as such was not explicitly referred to (Cegiełka, 2010). Afterwards, it was never the case. What is more, after the ratification of the Lisbon Treaty, the new binding rule was deliberately suspended, based on a resolution that sanctioned the case (Gualtieri & Trzaskowski, 2013). The state of affairs can be explained by at least two factors. First, the number of feasible solutions is definitely large, thus creating a space for various interpretations of the Lisbon Treaty, i.e. leading to political negotiations. For example, the sequence of population numbers in 2012 generates more than 5 million feasible allocations of seats for the term of 2014–2019. Second, and undoubtedly more important factor, is the willingness to maintain the political status quo. During all terms and in times of successive enlargements of the European Union that resulted in major changes, the great attention was paid so as not to modify much the current numbers of seats in the European Parliament allocated to respective countries. One could see it especially when the composition of the assembly for the 2014–2019 term was being formed, and the European Parliament resolution provided a stable solution defining the rule that “
As the United Kingdom withdraws the bodies of the European Community, many negative consequences may follow, however, this is also a great opportunity to sort out issues regarding the composition of the European Parliament. If we maintain unchanged (DP 3) and (DP 4), the original boundary conditions of allocation, then the number of all feasible allocations subject to the RDP for 27 countries will significantly rise. However, many of these allocations do not reduce any current number of mandates given to member countries. As a result, the most important factor disappears that impeded the adjustment of the European Parliament structure to the provisions of the Treaty. The political factor has no longer a significant influence on the distribution of seats. It is therefore worthwhile beginning again the reflections on how to specify the actual allocations that previously could not be implemented due to the mentioned political constraints. One should reconsider the recommendation stating that “the ideal alternative would be to agree on an undisputed mathematical formula of
Unrounded degressively proportional allocations
The allocation of seats in the EP inspired many algorithms that can serve as generators of its composition subject to provisions of the Lisbon Treaty. We proceed now to an analysis of a hypothetical structure of the Parliament generated by several methods that are most frequently discussed in the literature. The methods are:
the parabolic method by Ramírez,
base+prop (Cambridge Compromise),
maxprop,
base+power,
Hamilton’s generalized method
For each method, the allocations of seats in the EP will be presented in two variants: with the United Kingdom, i.e. the European Union of 28 states, and without the United Kingdom – the Community of 27 states.
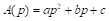
The parabolic method
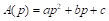
The parabolic method, put forward by Ramírez González (2007), is based on a quadratic allocation function
The parabolic method was one of the earliest propositions to allocate the seats in the EP. According to some Members of the Parliament, “
The distribution of seats in the EP provided by the parabolic method is presented in Table 

Cambridge Compromise (base+prop)
The Cambridge Compromise (CC) is an extension of shifted proportionality proposed by Pukelsheim (2007, 2010). After further clarification of its elements made by a special symposium at Cambridge (The meeting took place in the Centre for Mathematical Sciences, Cambridge University, on 28–29 January 2011. The participants authored a report from the meeting (Grimmett et al., 2011).) , it is known as a base+prop method, and the entire framework proposed at the symposium was called the Cambridge Compromise (Grimmett et al., 2011). According to this idea, each state is allocated a fixed number of seats (called the base), and the remaining seats are allocated by classical methods of proportional allocations. The participants considered different choices of base b and rounding methods when allocating the remaining seats. They eventually agreed to recommend


Maxprop
Allocations given by the base+prop method are relatively distant from a proportional division due to the idea of the method. The issues of discrepancy between actual allocations and proportional allocations have been studied, among others, by Karpov (2008), Łyko (2013) and Dniestrzański (2014b). As regards the Cambridge Compromise, a proportional allocation applies only to seats remaining after the base assignment of 6 mandates to each member state. An alternative for the CC can be a maxprop method proposed by Dniestrzański & Łyko (2015). The maxprop method is formulated similarly to the Cambridge Compromise. The main difference concerns the linear function applied as a basis of seat allocation, that passes through the origin, i.e. our linear function of allocation passes through the point (0,0) subject to the constraints


Base+power
The method of shifted proportionality and the parabolic method are often presented in official documents of the European Parliament (Lamassoure & Severin, 2007; Gualtieri & Trzaskowski, 2013) as referential for upcoming compositions of the European Parliament. It is believed that they are very close to the idea of degressive proportionality (for example Moberg, 2012). The literature also makes a case for employing a base+power method that is based on the allocation function


When


C – 2014–2019 term; D – proportional to 2014–2019 term, downward rounding to the nearest integer; E – maxprop n=28; F – maxprop n=27; G – Cambridge Compromise n=28; H – Cambridge Compromise n=27; I – parabolic n=28,


n=28; N – base+power,

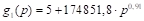
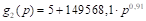
Hamilton’s generalized method
This method was proposed by Cegiełka & Łyko (2014) who combined classical proportional allocations with degressive proportionality. First, a real sequence of values of the quadratic allocation function is determined


Table
Analysis
Allocations presented in Table 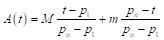
In addition to the number of allocated seats, an equally important issue when deciding about the composition of the Parliament is the compliance with the binding law. The report by Lamassoure & Severin (2007) states that a fundamental component of the degressive proportionality principle included in the Treaty of Lisbon is the condition (DP 2) dealing with rounded degressive proportionality. All above analyzed methods may be incompatible with the RDP. A detailed analysis of allocations in Table
Rounded degressively proportional allocations
The inability of algorithms described in section 
The aforementioned algorithm LaRSA also returns a minimum


When comparing the numbers


France and Spain are similarly positioned as their minimum possible allocation of seats equal 77 and 55, respectively, is greater than 74 and 54 mandates held at present. These countries will also gain when the forthcoming allocation is rounded degressively proportional. There are also five countries comprising Luxembourg, Cyprus, Estonia, Croatia and Ireland that never lose compared to their current allocations, regardless of the specific RDP allocation. At present, the seven mentioned countries suffer mostly a disadvantage of degressive allocation in the current term. Oddly enough, the countries in this group are small, medium and large as regards their populations. This fact may imply that the current allocation of seats in the European Parliament is quite random.
The unfavourable changes may affect mostly Romania, with possible loss of 6 mandates in the worst case. In relative terms, Lithuania may suffer from the most unfavourable change, with loss of 3 mandates, or more than 27 percent of what they currently hold. Nevertheless, due to expected redistribution of 73 mandates assigned currently to the United Kingdom, a new allocation globally will result in more gains than losses. The total number of seats to be lost by member states is 49, while the total number of seats to gain, at the maximum, is 291.
Analyses presented in section
One of the solutions that is free from the mentioned weakness is presented by Łyko & Rudek (2013). The authors employ the allocation function defined by the formula


D – 2014–2019 term; E –


It is certainly rounded degressively proportional. Thus, there is no need to relax the requirements concerning the levels of UDP sequences, and the solution obtained better reflects the original, legally declared idea of degressive proportionality. In addition, no member country is assigned less mandates than currently, with Hungary being a single country assigned the same number of seats they are holding now. Therefore, the scheme is politically neutral, does not reduce the number of representatives of any country and there is no need to withdraw a mandate. It is also worth underlining that compared to proportionally increasing numbers of seats in the European Parliament shown in Table
Conclusion
The exit of the United Kingdom from the European Union results in a significant increase of number of RDP allocations. More than half of them are advantageous for all the member states in the sense that each state gets at least the same number of seats as currently held. Undoubtedly, 3.6 billion options offer a wide bartering area to bodies that decide upon the composition of the Parliament. On the other hand, reviewing all feasible solutions from such a huge pool is practically unworkable. The choice of a criterion that will actually indicate one specific solution definitely improves the entire process of allocating seats. Our proposition of a minimizing criterion has two significant strengths. On the one hand, it reflects the variance of population in the member states, while on the other hand, it ensures a suitable representation of smaller states. As a result, it combines the main ideas of the composition of the EP. The algorithm maybe is not a simple method, but it generates all existing RDP solutions. The criterion itself can be modified according to a sense of fairness or in the course of political negotiations. As a result, regardless of where the emphasis is put with regard to the composition of the EP, an RDP allocation will be always ensured. The exit of the United Kingdom from the Community results in numerous allocations, and many of them satisfy the postulate of maintaining the numbers of mandates at least at the same level, therefore, it seems inappropriate to relax the degressive proportionality requirements and to consider the UDP allocations.
Acknowledgements
The results presented in this paper have been supported by the Polish National Science Centre under grant no. 2013/09/B/HS4/02702.
References
- Balinski, M. & Young, H.P. (1982). Fair Representation: Meeting the Ideal of One Man, One Vote. Yale University Press.
- Cegiełka, K. (2010). Distribution of seats in the European Parliament in accordance with the principle of degressive proportionality. Mathematical Economics, 6 (13), 21–32.
- Cegiełka, K & Łyko, J. (2014). Application of Hamilton’s and divisor methods to degressively proportional allocation functions. Procedia – Social and Behavioral Sciences, 110, 103–112.
- Delgado-Márquez, B. & Kaeding, M. & Palomares, A. (2013). A more balanced composition of the European Parliament with degressive proportionality. European Union Politics, 14, 458–471.
- Dniestrzański, P. & Łyko, J. (2015). Proportionality in the issue of distribution of seats in the European Parliament. Proceedings of the 4th International Conference on Computer Science & Computational Mathematics (ICCSCM 2015). 7–8 May 2015, Langkawi, Malaysia. 542–546.
- Dniestrzański, P. (2014 a). The proposal of allocation of seats in the European Parliament – the shifted root. Procedia – Social and Behavioral Sciences, 124, 536–543.
- Dniestrzański, P., (2014 b). Proposal for measure of degressive proportionality. Procedia – Social and Behavioral Sciences, 110, 140–147.
- Grimmett, G. & Laslier, J.-F. & Pukelsheim, F. & Ramirez – González, V. & Rose, R. & Słomczyński, W. & Zachariasen, M. & Zyczkowski, K. (2011). The allocation between the EU member states of the seats in the European Parliament. European Parliament, Directorate-General for Internal Policies, Policy Department C: Citizen’s Rights and Constitutional Affairs (PE 432.760).
- Gualtieri R. & Trzaskowski R. (2013). Report on the composition of the European Parliament with a view to the 2014 elections. A7-0041/2013.
- Karpov, A. (2008). Measurement of disproportionality in proportional representation system. Mathematical and Computer Modelling, 48, 1421-1438.
- Lamassoure A. & Severin A. (2007). Report on the composition of the European Parliament. A6-0351/2007, 2007.
- Łyko, J. & Rudek, R. (2013). A fast exact algorithm for the allocation of sets for the EU Parliament. Expert Systems with Applications, 40, 5284–5291.
- Łyko, J. (2012).The boundary conditions of degressive proportionality. Procedia - Social and Behavioral Sciences, 65, 76-82.
- Łyko, J., (2013). Boundary, internal and global measure of the degression of distribution. Procedia Economics and Finance, 5, 519–523.
- Moberg, A. (2012). EP seats: the politics behind the math. Mathematical Social Sciences 63 (2), 78–84.
- Official Journal of the European Union (2012), C 326, vol. 55.
- Pukelsheim F. (2014). Proportional Representation. Apportionment Methods and Their Applications. Springer.
- Pukelsheim, F. (2007). A Parliament of degressive representativeness? Institut für Mathematik, Universität Augsburg, Preprint Nr 015/2007.
- Pukelsheim, F. (2010). Putting citizens first: Representation and power in the European Union. In: Institutional Design and Voting Power in the European Union (Eds. M. Cichocki, K. Życzkowski), Ashgate: London 2010, 235–253.
- Ramírez González, V. (2007). Degressive proportionality. Composition of the European Parliament. The parabolic method. International workshop “Distribution of power and voting procedures in the European Union”, Natolin European Centre, Warsaw, October 12–13, 2007.
- Ramírez González, V., Martínez-Aroza, J., Márquez García, M. (2012). Spline methods for degressive proportionality in the composition of European Parliament. Mathematical Social Sciences 63 (2), 114–120.
- Słomczyński W. & Życzkowski K. (2012). Mathematical aspects of degressive proportionality. Mathematical Social Sciences, 63 (2), 94–101.
- Treaty of Lisbon (2007). Official Journal of the European Union, C 306, Volume 50.
Copyright information

This work is licensed under a Creative Commons Attribution-NonCommercial-NoDerivatives 4.0 International License.
About this article
Publication Date
30 November 2016
Article Doi
eBook ISBN
978-1-80296-016-7
Publisher
Future Academy
Volume
17
Print ISBN (optional)
-
Edition Number
1st Edition
Pages
1-471
Subjects
Business, management, behavioural management, macroeconomics, behavioural science, behavioural sales, behavioural marketing
Cite this article as:
Cegiełka, K., Dniestrzański, P., Łyko, J., & Rudek, R. (2016). The European Parliament after Brexit. In R. X. Thambusamy, M. Y. Minas, & Z. Bekirogullari (Eds.), Business & Economics - BE-ci 2016, vol 17. European Proceedings of Social and Behavioural Sciences (pp. 146-157). Future Academy. https://doi.org/10.15405/epsbs.2016.11.02.14