
Quality Auditing in a Logistics Service Provider


Abstract
This study aim is to prove the flexibility of lean six sigma using the DMAIC method in reducing the amount of time spent on auditing, findings, and reporting in a logistics service firm. The Six Sigma is a data-driven, disciplined technique and methodology for reducing defects in any phase aiming for six standard deviations between the mean and the closest design limit, modeled within the DMAIC method (Define, Measure, Analyze, Improve and Control). DMAIC is a method for improving, optimizing, and securing business processes and designs. A major component of Six Sigma tools is the DMAIC improvement phase. The research focuses on identifying the time spent on the auditing process of value-added and non-value-added. The secondary data was then collected by asking/interviewing the auditor. Using the Lean Six Sigma DMAIC approach, the information was analyzed for audit process quality and audit time reduction. Upon the implementation of improvement solutions, the time can be reduced with the current process from the improvement stages through lean six sigma approaches. The company was able to use its lean six sigma implementation skills to make significant improvements, saving time, and money, and improving quality. The study assesses previous research and makes recommendations for future studies.
Keywords: Audit process improvement, audit cycle time reduction, DMAIC, lean principles, logistics service provider, lean six sigma in corporate sector
Introduction
The Coronavirus Disease of 2019 (COVID-19) has spread rapidly across the world, causing health, economic, and social crisis. The pandemic also caused severe economic and financial effects all around them (Goodell, 2020). Compared to the extensive economics-based archival auditing studies on public companies, economic research on privately-owned companies is significantly limited. This is unforeseen, considering that private businesses control plays a vital role in the global economy regarding income, business growth, and investment in innovation and development (Kobe, 2012). Internal auditing is needed in the logistics service industry to incorporate a quality control system because it allows for continuous inspection and measurement of the adequacy and effectiveness of established procedures (Sivan et al., 2022; Sundram, Atikah, Hafiz et al., 2017). With the continuous services and job workload, it appears that auditing is the main problem in delay duration. An is a process that examines financial and critical statement records through a review of an organization's internal control system. Those examinations and studies are intended to obtain audit evidence and form the basis of the auditor's opinion on the financial statements. Due to a checklist of many issues standards, the audit process takes longer to complete, resulting in more time spent preparing results and audit reports in logistics service provider (LSP).
Problem Statement
To prevent any disruptions, the audit team must adhere to strict deadlines (Knechel & Salterio, 2016). To handle the audit findings, concerns, corrective/preventive measures, transparency, and accurate reporting, a proper audit involves audit planning with a thorough auditing process before the beginning of the audit (Mills, 2016; Mourino et al., 2017). Delays in auditing reports often cannot be avoided as they occur with the same issues lacking in the method, workers, machine problem, environment, and organizational structure. The major problem in XYZ LSP is the failure to gather sufficient information, which has to wait for some information from the customer or wait for the documents from the tax, accounting, and secretary departments. The process for obtaining such information and documents is not dated, and it will be slow if the information is not obtained quickly. Thus, the work will have to be delayed, and there will be an increase in work, and it will be difficult to focus on one job (Rasi et al., 2022; Sundram, Rajagopal, Nur Atiqah, et al., 2018). The previous research state that the overall time spent on auditing should be kept under control to ensure a smooth process and prevent delays in reporting findings and concerns. Due to the essential nature of the services rendered, prompt action on audit findings is often needed in the industry (Rowell, 2018). Thus, the study adds to the discussion by using the six-sigma method, including cause-and-effects and Pareto diagram approaches to investigate the causes of audit delays and discover some solutions for improvement in XYX Logistics Service Provider. Hensley and Dobie (2005) proposed the DMAIC steps with special considerations for the services industry.
Literature Review
Six Sigma is defined as identifying and controlling consumer needs and requirements to enhance business processes and cost reduction (Brewer & Eighme, 2005). Meanwhile, according to the studies (Rudisill & Clary, 2014), is technically defined as the realistic strategy, technique, and tool for optimizing procedures, achieving business objectives, and solving problems to improve an organization's efficiency.
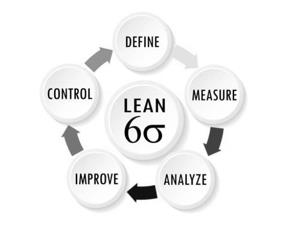
Six Sigma focuses on the number of opportunities within a process that may result in defects rather than the number of defects themselves to avoid quality issues. In methodology, the underlying and systematic DMAIC approach is recognized in this Six Sigma perspective (Sundram, Chandran, Atikah et al., 2016). The DMAIC is a method that is supposed to start by defining the problem and ending with finishing with long-term improvement solutions. The DMAIC (Figure 1) usually refers to:
The defining phase aims to understand and identify the project in line with customer needs and company strategy. Studies find that brainstorming, tree diagrams, process flowcharts, and cause and effect diagram (fishbone) diagrams are some Six Sigma methods that can help understand these processes. During the measurement phase, it covers the baseline of the current process, data collection, validation of the measurement system, and determining the process capability related to the objective. The identification and validation of data accuracy are the most important activities in this process. Analyzing phase is to understand the main process input variables that influence the project's target, identifying the spot problem in the production process that causes defects. It is needed to ensure it generates the potential causes of why the problem occurred or not performing to complete the task. Improve phase aims to conduct the experiment in which all the information is gathered, and the list of potential solutions was developed to improve the flow of the projects that allow removing the problems' root causes (Rajagopal et al., 2016; Sundram et al., 2020). Finally, the control phase ensures that the action item generated in the Improve phase is well-implemented and maintained adequately. To maintain long-term changes, all staff should be aware of how the enhanced process will result in operational and financial gains (Foster, 2007).
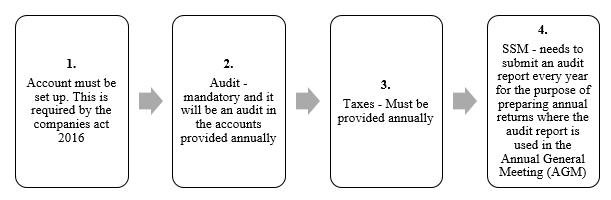
The audit is the core of corporate governance. An audit is a process that examines financial and critical statement records through a review of an organization's internal control system. Studies have shown that the internal audit is critical for ensuring effective resource allocation, preventing misappropriation, and combating fraud and misapplication of a company's resources (Badara & Saidin, 2014). The researchers (Alzeban & Gwilliam, 2014) believe that a company's loss is due to a lack of effective internal auditing procedures. Internal audit effectiveness assessment has attracted research studies due to the broader implementation of internal auditing in corporate governance. As a result, conducting a critical review of the literature on internal audit efficiency is critical. These examinations and studies are intended to obtain audit evidence. An auditor will assess it. It is also intended to form the auditors' opinion on the financial statements to ensure that a company's growth and progress are effective, resulting in stable financial conditions. Figure 2 indicates the evidence that is needed during the auditing process.
Tools and Techniques
Over the years, companies have implemented various tools into the Six Sigma technique throughout time to make it more effective and reduce any gaps during its implementation (Thakore et al., 2014). Flow charts check sheets, Pareto diagrams, cause and effect diagrams, histograms, scatter diagrams, and control charts are seven basic methods to help with the quality improvement process. A is a diagram representing a process or procedure that uses symbols to describe the sequence of steps or phases involved (Sundram, Rajagopal, Atikah, & Subramaniam, 2018). The studies showed that the defects using Pareto analysis could discover major and minor contributors to those defects. Then used cause-and-effect diagrams to identify the primary cause of each flaw.
According to Ahmed and Ahmad (2011), the cause-and-effect diagram (fishbone diagram) is very useful in showing anomalies in the process in the form of excessive variations in the process. A histogram is a quick and useful tool for visualizing frequency distribution and charting historical data to recognize process variation.
Check sheets are a specific form that can systematically help a user document data in a business. Data is collected and classified on the check sheet to record the frequency of specific occurrences throughout the data-collecting period. Defect-location check sheets, tally check sheets, and defect-cause check sheets are three of the most common forms of check sheets, according to (Kerzner, 2009).
A scatter diagram is a tool for illustrating the distribution of two dimensions data, detecting and analysing pattern relationships between two variables. Control charts show the number and type of change in a process over time that explains what is happening during the process, which is important because it allows observing and monitoring processes under "statistical control".
Define
The project charter is typically a short document to describe the entire process from beginning to end, as Table 2 shows lays out the purpose, objectives, stakeholders, risks, resources, and dependencies during the process planning stage.
A SIPOC diagram in Table 3 below is used to identify all essential components of a process improvement project before the works begin and help define a difficult and poorly scoped process.
Process of conducting Audit
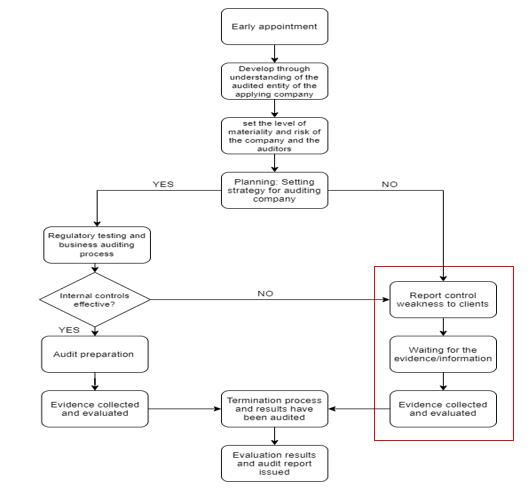
Figure 3 above shows the current audit process where the process is usually caused when there is an ineffective sample, they need to restructure another report control. For instance, where there is information or evidence that is not complete, they need to wait for the information from their clients or other departments before they can begin collecting and restructuring the report again.
Measure
The measuring process offered an analysis of the organization's existing defects, resulting in an improvement in the audit's duration. The audit defects are summarized below.
Table 4 above indicates the most defects that cause the delay in the audit process. The most frequent happen is missing evidence, delay to gather information and lack of workers which indicate errors of 6, 5, and 4 with percentage of 100%, 93.94% and 87.88% respectively. Moreover, the second highest frequent errors of 3 showed restructuring process and lack of auditor with the percentage of 81.82% and 75.76 respectively. For others, that contribute the lowest errors for 2 are lagging systems, poor connection, lack of decision-making, uncomfortable workstation, delay of the audit plan and customer complaints that indicate respectively 63.64%, 55.17, 54.55%, 45.45%,33.33% and 18.18%.
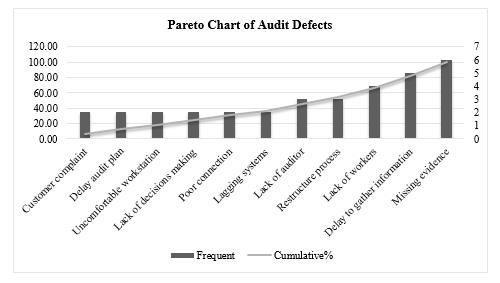
A Pareto Chart in Figure 4 above shows the occurrence of defects and their overall effect. Pareto charts help determine the defects that should be prioritized to achieve the greatest overall change. Therefore, the highest frequent errors need to be eliminated to improve.
Table 5 above shows the current value-added and non-value-added process of conducting an audit that takes about 20 days to complete that is caused by the increased non-value-added which are from unnecessary activities. For example, increases employee waiting time for information to be processed from their clients during information collection (Sundram, Bahrin et al., 2018). Thus, it can cause a waste of time to complete the report on time.
Eliminating or reducing some non-value-added time can improve the value-added activities. Thus, the future for value-added and non-value-added in Table 6 above, has reduced one day from the current day with the total from 20 days to 15 days.
Analysis
The analysis phase finding using the cause and effects diagram (fishbone diagram). It uses to find the root cause of the issues of audit delay. Provided elements such as manpower, machine, organizational support, environment, and method are used to figure out the problems related.
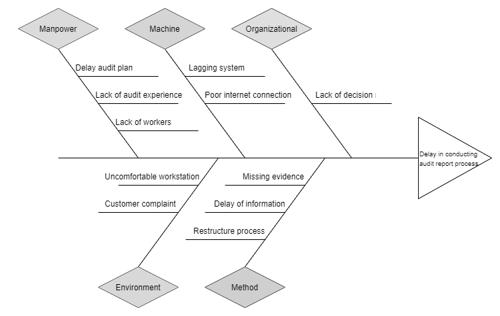
It was found that the root cause analysis shown in Figure 5 above indicates a few significant problems that contribute to the delay of the audit process. After looking at all the figures, the most frequent problem that happens during the audit process is when the evidence is missing. The conflict of missing evidence includes missing documents, which sometimes the auditor cannot find when the job is overloaded. The quality of the auditor's findings is based on the reliability of the audit evidence. According to the researcher, if the reported information is weak or of poor quality, the audit risk of issuing an inaccurate audit is high (Rose et al., 2017).
Second is the delay of information. The auditor needs to wait for the document or information from sources such as clients, the tax department, the accounting department, and the secretary department to complete the task before the audit process begins. As a condition of COVID-19, auditors are more likely to rely on information collected directly from external parties, such as consumers, suppliers, or banks, which is more accurate than evidence obtained from clients (PWC, 2020). Unable to complete can cause an increase in delay duration. Late to gather information from clients which sometimes unable to contact them, unexpected change information or evidence from clients that they do not inform (Sundram, Atikah, Natarajan, et al., 2016).
Lastly, the firm currently lacks workers to do an accounting job. They need to key in the client's information, such as client account statements and other information they need to do before conducting the audit report (Ali et al., 2020). When there is a worker shortage, employees' tasks increase, resulting in failures and other inefficiencies and negatively affecting individual performance, client service, and organizational performance.
Improve
The improved phase aimed to create a pull-on demand to achieve the goal of reducing audit time delays. The risk assessment is important in eliminating non-value-added hours from the process that impact the process and relevant items.
The recommended process of the redesign is based on the improvement and analysis phase (Table 7) above, which will take the form of a new audit process flow chart. A significant improvement is needed due to high frequent issues such as delay of information, missing evidence and lack of workers. The delay of information due to the waiting time of clients needed to hand over the information or original evidence to the company will improve by emailing, which can save time, reduce travel to remote regions, less paper required, and witness and track audits in real-time.
For missing evidence of any parties due to carelessness, the auditor can create any standardized audit report form that all auditors can use, which can be “fill in the blank” so any observation can be entered efficiently. Lastly, a lack of workers can only be identified by employer efforts to acquire additional staff in the absence of vacancy measures. If a shortage occurs, employers will recruit more. Employers would also increase over time, lower minimum qualifications, restructure work to use less “shortage” occupations, train workers, improve working conditions, pay the benefits, contract out work, and turn down work to reduce the worker shortage (Barnow et al., 2013).
Control
According to the research, the control phase is used to monitor and standardize the solution to ensure that the source of the problem is managed and obtain support from management (Almasarweh & Rawashdeh, 2016; Jaffal et al., 2017; Rana & Kaushik, 2018; Sundram, Atikah, & Chandran, 2016; Syakirah et al., 2020). After strategic management, the final audit procedure is developed to ensure that everyone decides to perform the audit following the specified specifications. The final procedure was reduced from 13 to 10 stages, with a total audit period of 15 days.
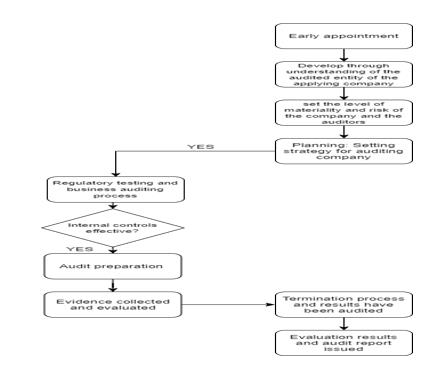
Figure 6 above showed the improvement in the audit process that has been changed. The changes happen when there is elimination due to ineffective control after regulatory testing and the business auditing process. The elimination of waiting time on receiving evidence and information from clients can reduce the time delay of 5 days. During the pandemic Covid-19, unable to cross countries and states, the clients will use email and post evidence and documents to be used for the audit, which has decreased the usage of original forms, such as original invoices, which are more reliable than copy invoices sent by email in supporting payments transactions. Moreover, hiring more workers reduce the shortage of workersng this can reduce the delay of time waiting and can affect the adequacy and reliability of audit evidence, which may impact audit quality (KPMG, 2020).
Conclusion
In the final analysis, the Six Sigma approach is effective in increasing the internal audit process. The process which implements Lean Six Sigma has shown the improvement results in a new audit process solution. The new audit improvement process had a total covered time of 15 days, with 10 steps to complete the entire activity. According to the project charter, the results of the phase time and measures were consistent with the required target of the implementation, as seen in Table 1. The DMAIC phases offered the most effective methods for improving the audit process. The lean principles reduced the amount of time spent on non-value-adding systems. To find the root causes of the issue, each possible cause is tested using DMAIC methods and actual process investigation by asking questions to the staff. Finally, ideas were developed and laid out for testing.
The use of DMAIC methods has provided the firm with a new possibility for quality improvement, not just in terms of internal auditing, but also in terms of the tools' potential use in other areas. Currently, Six Sigma should be viewed as a corporate strategy to improve profitability by eliminating waste, minimizing costs, and enhancing efficiency and effectiveness to fulfill consumer expectations (Kowalik & Klimecka-Tatar, 2018; Selvaraju et al., 2017). The continuously changing environment and growing customer demands require continuous development.
Last but not least, the studies showed that management must be proactive, and employees at all levels must communicate and collaborate (Akmal et al., 2016; Mishra & Sharma, 2014; Sundram et al., 2011). Some of the benefits of Six Sigma include enhanced customer loyalty, employee productivity, cross-functional coordination across the organization, consistent quality of service, and increased knowledge of problem-solving tools and techniques (Anthony, 2004; Kwak & Anbari, 2006; Sehwail & DeYong, 2003). Problems were systematically addressed by collecting data, analyzing several factors, and extracting the root causes using a fishbone diagram, risk assessment analysis, and Pareto chart. This paper also shows how Six Sigma can be applied to a service sector with low-volume demand.
Acknowledgement
We express our sincere appreciation to the Universiti Teknologi MARA and the Institute of Research Management & Innovation (IRMI), UiTM Shah Alam for their indispensable assistance in facilitating the execution of this research. The research project was facilitated by the Strategic Research Partnership Grant (SRP) bestowed by UiTM Selangor [Project code: 600-RMC 5/3/SRP (059/2022)].
References
Ahmed, M., & Ahmad, N. (2011). An application of Pareto analysis and cause-and-effect diagram (CED) for minimizing rejection of raw materials in lamp production process. Management science and engineering, 5(3), 87.
Akmal, A. O., Sundram, V. K., Sayuti, N. M., & Atikah, S. B. (2016). The relationship between supply chain integration, just-in-time and logistics performance: A supplier’s perspective on the automotive industry in Malaysia. International journal of supply chain management, 5(1), 44-51.
Ali, S. N. R., Rajagopal, P., Sundram, V. P. K., Saihani, S. B., & Noranee, S. (2020). ERP System Implementation in a Leading LED Manufacturing in Malaysia: A Supply Chain Perspective. International Journal of Supply Chain Management, 9(2), 104.
Almasarweh, M. S. Y., & Rawashdeh, A. M. (2016). The Effect of Using Six Sigma Methodologies on the Quality of Health Service: A Field Study at Prince Hashem Hospital /City of Aqaba. Journal of Social Sciences (COES&RJ-JSS), 5(3), 396-407. DOI:
Alzeban, A., & Gwilliam, D. (2014). Internal Audit Effectiveness: Relevant Drivers of Auditees’ Satisfaction. International Journal of Auditing, 13, 43-60.
Anthony, J. (2004). Six sigma in the UK service organizations: results from a pilot survey. Managerial Auditing Journal, 19(8), 1006-1013.
Badara, M. A., & Saidin, S. Z. (2014). Empirical Evidence of Antecedents of Internal Audit Effectiveness from Nigerian Perspective. Middle-East Journal of Scientific Research, 19, 460-471.
Barnow, B. S., Trutko, J., & Schede Piatak, J. (2013). Occupational Labor Shortages: Concepts, Causes, Consequences, and Cures. DOI:
Brewer, P., & Eighme, J. (2005). Using Six Sigma to improve the finance function. Strategic Finance, 86(7), 27–33.
Foster, S. T., Jr. (2007). Does Six Sigma Improve Performance? Quality Management Journal, 14(4), 7-20. DOI:
Goodell, J. W. (2020). COVID-19 and finance: Agendas for future research. Finance Research Letters, 35, 101512. DOI: 10.1016/j.frl.2020.101512
Hensley, R. L., & Dobie, K. (2005). Assessing readiness for six sigma in a service setting. Managing Service Quality: An International Journal, 15(1), 82-101. DOI:
Jaffal, M. S., Korkmaz, I. H., & Özceylan, E. (2017). Critical success factors for Six Sigma implementation in Gaziantep carpet companies. Industrial Eng. Let, 7(2), 83-92.
Kerzner, H. (2009). Project Management: A Systems Approach to Planning, Scheduling, and Controlling (10th Ed.). John Wiley & Sons, Inc.
Knechel, W. R., & Salterio, S. E. (2016). Auditing: Assurance and risk. Taylor & Francis.
Kobe, K. (2012). Small Business GDP: Update 2002-2010. Economic Consulting Services, LLC Washington, DC 20036. https://www.jpmorganchase.com/institute/research/small-business/small-business-dashboard/economic-activity
Kowalik, K., & Klimecka-Tatar, D. (2018). The process approach to service quality management. Production Engineering Archives, 18(18), 31-34. DOI:
KPMG. (2020). COVID-19: Potential impact on financial reporting. Retrieved on April 27, 2020, from https://home.kpmg/xx/en/home/insights/2020/03/covid-19-financial-reporting-resource-centre.html
Kwak, Y. H., & Anbari, F. T. (2006). Benefits, obstacles, and future of six sigma approach. Technovation, 26(5-6), 708-715. DOI:
Mills, R. W. (2016). The interaction of private and public regulatory governance: The case of association-led voluntary aviation safety programs. Policy and Society, 35(1), 43-55. DOI:
Mishra, P., & Sharma, R. K. (2014). A hybrid framework based on SIPOC and Six Sigma. International Journal of Quality & Reliability Management, 31(5) 522-546.
Mourino, D. E., Reason, J., Johnston, N., & Lee, R. B. (2017). Beyond aviation human factors: Safety in high technology systems. Routledge.
PWC. (2020). COVID-19: Responding to the business impacts of Coronavirus. Retrieved on April 27, 2020, from PWC: https://www.pwc.com/gx/en/issues/crisis-solutions/covid-19.html
Rajagopal, P., Azar, N. A. Z., Atikah, S. B., Appasamy, G., & Sundram, V. P. K. (2016). Determinants of supply chain responsiveness among firms in the manufacturing industry in Malaysia. International Journal of Supply Chain Management, 5(3), 18-24.
Rana, P., & Kaushik, P. (2018). Initiatives of six-sigma in an automotive ancillary unit: A case study. Management Science Letters, 569-580. DOI:
Rasi, R. Z., Rakiman, U. S. B., Radzi, R. Z. R. M., Masrom, N. R., & Sundram, V. P. K. (2022). A Literature Review on Blockchain Technology: Risk in Supply Chain Management. IEEE Engineering Management Review, 50(1), 186-200. DOI:
Rose, A. M., Rose, J. M., Sanderson, K.-A., & Thibodeau, J. C. (2017). When Should Audit Firms Introduce Analyses of Big Data Into the Audit Process? Journal of Information Systems, 31(3), 81-99. DOI:
Rowell, J. (2018). Do organisations have a mission for mapping processes? Business Process Management Journal, 24(1), 2-22. DOI:
Rudisill, F., & Clary, D. (2014). The management accountant’s role in Six Sigma. Strategic Finance, 85(5), 35–39.
Sehwail, L., & DeYong, C. (2003). Six Sigma in health care. Leadership in Health Services, 16(4), 1-5. DOI:
Selvaraju, M., Beleya, P., & Sundram, V. P. K. (2017). Supply chain cost reduction using mitigation & resilient strategies in the hypermarket retail business. International Journal of Supply Chain Management, 6(2), 116-121.
Sivan, S., Ghadiri, S. M., Rajagopal, P., Atikah, S. B., & Sundram, V. P. K. (2022). Adoption and Benefit of Industrial Revolution 4.0 in Logistics Industry: A Conceptual Paper. Journal of Entrepreneurship, Business and Economics, 10(2S1), 79-94.
Sundram, V. P. K., Atikah, S. B., & Chandran, V. G. R. (2016). Supply Chain Management: Principles, Measurement and Practice. University of Malaya Press.
Sundram, V. P. K., Atikah, S. B., Hafiz, M. Z., Azimah, D., Shahrin, N., & Thirunavukkarasu, K. (2017). Supply chain logistics: A Malaysian perspective. Petaling Jaya, Selangor Malaysian Logistics and Supply Chain Association.
Sundram, V. P. K., Atikah, S. B., Natarajan, V. D., Hariri, S., Rajagopal, R., & Krishnasamy, T. (2016). Technology & Industrial Management. MLSCA, Selangor.
Sundram, V. P. K., Bahrin, A. S., Abdul Munir, Z. B., & Zolait, A. H. (2018). The effect of supply chain information management and information system infrastructure: The mediating role of supply chain integration towards manufacturing performance in Malaysia. Journal of Enterprise Information Management, 31(5), 751-770. DOI: 10.1108/jeim-06-2017-0084
Sundram, V. P. K., Chandran, V. G. R., Atikah, S. B., Rohani, M., Nazura, M. S., Akmal, A. O., & Krishnasamy, T. (2016). Research Methodology: Tools, Methods and Techniques. MLSCA, Selangor.
Sundram, V. P. K., Chhetri, P., & Bahrin, A. S. (2020). The Consequences of Information Technology, Information Sharing and Supply Chain Integration, towards Supply Chain Performance and Firm Performance. Journal of International Logistics and Trade, 18(1), 15-31. DOI:
Sundram, V. P. K., Rajagopal, P., Atikah, S. B., & Subramaniam, G. (2018). The role of supply chain integration on green practices and performance in a supply chain context. A conceptual approach to future research. International Journal of Supply Chain Management, 7(1), 95-104.
Sundram, V. P. K., Rajagopal, P., Nur Atiqah, Z. A., Atikah, S. B., Appasamy, G., & Zarina, A. M. (2018). Supply chain responsiveness in an Asian global electronic manufacturing firm: ABX energy (M). International Journal of Supply chain management, 7(2), 23-31.
Sundram, V. P. K., Razak Ibrahim, A., & Chandran Govindaraju, V. G. R. (2011). Supply chain management practices in the electronics industry in Malaysia: Consequences for supply chain performance. Benchmarking: An International Journal, 18(6), 834-855. DOI:
Syakirah, N., Rajagopal, P., Sundram, V. P. K., Zuraidah, R. R., Ratna, M. N., & Zamry, G. (2020). Achieving Supply Chain Excellence through Effective Supplier Management: A Case Study of a Marine Organisation. International Journal of Supply Chain Management, 9(4), 11-23.
Thakore, R., Dave, R., Parsana, T., & Solanki, A. (2014). A review: Six Sigma implementation practice in manufacturing industries. International Journal of Engineering Research and Applications, 4(11), 63-69.
Copyright information

This work is licensed under a Creative Commons Attribution-NonCommercial-NoDerivatives 4.0 International License.
About this article
Publication Date
06 May 2024
Article Doi
eBook ISBN
978-1-80296-132-4
Publisher
European Publisher
Volume
133
Print ISBN (optional)
-
Edition Number
1st Edition
Pages
1-1110
Subjects
Marketing, retaining, entrepreneurship, management, digital marketing, social entrepreneurship
Cite this article as:
Rusdin, H. A., Ghapar, F., Osman, M. F., Sundram, V. P. K., Lian, C. L., Wahab, S. N., & Mat, A. (2024). Quality Auditing in a Logistics Service Provider. In A. K. Othman, M. K. B. A. Rahman, S. Noranee, N. A. R. Demong, & A. Mat (Eds.), Industry-Academia Linkages for Business Sustainability, vol 133. European Proceedings of Social and Behavioural Sciences (pp. 485-498). European Publisher. https://doi.org/10.15405/epsbs.2024.05.41