
Labor Productivity As A Factor Of Sustainable Development Of The Region's Territories


Abstract
The article is devoted to the formation of a system of indicators and production indicators built on their basis, aimed at ensuring the sustainability of the economy of the sectors of the territories within the raw material regions and making the necessary management decisions that create conditions for the balance of all its structural elements. The basic non-raw materials industries of the Krasnoyarsk Territory are considered, which are involved in the process of productivity growth as an indicator of competitiveness and ensuring the sustainability of the development of the region's territory. A system of indicators of labour productivity within the framework of non-resource industries and indicators of achieving the efficiency potential calculated on their basis is proposed. The characterization of the state and growth of labour productivity is based on the factor analysis of resources and the results of their use. Labour productivity potential is assessed in terms of production, labour, financial and investment potentials. The database and the obtained results of the study can be used to create a system for monitoring the sustainability of the economic system in the context of industries in terms of labour productivity and can be transformed into larger local formations at the level of macro-districts and the region as a whole, as well as for the operational management of the sustainability of labour productivity based on comparison resources and the efficiency of their use.
Keywords: Labor productivity, sustainable development of the region, basic non-primary industries, indicators and indicators of factor assessment
Introduction
Labour productivity is a determining factor in the formation of a competitive economy in the region. Its sustainable development goal is important for long-term growth. This problem is especially important for the territories of the region with their heterogeneous structure of industries and, accordingly, different levels and dynamics of labour productivity. Studying it with the allocation of the potential of labour productivity resources and efficiency of use at the level of sectors of the territories allows positioning and assessing their role in economic growth and ensuring the sustainability of development due to various factors that shape labour productivity. Within the framework of the study, the basic non-raw materials industries are identified, the relevance of labour productivity growth, in which, in the conditions of a raw materials economy, is preferable, and the comparison of resources and the efficiency of their use by industry, as well as within them by potential, brings the results to the level of managerial decision-making on adjusting strategies economic policy in the territorial and sectoral context.
Problem Statement
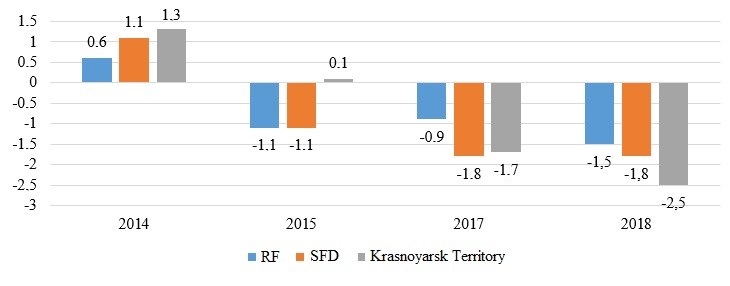
The contribution of basic non-primary industries to the GVA of the Krasnoyarsk Territory is currently 50.8%. This is less than in the Russian Federation (51.3%), but higher than in the Siberian Federal District (47.5%). In general, there is a decrease in the share of non-primary industries in the structure of the economy, both at the national level and in the Krasnoyarsk Territory (ROSSTAT, 2021). The largest gross value added in the region is formed by the processing industries (on average 31%), for 2014-2019. the share increased by 2.7%. The rest of the basic non-resource industries have reduced their share in the GVA:
- agriculture - by 35.1%;
- construction - 31.0%;
- trade - 28.5%.
The rate of changes in the Krasnoyarsk Territory as a whole is higher than in the Siberian Federal District and the Russian Federation (Figure 1).
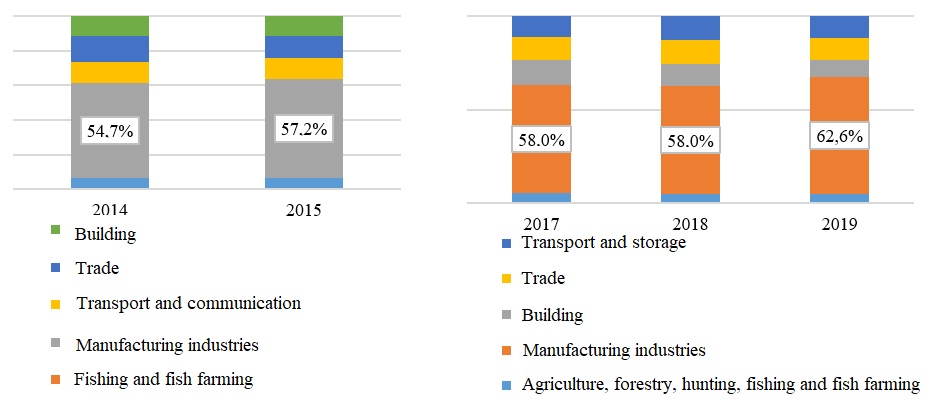
In the structure of the basic non-resource industries of the Krasnoyarsk Territory, manufacturing industries occupy a leading position, and on average their share increased from 54.7% to 62.6% (See Figure 2).
In general, the GVA for the BNSO for the period under review had a positive trend (Table 1), which was reflected in the growth of labour productivity (Table 2). The exception is the manufacturing industry, which is characterized by a slowdown in the growth rate of labour productivity, which emphasizes the relevance of this study.
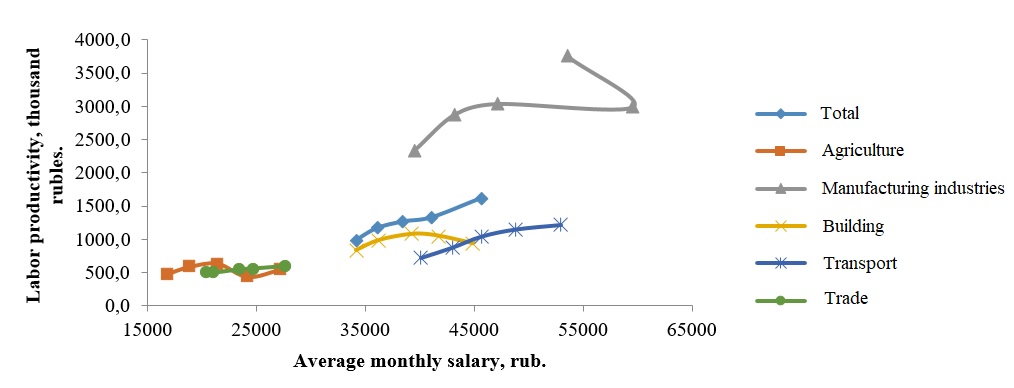
Consideration of the main factors of labour productivity also points to the problems of their change in the BNSO and the incomparability in terms of growth rates within the framework of interdependencies of potentials. So, the compatibility of the rates of labour productivity and wages is noted (Figure 3).
Comparison of the rate of change in the average annual number of employees and GVA in the BNSO indicates a downward trend in the number of people employed in agriculture (1.3-7.0%), manufacturing (1.3-2.0%) in certain periods, which is a positive moment. In the context of the digitalization of the economy. Some of the business processes are automated, there is a flow of vacated jobs into the service sector, although in trade only in 2019 there was an increase in workers by 0.8%, in other years the number was decreasing.
The capital-labour ratio of labour through the rationalization of production and the implementation of the reserves available in this area has a positive effect on the indicator of labour productivity, and as a result, on the acceleration of the socio-economic development of the region (Table 3).
The labour-to-labour ratio in BNSO as a whole has high growth rates (14.29%). An even higher capital-labour ratio is characteristic of the manufacturing sectors of the economy. The ambiguous situation in trade (100.27%) and agriculture (98.12%).
Each of the factors under consideration is associated with labour productivity and characterizes its resource base. However, their comparison with each other and presentation in an indicative form the potential for the effectiveness of the process of mutual influence (Table 4).
Outstripping growth in labour productivity in 2017-2019 noted in agriculture, manufacturing, trade; in transport and construction, the capital-labour ratio is growing faster than labour productivity.
The capital-labour ratio as a reserve for the growth of labour productivity indicates its low efficiency in manufacturing (82.0%) and construction (81%). There is a weak relationship between the capital-labour ratio and labour productivity in agriculture and trade, and there is a balance in transport.
A more expanded presentation of the mutual influence of factors for individual elements of their total potential allows us to highlight points of growth in labour productivity in the BNSO and in each of them, as well as position them for monitoring and identifying the most problematic areas with the adoption of subsequent management decisions. In general, this determined the following research tasks.
Research Questions
The authors proceed from the need to study the possibilities of managing productivity growth processes in the territorial and sectoral context on the basis of its factorial assessment in an indicative form. Accordingly, they additionally include a whole set of tasks for the formation of the corresponding databases of initial statistical data, the calculation of indicators of labour productivity, their combination in the form of a meaningful model of the elemental structure of the problem of the growth of labour productivity, followed by an assessment of the initial factors of its formation, both from the point of view of the state of resources and the efficiency of their use.
Purpose of the Study
The purpose of the study is the need to develop a methodological support for the enterprise process of decisions on the territorial and sectoral growth of labour productivity, which can be used as the basis for a system for monitoring the development of the BNSO and ensuring the sustainability of the regional economy.
Research Methods
The stability of the economic system of its constituent industries, but the authors believe, is understood as its ability to generate labour productivity in order to change the structure of industry and the development of all spheres of the economy, focused on the use of new progressive technologies. This innovative component is aimed at creating a dynamic balance between available resources and the efficiency of their use, as well as the ability to withstand negative impacts and risks.
The stability of the economic system is ensured by the dynamic growth of the aggregate indicator of labour productivity, which determines its position in the sectoral structure of the region.
To position the BNSO in the regional economy, the author's methodology is proposed, consisting of the following sequences:
- Selection of labour productivity factors and the formation of a meaningful indicative model of its integral assessment in the BNSO;
- Calculation of indicators of changes in labour productivity in the context of each of the identified potentials;
- Ranking BNSO by resource provision and efficiency of its use;
- Comparison of integral ratings and positioning of industries in terms of sustainability;
- Clustering BNSO.
Stage 1. To determine the factors of labour productivity and methods of their quantitative assessment, the use of foreign experience, tested by Russian authors (Klowden & Wollte, 2013; Ruyga, 2017).
The assessment and subsequent aggregation of the sectors of the territories is based on the methodology of the American and European assessment systems in the regional context (Bortnik et al., 2012). Its peculiarity lies in the formation of a system of indicators, which are components of the indicators of an integrated indicator. Key indices compose an aggregated estimate based on two groups of indicators: resources; the results of the effectiveness of their use.
To assess the internal development potential of non-resource sectors of the economy of the Krasnoyarsk Territory, it is proposed to use factor analysis (Belokopytov & Ternovchuk, 2019), which includes two groups of indicators (Mantsaeva, 2015):
- states (basic statistics from indicators);
- development/efficiency (calculated indicators).
The goal is the selection of significant factors of labour productivity, which make it possible to assess the initial state of the resources of the BNSO of the region's economy and the potential for their growth to ensure labour productivity.
The factors are distributed in indicative form according to the possibilities of influencing labour productivity by potential:
- innovation and investment potential;
- labour potential;
- production potential;
- financial and economic potential.
In general, the meaningful model of the system for the formation of labour productivity in indicative form has the form (Table 5).
Labor productivity is defined as the ratio of the gross value added in industries in comparable prices to the average annual number of people employed in the economy (Mikheeva, 2015).
Stage 2. The purpose of this stage is to bring the initial factors into a standardized form with subsequent integration into a generalized indicator characterizing the level of state and development / efficiency of non-resource industries.
At the second stage, the data were standardized and the integral indicators of the state and development of non-resource sectors of the region's economy were calculated for the periods 2014-2016, 2017-2019. using the MS Office Excel software product according to the following formulas:
, (1)
where: – the minimum value of the indicator; – the maximum value of the indicator.
We find the generalizing indicator from the standardized values according to the formula:
, (2)
where: – number of positive indicators;– the number of negative indicators.
Stage 3. After calculating the integral indicators of the state and development of non-resource industries, they are analyzed. It is proposed to use a ranking method that allows to determine the position of one or another type of activity relative to others. The goal is to identify non-resource industries that are leaders and outsiders in terms of the level of integral indicators of labor productivity.
Tasks:
- calculation of the rating score of each BNSO for each year and the average value for the period 2014-2016, 2017-2019;
- analysis of the dynamics of changes in the BNSO rating;
- identification of strengths and weaknesses in the rating position by factors taken into account in the calculation.
Stage 4. At this stage, the goal is to determine the position of the BNSO of the economy on the basis of integral indicators of state and development.
Tasks:
- building a graphical model for positioning industries;
- formulation of characteristics of positioning groups.
Stage 5. The purpose of this stage is to assess the position of BNSO in ensuring labor productivity based on cluster analysis.
Within the framework of the study, “Euclidean distance” was used as a metric as the most general type of distance. This metric is the most objective, since there is no information about which feature is more important for classification. The Ward's method was chosen as the classification method; this method is constructed in such a way that allows the minimum variance within the clusters (Muzalyova & Muzalyov, 2014).
Tasks:
- merger of OKVED for 2014-2016. (OK 029-2007 (NACE Rev. 1.1), valid from 01.01.2008 to 31.12.2016); and 2017-2019 (OK 029-2014 (NACE REV. 2), valid from 01.01.2014).
- the distribution of foreign economic activity into clusters using the system for processing and analysis of statistical information "STATISTICA 10.0.1011.0", allowing to automate this process according to predefined clustering parameters.
Findings
All figures and tables should be referred in the text and numbered in the order in which they are mentioned. The research carried out allowed:
1. Form a database on the BNSO (2014-2016 and 2017-2019, respectively). Each of the above groups includes 26 statistical and calculated indicators and factors of labour productivity.
The final result is the calculated value of the integral indicators of the state and development of the BNSO by years (2014-2019). The data obtained made it possible to assess the dynamics of changes in indicators for all types of economic activity and identify the "leaders".
As can be seen from Figure 4, the greatest growth is noted in non-resource types of activity: manufacturing (+ 22.7%) and transport (+ 46.0%), and positive dynamics was also recorded in agriculture (+ 5.6%).
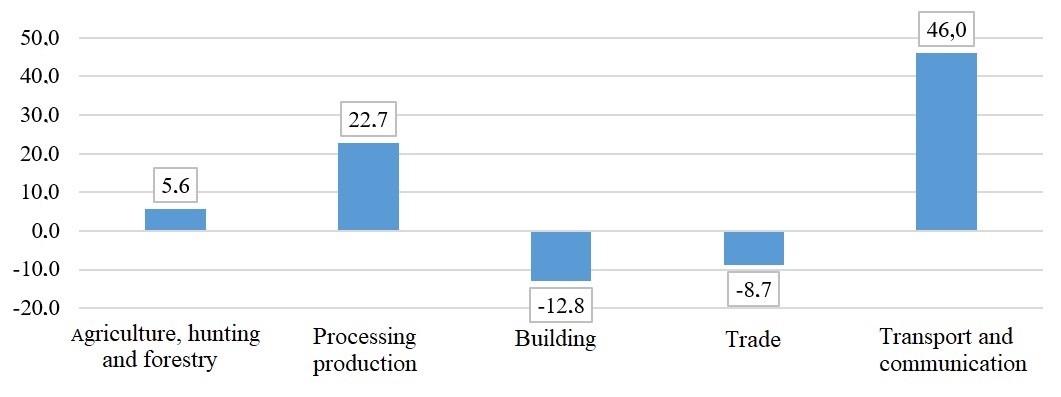
In turn, construction and trade show a decline in the calculation of the integral indicator (-12.8% and -8.7%, respectively).
The development of the basic non-resource sectors did not proceed at such high rates: the manufacturing sector (+ 4.9%), construction (-30.0%), transport (+ 3.7%); agriculture and trade, on the contrary, demonstrate negative development dynamics (-57.3% and -17.9%, respectively).
As a result, the rating of each industry was formed according to the parameters under consideration (Table 6).
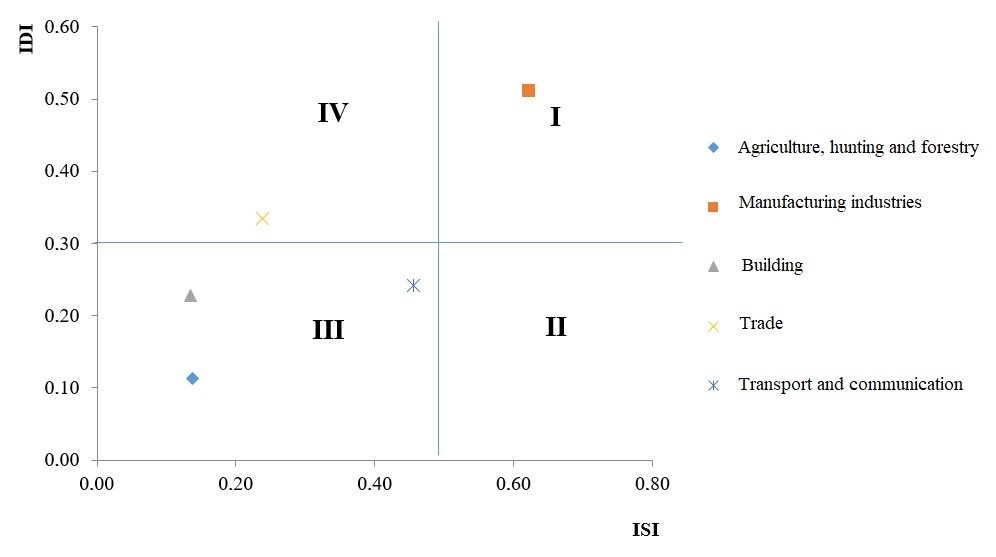
A graphic model of the positioning of the BNSO was formed, based on the characteristics of the positioning groups:
- both integral indicators are high - dynamically developing industries with good production potential;
- a high level of integral indicators of state (ISI) with low integral indicators of development (IDI) - industries that have a good production base, but do not pay sufficient attention to the development of innovative and human potential.
- both integral indicators are low - industries that require special attention both in terms of improving the production base and developing innovative potential in the future.
- a low level of ISI with a high level of IDI - actively developing industries that have unstable positions due to production problems.
The graph is conventionally divided into 4 areas, the border of which runs along the average values of the integral indicators of the state and development efficiency (Figure 5).
The figure shows that manufacturing industries belong to the category of leaders, being located in the first group. Assessing the positions of other non-resource industries, the following conclusion can be drawn:
- trade belongs to the fourth group;
- the state and level of development of agriculture, construction and transport are low.
As a result of the cluster analysis, BNSO are grouped according to their state potential and efficiency, which makes it possible to form a list of possible directions for improving the labour productivity management policy within cluster groups.
Conclusion
As the factor analysis and integral assessment of labour productivity have shown, there are problems with its growth in the BNSO, depending on the state of resources and the efficiency of the return from their use. the combination of integral indicators of labour productivity makes it possible to single out problem LMSOs of individual territories and the region as a whole, with an emphasis on individual indicators of factor analysis, the meaningful model of labour productivity proposed in the study can be used as monitoring subsequent changes depending on the combination of various factors and the administrative ones taken on their basis. decisions of an operational and strategic nature.
Acknowledgments
The project №19-410-240007 «Metrics of factorial assessment of reserves of internal potential and the effects of growth in labour productivity in non-resource sectors of the economy to support the digitization of the integration processes of business entities in the region» was funded by RFBR, Government of Krasnoyarsk Region and Krasnoyarsk Regional Fund of Science.
References
Belokopytov, A. V., & Ternovchuk, A. N. (2019). Factor analysis of agricultural labor productivity in the conditions of regional development. Labor Economics, 1, 285-294.
Bortnik, I. M., Sinchenya, G. I., Mikheeva, N. N., Zduzhov, A. A., Kadochnikov, P. A., & Sorokina, A. V. (2012). The system for assessing and monitoring the innovative development of Russian regions. Innovations, 9(176), 48-61.
EMISS. (2021). Official statistics. https://www.fedstat.ru
Klowden, K., & Wollte, M. (2013). State Technology and science Index 2012. Enduring Lessons for the Intangible Economy. Milken Institute. http://www.milkeninstitute.org/pdf/stsi2013.pdf
Krasnoyarsk state statistics service. (2021). Operational indicators. https://krasstat.gks.ru/
Mantsaeva, A. A. (2015). Analysis of long-term trends in labor productivity in the Republic of Kazakhstan: correlation and regression analysis. Bulletin of IKIAT, 1(30), 18-24.
Mikheeva, N. N. (2015). Comparative analysis of labor productivity in Russian regions. Region: Economics and Sociology, 2, 86-112.
Muzalyova, T. I., & Muzalyov, S. V. (2014). Use of cluster analysis in the evaluation of research activity of regions of Russia. Vestnik of Moscow University of the Ministry of Internal Affairs of Russia, 3, 171-177.
ROSSTAT. (2021). Operational indicator. https://www.gks.ru
Ruyga, I. R. (2017). Methods for assessing the region's innovative sustainability. Creative Economy, 2(10), 1025-1038.
Copyright information

This work is licensed under a Creative Commons Attribution-NonCommercial-NoDerivatives 4.0 International License.
About this article
Publication Date
25 September 2021
Article Doi
eBook ISBN
978-1-80296-115-7
Publisher
European Publisher
Volume
116
Print ISBN (optional)
-
Edition Number
1st Edition
Pages
1-2895
Subjects
Economics, social trends, sustainability, modern society, behavioural sciences, education
Cite this article as:
Belyakova, G., Moskvina, A., Mikhaylova, S., Bagdasaryan, L., Likhachev, M., & Borodkina, V. (2021). Labor Productivity As A Factor Of Sustainable Development Of The Region's Territories. In I. V. Kovalev, A. A. Voroshilova, & A. S. Budagov (Eds.), Economic and Social Trends for Sustainability of Modern Society (ICEST-II 2021), vol 116. European Proceedings of Social and Behavioural Sciences (pp. 2463-2473). European Publisher. https://doi.org/10.15405/epsbs.2021.09.02.274