
Product Market Share Using A Model Of Two Competitors


Abstract
The article discusses the construction of a dynamic simulation model of two products competing for market share in the presence of a "network effect". The model is built around two products that compete to be the standard on the market with Powersim Studio. These products are incompatible, and when building the model, prices and other factors that determine the attractiveness of the product are deliberately excluded. A model management interface has been created, which includes an input interface through which data is entered, as well as an output interface that allows one to compare graphs of the product market share of two products, the product market share of one product and the share of the installed target product, the implementation of two products, as well as the installed target products. Based on the conducted experiment, conclusions were drawn regarding the available data and an analysis of the results was carried out. Also, it is illustrated how the model visualizes the process of two products competing for market share.
Keywords: Simulation model, dynamics, market, share, Powersim, visualization
Introduction
A characteristic feature of modern markets is an increase in the rate of change and an increase in the flow of information in the external environment, which causes accelerated changes in the entire structure of companies (Wang & Chen, 2017). These processes are due to economic growth, the expansion of technological capabilities in business organization, freedom of activity, and increased competition in the market. This trend has been observed for half a century. At the same time, changes in the internal structure of companies are associated with the desire to meet all environmental conditions. The effective development of organizational structures in the modern market depends on positive network effects. Networks are particularly fast growing and developing in the field of trade. A network effect is a phenomenon in which the user of a product affects its value to other users (Flaxer et al., 2005).
Problem Statement
Most products can be distinguished from competitor products due to improved features, functionality, design, quality, reliability and compliance with current and hidden customer needs. Firms can also invest in superior customer service and support infrastructure. To the extent that these investments increase the attractiveness of products in the eyes of customers, a firm can gain market share by increasing revenue and allowing even more investment. Compatibility and network effects increase product attractiveness and thus expand the overall market size (Flammer, 2015).
Research Questions
The article discusses the construction of a dynamic simulation model of two products competing for market share in the presence of a "network effect". The model is built around two products that compete to be the standard on the market with Powersim Studio. These products are incompatible and when building the model, prices and other factors that determine the attractiveness of the product are deliberately excluded. A model management interface has been created, which includes an input interface through which data is entered, as well as an output interface that allows you to compare graphs of the product market share of two products, the product market share of one product and the share of the installed target product, the implementation of two products, as well as the installed target products. Based on the conducted experiment, conclusions were drawn regarding the available data and an analysis of the results was carried out, as well as illustrating how the model visualizes the process of two products competing for market share.
Purpose of the Study
A study of the work is to create a simple and reliable model in which two products are presented competing to be the standard on the market. These products are believed to be incompatible. To make the model as simple as possible, only the most basic positive feedback through the established database is explicitly presented. Prices and other factors determining the attractiveness of a product are deliberately excluded. The goal is to include these variables and other important cycles in the model, such as the process by which additional product developers choose which format to use (Boyko et al, 2019a, 2019b, 2019c).
Research Methods
A graphic diagram of a simulation-dynamic model for calculating the level of competition efficiency between two companies selling a similar product for market share is shown in figure 01 (Boyko et al, 2019a, 2019b, 2019c; Malczynski, 2011).
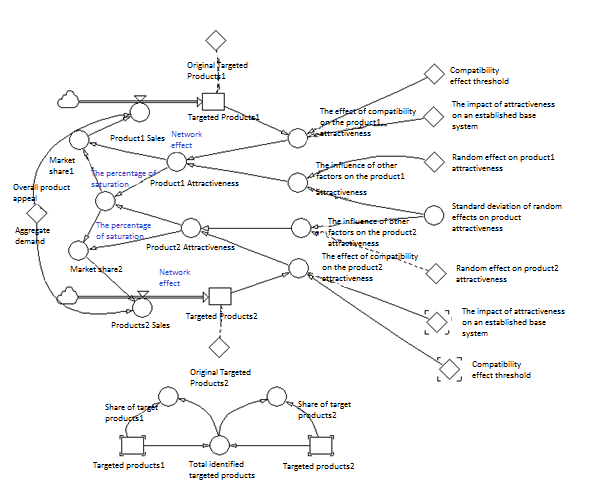
The model includes one level: Installed_Target_Product1.
The diagram also shows several flows:
- Sales of products1.
- Installed_Target_Product2.
- Sales of products2.
In addition to the listed flows and levels, auxiliary variables and constants are present in the diagram. The value of the constants is presented in table 01.
Next, we consider the description of auxiliary variables, which is presented in table 02.
Function EXP (X - any number) - returns the exponent of the number X, i.e. the number e raised to the power of X. EXP is the inverse function for the natural logarithm of LN, i.e. LN (EXP (X)) = X.
Function Step (Height; Beginning) - returns a numerical expression that determines the height of the step. The beginning is an expression that determines the time of appearance of a step signal. The result is 0 if the time is TIME <Start.
Function MAX (A; B) - returns the maximum value among the variables A and B, the result is the maximum element.
Function MIN (A; B) - returns the minimum value among the variables A and B, the result is the minimum element. So, in our formula, the result will be the minimum value of the variables.
The NORMAL function ([Average = 0 [, Standard deviation = 1 [, Seed]]]) - generates a series of normally distributed random numbers with the given values of the Average and Standard deviation.
Average - the average value of the distribution, the default is 0 (arbitrary parameter). The standard deviation is the deviation from the average distribution value, the default is 1 (arbitrary parameter). Seed - a parameter responsible for initializing a random number generator (an arbitrary initial parameter, by default equal to an arbitrary value).
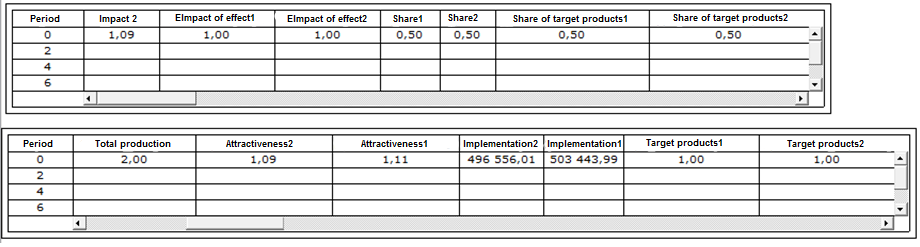
Figure 02 shows the input interface. In this table, only the zero period is initially filled, and the remaining data is filled during the model launch.
In turn, the graphs presented in figure 03 are the output interface and reflect the dynamics of process changes.
Findings
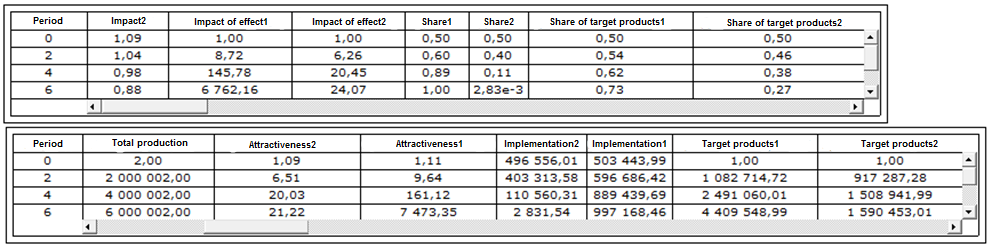
During the experiment, a model was built that formalizes the process of competition between two companies for market share, when selling a similar product. The input values for the calculation are presented in figure 04.
Figure 05 shows graphs of the result of a model run. Diagram 1 presents “the share of the product market1” and “the share of the product market2”. Market share is determined by the relative attractiveness of the products of each firm to the attractiveness of the products of other firms. “The share of the commodity market1” reaches 99%, and the “share of the commodity market2” 10%. Product market share 1 is more attractive than product market share 2.Diagram 2 shows “the share of the commodity market 2” with different values of sensitivity of attractiveness to “established target products 2”. “The share of the commodity market 2” drops sharply to almost 0, “the share of the established target products 2” also drops sharply to 26%, which means that the products of market 2 are not attractive. Diagram 4 shows “the share of the commodity market 1” and “the share of the established target products1”. Market share characterizes the company's position in the market relative to competitors. A quantitative indicator of market share is determined by the percentage of sales volume indicators to the total sales volume of goods of the same category in the market.
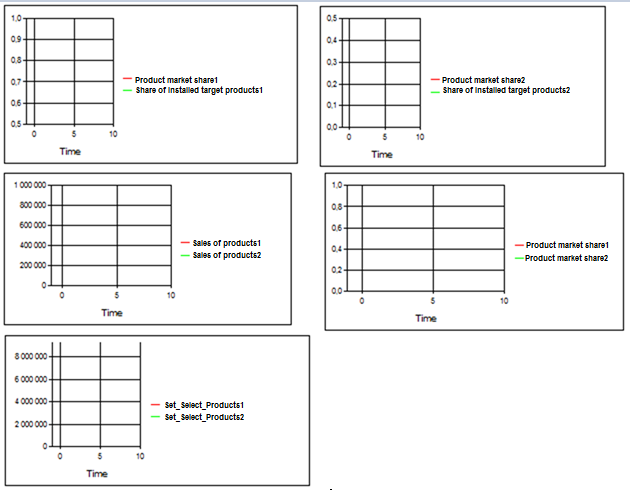
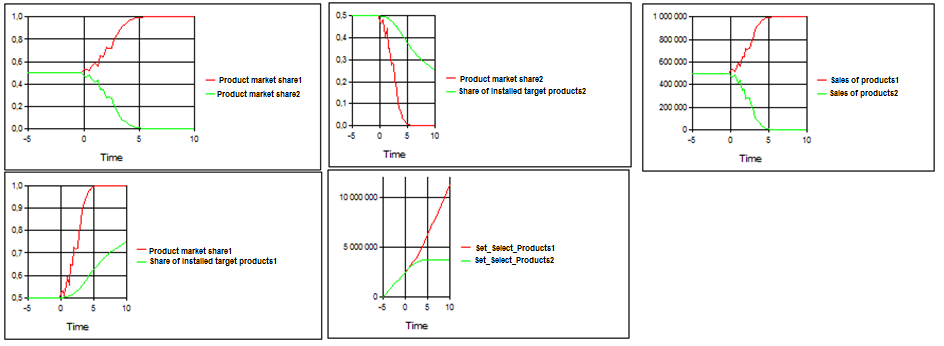
“The share of installed target products 1” is growing sharply and equal to 83%, and “the share of the commodity market 1” reaches almost 99%. Based on this, it can be concluded that “the share of the commodity market1” and “the established target product 1” are more attractive and profitable than the share of “the commodity market 2” and “the established target product 2”.
Diagram 3 shows the sales of two firms’ products. Sales of each company products increases due to sales of products of each company. The analysis of sales of products shows that “sales of products1” is growing sharply, is more profitable than “sales of products2”.
Diagram 5 shows “established target products1” and “established target products2”. The trend of “established target products1” is increasing and reaching more than 11,000,000 million. The growth is steady without any slowdowns. And the trend of “established target products2” reaches almost 4,000,000 million, growth slows down and is less attractive.
Conclusion
The study examined the model of two companies competing for market share in the presence of a “network effect”. The development of completely new products is the main growth engine for many firms. The larger the firm’s income, the greater and more effective the efforts to develop a new product can be. New products create new demand, increasing revenues and increasing investment in new product development even more (Peng & Zhang, 2017; Zhang, 2010).
In such markets, the attractiveness of a product based on this standard depends on its established base, and market share will depend on the relative attractiveness of various competing standards. The graphs show the structure of a simple model to capture these feedbacks. The diagram shows two products competing to be the standard on the market. These products are believed to be incompatible. To make the model as simple as possible, only the most basic positive feedback through the established database is explicitly presented. Prices and other factors determining the attractiveness of a product are deliberately excluded (Li et al., 2010; Zhang & Chen, 2016).
The established base of each company increases due to sales of products of each company. Overall appeal is the sum of the attractiveness levels of all products on the market. At the same time, attractiveness depends on a wide range of variables, including price, availability, quality, service, characteristics and so on.
In this simple model, overall attractiveness is the product of two conditions: the effect of compatibility on attractiveness (network effect) and the influence of all other attractiveness factors. The wording aggregates the effects of price, performance, availability, etc. into a single factor, which in this simple model is supposed to be exogenous. The impact of compatibility on attractiveness reflects the impact of network and compatibility: the larger the installed base, the higher the attractiveness of this product. There are a number of plausible forms for the connection between the established base and attractiveness. One of the most commonly used relationships is defined by an exponential function in this equation, the attractiveness of which increases exponentially as the established base grows relative to the threshold for compatibility effects. With a known zero, the standard deviation of random influences on the attractiveness of the product increases from 0 to 0.01 and the system balances at an unstable equilibrium of 50% of the market share. At zero time, the first random shocks begin to disturb the system, but the positive feedbacks have not yet begun to act. The market share is closely grouped between approximately 49% and 51%, and the distribution of market shares is normal.
References
Boyko, A. A., Kukartsev, V. V., Eremeev, D. V., Tynchenko, V. S., Bukhtoyarov, V. V., & Stupina, A. A. (2019a). Imitation-dynamic model for calculating the efficiency of the financial leverage. J. Phys.: Conf. Ser.1353, 012123.
Boyko, A. A., Kukartsev, V. V., Smolina, E. S., Tynchenko, V. S., Shamlitskiy, Y. I., & Fedorova, N. V. (2019b). Imitation-dynamic model of amortization of reproductive effect with different methods of calculation. J. Phys.: Conf. Ser.1353,012124.
Boyko, A. A., Kukartsev, V. V., Tynchenko, V. S., Kukartsev, V. A., Chzhan, E. A., & Mikhalev, A. S. (2019c). Dynamic simulation of calculating the purchase of equipment on credit. J. Phys.: Conf. Ser.1333, 032009.
Flammer, C. (2015). Does product market competition foster corporate social responsibility? Evidence from trade liberalization.Strategic Management J., 10(34), 1469-1485.
Flaxer, D., Nigam, A., & Vergo, J. (2005). Using component business modeling to facilitate business enterprise architecture and business services at the US Department of Defense. IEEE International Conference on e-Business Engineering (ICEBE'05), 755-760.
Li, J., Li, Q., & Zhang, J. (2010). Product market competition and capital structure: Evidence from listed companies in China. Proceedings of the International Conference on E-Business and E-Government (ICEE 2010), 5592787, 2473-2477.
Malczynski, L. A. (2011). Best practices for system dynamics model design and construction with Powersim studio: vol 15. Sandia National Laboratories.
Peng, Y., & Zhang, Y. (2017). Data analysis of investment decision based on product market competition measures.BoletinTecnico/Technical Bulletin, 55(7), 211-218.
Wang, S., & Chen, Z. (2017). Product market competition, government control and cash flow risk evidence of Chinese corporations. 4th International Conference on Industrial Economics System and Industrial Security Engineering (IEIS 2017), 8078646.
Zhang, C., & Chen, H. (2016). Product market competition, state ownership and internal control quality.China J. of Accounting Studies, 4(4), 406-432.
Zhang, G. (2010). Analysis on characteristics of product market competition in China. Proceedings - 3rd International Conference on Information Management, Innovation Management and Industrial Engineering (ICIII 2010), 1, 113-115.
Copyright information

This work is licensed under a Creative Commons Attribution-NonCommercial-NoDerivatives 4.0 International License.
About this article
Publication Date
17 May 2021
Article Doi
eBook ISBN
978-1-80296-106-5
Publisher
European Publisher
Volume
107
Print ISBN (optional)
-
Edition Number
1st Edition
Pages
1-2896
Subjects
Science, philosophy, academic community, scientific progress, education, methodology of science, academic communication
Cite this article as:
Baryshnikova, O. V., Gek, D. K., Kukartsev, V. V., Pilipenko, A. E., Bets, Y. S., & Apanasenko, S. V. (2021). Product Market Share Using A Model Of Two Competitors. In D. K. Bataev, S. A. Gapurov, A. D. Osmaev, V. K. Akaev, L. M. Idigova, M. R. Ovhadov, A. R. Salgiriev, & M. M. Betilmerzaeva (Eds.), Knowledge, Man and Civilization - ISCKMC 2020, vol 107. European Proceedings of Social and Behavioural Sciences (pp. 1902-1909). European Publisher. https://doi.org/10.15405/epsbs.2021.05.251