
Digital Literacy Of The Population: Regional Features


Abstract
During the implementation of the Project "Russian Digital Economy as a Social Field" in the Kursk region, one of the identified problems concerns the divergence of existing approaches to assessing the level of digital literacy of the population. Considering regional features, the authors have developed the structure of the Digital Literacy Index of the Kursk region population. The Digital Literacy Index was formed based on information, communication, technical and consumer competencies. The digital literacy level was calculated as the sum of points for correct answers to the questions related to the listed competencies. The population survey was carried out within the framework of the sociological research "Population and Digital Economy" as part of the project "Russian Digital Economy as a Social Field". The general population is the residents of Kursk region aged 18 and older (920 thousand people); quota sampling is the method applied; the sampling population is 384 respondents. The results were processed using the SPSS program. The Kursk region population's level of digital literacy is about 30 points using a 100-point grading scale, which is characterized as a low one. The formation of the Digital Literacy Index of the Kursk region population is mainly influenced by habitus, age, education, type of employment, attitude to the spread of digital technologies. The respondents’ self-assessment of their digital literacy significantly exceeds its revealed level.
Keywords: Digital economydigital literacyregional features
Introduction
The concept of ‘digital literacy’ is usually associated with the name of the American professor Gilster (1997), in 1997, the scientist published his monograph, in which he pointed out that “digital literacy is the ability to understand and use information in multiple formats from a wide range of sources when it is presented via computers” (p. 12).
Gilster also proposed the main criteria for determining the level of digital literacy: skills in searching necessary information and tools for working with the information obtained, skills in communicating with other users. This work set the direction for the development of the scientific area related to determining digital literacy.
Problem Statement
Currently, several institutions and scientists are paying attention to the methodology and research of the population's digital literacy.
So, back in 2009, the UNESCO Institute for Statistics proposed a technique for measuring information and communication technologies (ICT) in education (see http://uis.unesco.org/sites/default/files/documents/guide-to-measuring-information-and-communi-cation-technologies-ict-in-education-en_0.pdf.).
This technique takes into account the following indicators: policies and incentives aimed at creating an enabling environment for integration of ICT in education; school access to ICTs; share of teaching staff having ICT competencies; the annual dynamics of increasing ICT skills; evaluation of ICT tools in schools; changes taking place in the educational system under the influence of ICT; involvement of the state and private capital in the development of the digital educational environment.
In 2009, the International Telecommunication Union (ITU) (there are currently 193 Member States of the ITU, including Russia) developed an ITU Manual for Measuring ICT Access and Use by Households and Individuals (see https://www.itu.int/ITU-D/ict/publications/hhmanual/2009/material/HHManual2009.pdf). It examined data on households and individuals' characteristics and the accessibility and use of ICT by these categories. Further, in 2014, the ITU prepared a list of key indicators and guidelines for measuring ICT access and use by households and individuals (see https://www.itu.int/dms_pub/itu-d/opb/ind/D-IND-ITCMEAS-2014-PDF-R.pdf).
Organization for Economic Co-operation and Development (OECD) considers digital literacy as the ability to “evaluate information from several sources, assessing the credibility and utility of what is written using self-established criteria as well as the ability to solve tasks that require the reader to locate information related to an unfamiliar context, in the presence of ambiguity and without explicit directions” (OECD, 2015). In 2016, for the OECD countries, an expanded methodology was adopted to conduct cross-country comparisons in digital literacy (OECD, 2016).
In 2006, the European Parliament and the European Council published guideline on core competencies of digital literacy. In 2014, the leading indicators that characterize digital literacy were identified: connectivity, human capital, use of internet services, integration of digital technology, digital public services.
We believe that 'human capital' is one of the most important indicators since this indicator characterizes the population's digital literacy. At the end of 2019, this indicator for the EU population has the following characteristics: the percentage of people with at least basic digital skills reached 58%, and a high level of digital literacy was in 33% of the population. However, a significant share of the EU population still lacks basic digital skills, although most jobs require them. This problem is most common in Romania and the Czech Republic; Finland and Sweden are the most advanced in this rating (see https://ec.europa.eu/digital-single-market/en/human-capital).
In April 2017, at the G20 summit, an approach based on the assessment of indicators was proposed in order to unify and allow cross-country comparison of the digital literacy level (Chetty et al., 2018).
In Russia, there are also several types of expert assessments of the very concept of ‘digital literacy’ and its assessment level.
So, the Ministry of Digital Development, Communications and Mass Media of the Russian Federation, when assessing the level of media literacy of the population through sociological research, including when citizens determine the level of media literacy, recommends the following media literacy criteria:
Ability to use search engines and get the necessary information;
Ability to assess the sources of information, verify information and critically evaluate it;
Ability to protect personal data on the Internet and the ability to prevent the leakage of information related to personal life, which may be of interest to malicious users;
Knowledge about the systems of ‘Parental Control’ systems, the ability to use them as well as the ability to conduct a personal safety course for children on their actions in social networks and on the Internet;
Ability to compare information from various sources, strive to verify any information received.
At the same time, it is noted that in 2018, the level of digital literacy of the population was 58% and it is planned to reach the level of 75% by 2024 (https://digital.gov.ru/ru/activity/directions/540/).
According to the annual all-Russian survey “Digital Literacy Index of the Citizens of the Russian Federation” conducted by the Regional Public Center for Internet Technology (Russian abbreviation is ROCIT), the Digital Literacy Index of Russians was 4.52 points (on a ten-point scale) in 2018 (https://rocit.ru/news/index-digital-literacy-2018.). The Index structure is a three-tier model formed on the basis of 20 key parameters and consistof digital consumption sub-index, competencies sub-index and security sub-index.
The National Agency for Financial Research (NAFI) developed a five-factor methodology for assessing the level of digital literacy using the Digital Literacy Index by the following components: information, computer, communication literacy, media literacy and attitude towards technological innovation.
The Digital Literacy Index is calculated as the mean value of all the components indicated.
At the end of 2018, the mean Digital Literacy Index calculated by the National Agency for Financial Research was 52% and 26% of Russians have a high level of digital literacy. The results of the study also revealed the fact that there is a dependence of the level of digital literacy on the region of residence, age, and professional activity.
State Atomic Energy Corporation Rosatom developed and proposed a national index for digital economy development (Shaposhnik, 2018).
Within the framework of this index research, the corporation has carried out a pilot study "Digital Citizens". The results show that today Russia is inferior to most European countries in terms of the degree of digital technology penetration into households and citizens' everyday lives. Russia ranks 28th (out of 33 countries) and lags behind the leader (Great Britain) by more than 1.5 times (0.367 versus 0.648 according to the index). The value of this indicator for Russia is less than the mean value for the countries included in the pilot version of the countries' Index (0.475).
The Institute of the Information Society (IIS), using the methodology Digital Economy Country Assessment (DECA) developed by the World Bank for various countries of the world, conducted a study of the Russian population focused on the use of digital technologies. In general, the level of access of Russian households to digital technologies and their use by the population can be evaluated as an average one (Digital Economy Country Assessment for Russia, 2018).
Among foreign scientists, first of all, it is necessary to note the collective scientific work of a team of scientists from various countries, edited by Professor Knobel at Montclair State University. The second part of their monograph contains the results of the various practices related to digitalization (Knobel, 2008), including calculations on digital and Internet literacy. Although more than 10 years have passed since the publication, which is a significant period for digital development, the book and the study's main findings remain relevant.
Within the framework of our topic, works with the results of studies of digital literacy of the population in various countries are also of significant scientific interest.
One such study is a review characterizing students' digital literacy from the University of Tehran published by associate professor (Abdollahyan & Ahmadi, 2011). The author argues that gender, age, course, PC knowledge, number of Internet access points are the indicators that can be used to predict digital literacy skills among university students.
Torralba (2015), a researcher at the University of Hawaii at Manoa, presented the results of a study on the digital literacy of Hispanic immigrants in California, in which he concluded that the respondents have to improve their digital literacy to meet their personal, educational and work-related needs, which is facilitated by the US IT environment.
A study on the digital literacy of Mongolian students carried out by Marav (2016), the scientist of the National University of Mongolia, is also of interest; according to it, the level of digital literacy of Mongolian students is inextricably linked with the level of English language proficiency.
The researchers at Tamagawa University Travis Cote and Brett Milliner published the study results on the students' digital literacy self-assessment conducted at Japanese universities. The scientists concluded that the respondents' self-assessment of their digital literacy is significantly lower than the real one (Cote & Milliner, 2016).
The scientists of the National University of Public Service (Hungary) Laszlo Berenyi and Peter Sasvari (2018) studied the state of digital literacy among Hungarian university students. The authors conclude that the IT culture of university students is at a high level in Hungary.
A team of Indonesian researchers led by Kurnia, a lecturer and researcher at the Department of Communication Science at the Faculty of Social and Political Sciences of Universitas Gadjah Mada, presented the results of a study on the digital literacy of Indonesian women (Kurnia et al., 2020). The article notes that generally speaking, the respondents have a moderate score on 10 different digital literacy skills.
An international team of scientists from Norway, France, Germany, India and Australia published the results of their analysis of digital literacy of people in sub-Saharan Africa and India (Radovanovic et al., 2020). The report revealed that nowadays, 3.6 billion people are still cut off from digital technology. Several practical measures are also proposed to integrate this part of the population into the digital era.
Ragnedda, Senior Lecturer in Mass Communication at the University of Northumbria, Newcastle (UK), determined that people who belong to the ethnic majority and live in large cities tend to have higher levels of digital capital (Gladkova et al., 2020).
A study by Swedish scientists led by Viberg, Associate Professor of The Royal Institute of Technology, is also of interest. As a result of the analysis of the results, a seven-factor structure of the digital competence of teachers was obtained with an emphasis on their readiness for digitalization: abilities to use digital learning technology; social influence and support; intention of use; usefulness and efficiency; limitation awareness; pedagogical potential; assistance awareness. (Viberg et al., 2020).
There are also a number of very worthy works on techniques and digital literacy research results by Russian scientists.
Professor Sharikov (2016) proposed a theoretical model that would allow generalizing numerous practices and theoretical approaches to digital literacy. This model covers the following areas: content and communication capabilities, technical and technological capabilities, sociopsychological threats, technical and technological threats.
Professor Soldatova identified four types of digital competence: information and media competence, communicative competence, technical competence, and consumer competence (Soldatova & Rasskazova, 2014).
Associate Professor Davydov presented the results of a number of methodological experiments related to big data analysis and conducting surveys of social network users concerning digital literacy (Davydov & Logunova, 2015).
Zadorin, the head of ZIRKON research team, presented a comparative analysis of the level of media literacy of the population in ten regions of Russia (Zadorin et al., 2017). The author notes that, first of all, the level of economic development of the region, the average level of education of the population of the region, the variety of sources of information in the region in terms of their political positioning, the level of political loyalty of the population of the region, the level of development of the media sphere in the region affect the level of digital literacy. The media literacy index on average for 10 regions is 15 out of 35, or about 43 points on a 100-point scale. Moreover, the index on a 100-point scale varies from 35 points (Astrakhan region) to 50 points (Moscow), depending on the region. No research was carried out in Kursk region.
Professors Budanov and Aseeva (2019) identified a number of threats caused by the use of digital technologies. The scientists conclude that our private data, collected semi-legally through bank marketing screening, are becoming a subject of sale, which cannot but cause a feeling of protest, and also leads to an awareness of the need for a legal and ethical assessment of the above problems and the development of public and state regulations.
Professor Volokhova (2020) identified the role of the sociocultural field in the formation of digital literacy. The author highlights the need for a cultural examination of activities related to the implementation of the digital economy.
Thus, the scientific community is showing significant interest in topics related to the digital literacy of the population. However, as can be seen from the analysis performed, there is a problem of divergence of approaches in assessing the level of digital literacy of the population, the distinctness of the formation of this concept and its calculations in various countries, including Russia. And this is not only the opinion of the authors of the article. So, for example, Associate Professor Kournikova clearly demonstrated that the measurements of the digital literacy of the population carried out at the moment have differences that prevent obtaining comparable data on assessing the level of digital literacy of the population both in Russia and OECD countries and the EU (Kournikova & Chirkunova, 2019).
We conclude that it is impossible to form a single digital literacy research structure that would be optimal for each household or individual in all countries or even individual regions, since it is important to take into account regional features when determining it.
Research Questions
Digital literacy of the population of Kursk region, taking into account regional features. Kursk region is a region of the Russian Federation; it is characterized by the following features: agricultural production, sugar production, iron ore mining, electricity generation, and light industry products manufacturing.
Purpose of the Study
The study is aimed at developing the structure and determining the Digital Literacy Index of the Kursk region population, taking into account regional features; identifying the factors affecting the formation of the level of digital literacy of the region’s population and the sub-level of the population’s self-assessment in relation to this phenomenon.
Research Methods
The empirical basis of the article is a sociological study “Attitude of the Population to Digital Economy”, carried out with the participation of the authors in February-May 2020 as part of “Russian Digital Economy as a Social Field” project (http://sociokursk.ru/?page_id=3810). The general population is the residents of Kursk region aged 18 and older (920 thousand people); quota sampling is the method applied; sampling population is 384 respondents. This sample has been repeatedly tested in other studies in the region (Podgorny, 2017).
The research was carried out applying a technique of respondents’ questionnaire survey. The processing of the results, their analysis and comparison was carried out using the SPSS program (statistical and contingency tables).
Findings
Guided by the methods and techniques described when setting problem, we consider digital literacy of the population as an indicator that is formed on the basis of the combination of the following competencies: information and media competence, communicative competence, technical competence, and consumer competence. Detailed characteristics of each of these competencies are presented in Table
The Digital Literacy Index developed by our team is formed on the basis of 39 responses of respondents to the questionnaire. Most of the answers refer to several competencies. For example, responses to the question “Which of the listed digital devices do you use every day?” refer to communication and consumer competencies; responses to the question suggesting to choose the actions taken by the respondents to protect their personal data in the Internet environment refer to three competencies, that is, information, communication, and technical. The technique applied made it possible to use an average of 25 answers when determining the level of each competence. More details are presented down below:
– consumer competence – 33%;
– information competence – 24%;
–technical competence – 20%;
–communicative competence – 23%.
The Digital Literacy Index has five levels, ranging from very low to very high. Each level corresponds to an indicator formed according to the results of the total evaluation for the competencies under study in percent. Table
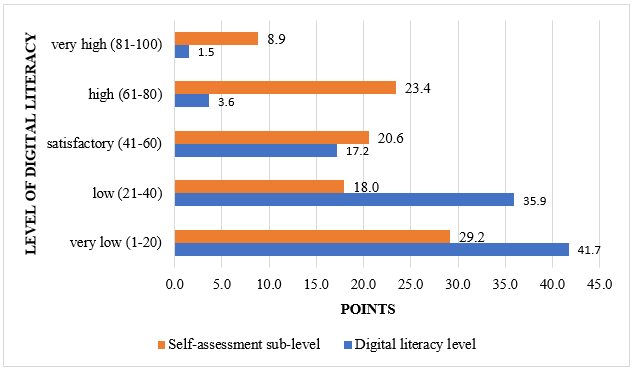
The research results processing showed that the average Digital Literacy Index of the Kursk region population is about 30 points on a 100-point scale, which is characterized as a low one. More than half of the respondents have a satisfactory or low level of digital literacy. Detailed results are given down below:
– very high (81-100) – 1.5%;
– high (61-80) – 3.6%;
– satisfactory (41-60) – 17.2%;
– low (21-40) – 35.9%;
– very low (1-20) – 41.7%.
Further, we determined which factors influence the formation of the index levels. To do this, using the SPSS program, we analyzed contingency between the levels of the Digital Literacy Index and the following factors: habitus, age, gender, education, place of residence, type of employment, income, and the respondent’s attitude to the widespread introduction of digital technologies. Based on the comparison of the actual and theoretical values of the chi-square, the determination of the probability of a random relationship based on the asymptotic significance and the analysis of the value of the ‘lambda’ coefficient, we determined the possible relationship of the variables under study. Detailed results are presented in Table
Table
– very low: the respondent considers him/herself to be completely incompetent with regard to understanding and using various means of the digital economy when solving household, work, and other tasks;
– low:the respondent considers him/herself to be satisfactorily competent in understanding and using various means of the digital economy when solving household, work, and other tasks;
– satisfactory: the respondent considers him/herself to be quite competent in understanding and using various means of the digital economy when solving household, work, and other tasks;
– high: the respondent considers him/herself to be very competent in understanding and using various means of the digital economy when solving household, work, and other tasks;
– very high: the respondent considers him/herself to be highly competent in understanding and using various means of the digital economy when solving household, work, and other tasks.
The detailed results of the self-assessment sub-level analysis are given down below:
– very high (81-100) – 8.9%;
– high (61-80) – 23.4%;
– satisfactory (41-60) – 20.6%;
– low (21-40) – 18.0%;
– very low (1-20) – 29.2%.
Among 39.1% of the respondents there is correspondence between the self-assessment sub-level and the Digital Literacy Index level; 1.8% of the respondents identified their self-assessment sub-level lower than their digital literacy level; and 59.1% of the respondents indicated their self-assessment sub-level higher than their level of digital literacy.
Figure
Conclusion
Thus, the results of the study show that the mean Digital Literacy Index in Kursk region is about 30 points on a 100-point scale, which is characterized as a low one. So far, this level is more than two times lower than the level of digital literacy in the EU population at the end of 2019.
The level of digital literacy of the population of Kursk region is also significantly lower than the average level of media literacy of the population of Russia presented by the Ministry of Digital Development, Communications and Mass Media of the Russian Federation. The level of digital literacy of the Kursk region population differs from the national data determined by ROCIT and NAFI, but at the same time it corresponds to the indicators obtained by Rosatom.
These data confirm the need for a regional approach in determining such indicators, since the average indicator for the country does not always correspond to the indicators of a particular region.
So, the formation of Digital Literacy Index of the Kursk region population is mainly influenced by habitus, age, education, type of employment, attitude to the spread of digital technologies. At the same time, in contrast to the indicators of other countries, the respondents’ self-assessment of their digital literacy significantly exceeds its revealed level
Acknowledgments
The reported study was funded by RFBR, project number 20-011-00228 “Russian digital economy as a social field”.
References
- Abdollahyan, H., & Ahmadi, M. (2011). A Survey Analysis of Digital Literacy among undergraduate Students of the University of Tehran. Amity Journal of Media and Communication, 1(1), 1-10.
- Berenyi, L., & Sasvari, P. L. (2018). State of Digital Literacy: Preparedness of Higher Education Students for E-Administration in Hungary. Central and Eastern European EDem and EGov Days 2018, 347-356.
- Budanov, V., & Aseeva, I. (2019). Manipulative marketing technologies in new digital reality. Economic Annals-XXI, 180(11-12), 58-68.
- Chetty, K., Qigui, L., Gcora, N., Josie, Ja., Wenwei, L., & Fang, Ch. (2018). Bridging the digital divide: measuring digital literacy. Economics: The Open-Access, Open-Assessment E-Journal, 12, 1-20.
- Cote, T., & Milliner, B. (2016). Japanese university students’ self-assessment and digital literacy test results. CALL communities and culture-short papers from EUROCALL, 125-131.
- Davydov, S. G., & Logunova, O. S. (2015). Proyekt «indeks tsifrovoy gramotnosti»: metodicheskiye eksperimenty [Digital Literacy Index Project: Methodological Experiments]. Sociology: methodology, methods, mathematical modeling, 41, 120-141.
- Digital Economy Country Assessment for Russia (2018). Moscow: Institute of the Information Society. https://www.iis.ru/docs/DECARussia2018eng.pdf
- Gilster, P. (1997). Digital literacy. New York: Wiley.
- Gladkova, A., Vartanova, E., & Ragnedda, M. (2020). Digital divide and digital capital in multiethnic Russian society. Journal of Multicultural Discourses, 15(2), 126-147.
- Knobel, M. (2008). Digital Literacies: Concepts, Policies and Practices. Bern: Peter Lang Publishing.
- Kournikova, M. V., & Chirkunova, E. K. (2019). Tsifrovaya gramotnost' naseleniya: teoreticheskiye osnovy i metodiki otsenki [Digital literacy of the population: theoretical foundations and assessment methods]. Enterprise Development Problems: Theory and Practice, 1, 70-76.
- Kurnia, N., Engelbertus, W., Wisnu, A., Syafrizal, S., Aprilia, M., Utomo, W., & Sari, Yu. (2020). WhatsApp Group and Digital Literacy Among Indonesian Women. Yogyakarta: Prodi Magister Ilmu Komunikasi UGM.
- Marav, D. (2016). Mongolian students' digital literacy practices: the interface between english and the internet. Trabalhos em Linguistica Aplicada, 55(2), 293-318.
- OECD (2015). Students, Computers and Learning: Making the Connection, PISA. Paris: OECD Publishing.
- OECD (2016). New Skills for the Digital Economy: Measuring the demand and supply of ICT skills at work. Paris: OECD Publishing.
- Podgorny, B. (2017). The Russian stock market as a social space: a theoretical basis. Economic Annals-XXI, 3-4, 20-24.
- Radovanovic, D., Holst, Ch., Belur, S., Srivastava, R., Houngbonon, G., Le Quentrec, E., Miliza, J., Winkler, A., & Noll, J. (2020). Digital Literacy Key Performance Indicators for Sustainable Development. Social Inclusion, 8(2), 151-167.
- Sharikov, A. V. (2016). O chetyrekhkomponentnoy modeli tsifrovoy gramotnosti [About the four-component model of digital literacy]. Journal of Social Policy Research, 14(1), 87-98.
- Shaposhnik, S. B. (Ed.). (2018). Natsional'nyy indeks razvitiya tsifrovoy ekonomiki: Pilotnaya realizatsiya [National Index of Digital Economy Development: Pilot Implementation]. Moscow: State Corporation "Rosatom". https://in.minenergo.gov.ru/upload/iblock/df0/ df063a504b10a3af5a1ce7cbb07e35fd.pdf
- Soldatova, G. U., & Rasskazova, E. I. (2014). Psihologicheskie modeli cifrovoj kompetentnosti rossijskih podrostkov i roditelej [Psychological models of digital competence of Russian adolescents and parents]. National Psychological Journal, 2(14), 27-35.
- Torralba, J. A. (2015). A Survey of Emergent Digital Literacy Inside the Homes of Latino Immigrants in California. Int. Migration & Integration, 16, 491-515.
- Viberg, O., Mavroudi, A., Khalil, M., & Bälter, O. (2020). Validating an Instrument to Measure Teachers’ Preparedness to Use Digital Technology in their Teaching. Nordic Journal of Digital Literacy, 1, 38-54.
- Volokhova, N. (2020). Sotsiokul'turnaya osnova tsifrovoy ekonomiki [Socio-Cultural Basis of the Digital Economy]. Proceedings of the Southwest State University. Series: Economics, Sociology and Management, 10, 217-226.
- Zadorin, I. V., Maltseva, D. V., & Shubina, L. V. (2017). Uroven' mediagramotnosti naseleniya v regionakh Rossii: sravnitel'nyy analiz [The level of media literacy of the population in Russian regions: a comparative analysis]. Communications. Media. Design, 4, 123-141.
Copyright information

This work is licensed under a Creative Commons Attribution-NonCommercial-NoDerivatives 4.0 International License.
About this article
Publication Date
16 April 2021
Article Doi
eBook ISBN
978-1-80296-104-1
Publisher
European Publisher
Volume
105
Print ISBN (optional)
-
Edition Number
1st Edition
Pages
1-1250
Subjects
Sustainable Development, Socio-Economic Systems, Competitiveness, Economy of Region, Human Development
Cite this article as:
Podgorny, B., & Volokhova, N. (2021). Digital Literacy Of The Population: Regional Features. In E. Popov, V. Barkhatov, V. D. Pham, & D. Pletnev (Eds.), Competitiveness and the Development of Socio-Economic Systems, vol 105. European Proceedings of Social and Behavioural Sciences (pp. 696-707). European Publisher. https://doi.org/10.15405/epsbs.2021.04.74