
Levels of Urbanization in Bangalore Urban District of Karnataka, India


Abstract
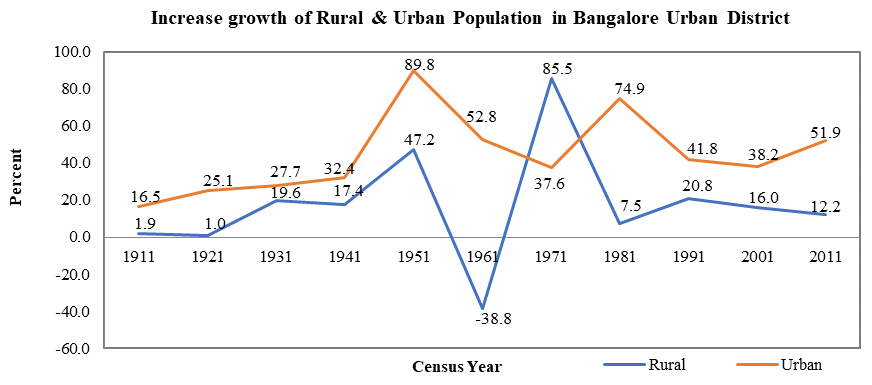
Urbanization is a process and good indicator of development of a region. Bangalore Urban district has been experiencing an abnormal rate of urban growth in terms of population explosion increase in urban centres. This paper studies about the shuffling trends and levels of urbanization in Bangalore Urban Districts of Karnataka. The study is based upon analysis of census data from 1901 to 2011. The entire study is based on Secondary data. Taluk is selected as basic unit of study investigation. As stated by 1901 Census data, the entire population of Bangalore Urban District was 3,84,601 which increased to 96,21,551 in 2011. The highest level of urbanization was seen in the year 1961 which was 17.7 %. While negative rate of urbanization was seen in the year 1971 i.e. -4.9%. The over most growth rate was seen in the year of 1951 that is 89.8% followed by 1981 i.e. 74.9 %. The rapid urbanization of Bangalore Urban District may raise many issues that might be positive and negative impact on the environment and even to human health and societal development. Thus, monitoring the trends and levels of urbanization will be a foremost task for the planners, administration, governmental and NGO’s for executing policies for the usage of resources and accommodate advancement simultaneously.
Keywords: Levelsurbanizationcensus of indiastatistical analysis
Introduction
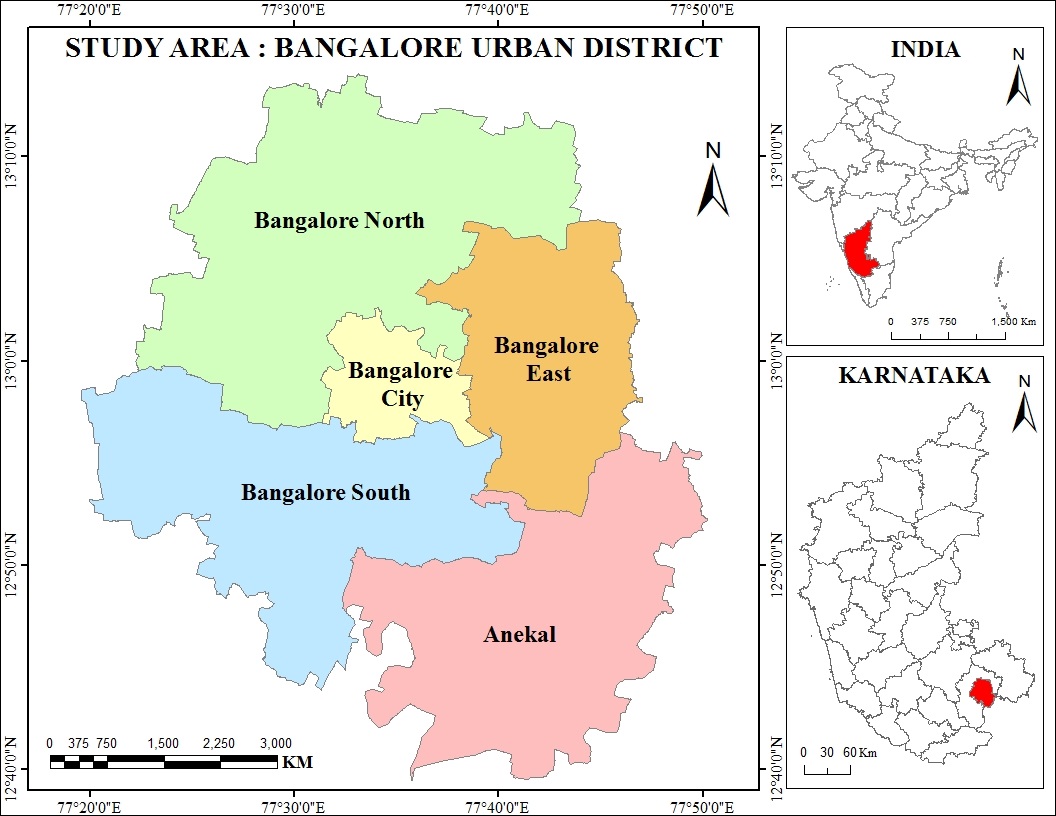
Urbanization is a dynamic process involving changes in the vast expanse of land cover with the progressive concentration of human population (Tv et al., 2012). Geographers use the term urbanization more commonly to a process of transformation (Banerjee & De, 2014). Urbanization is measured by two ways: First, level and growth of urban share of total population and its distribution by size classes of cities and towns (Tripathi, 2016a). More than half the world’s population lives in urban areas. The developed countries are more urbanized than developing countries (Tripathi & Mahey, 2018). Urbanization is associated with greater access to employment opportunities, lower fertility levels and increased independence (Mandal, 2017). Urbanization can be defined as “as a process which reveals itself through temporal, spatial and sectoral changes in the demographic, social, economic, technological and environmental aspects of life in a given society” (Kumar & Rai, 2014, p. 55). The fast pace of urbanization can be attributed to many factors such as rural to urban migration, re-classification of cities, and natural growth rate of urban population (Tripathi, 2016b). Development took place between urban and rural areas, industry and agriculture, urban growth and economic growth (Chaolin et al., 2017). Several factors like agricultural revolution, Industrial revolution, Transport revolution, revolution in education and technology, employment opportunity and push & pull factors have been mainly responsible for urbanization (Khanna, 2019). Urbanization in India has occurred more slowly compare to other developing nations (Chakraborty et al., 2015). Similar transformations were observed in Bangalore Urban District of Karnataka state, India during the last two three decades when compared to other parts of the region. Bangalore city became the administrative, commercial, and cultural hub of Karnataka state attracting millions of people and their family members to migrate from rural parts (see Figure
Problem Statement
“Industrialization, modernization, globalization, marketization and administrative institutional power are considered to be the main driving forces for rapid urbanization” (Gu, 2019, p. 1359). Due to which, the 5 taluks of Bangalore Urban District experienced population outburst in last few decades. The district is now facing many issues like deteriorate in air and water quality, housing, traffic congestion, poor infrastructure, sanitation, sewage and solid waste management issues, poor power supply and many other urban issues. The city also fails to provide basic convenience or requirements to the mounting figure of urban population. Hence, it is very essential to make learning on the levels of urbanization in the Bangalore Urban District to know about the drastic change in the district and also to provide efficient management for the city.
Research Questions
In light of the above formed objective the following research question has been proposed to explore certain issues related to trends and level of urbanization in the Bangalore Urban District: What are the levels of urbanization in the district? and how the level of urbanization varied from last 100 years.
Purpose of the Study
In the modern era of urban expansion, population explosion and abnormal growth of cities and towns have become common phenomena. The growth of population and urban function of cities are expanding beyond the built-in limit towards countryside. In addition to this, many geographical changes in the urban periphery from rural to urban are associated which results to fluctuations in land use within the urban fringe. We can also find out the overall population growth and trends of urbanization in the Bangalore Urban District. Thus, it is very essential to propose a study to find out the pace of urbanization in the district to give suggestions to emphasize on development of newly emphasized urban areas of the district.
Research Methods
The present research is grounded upon secondary data collected and compiled from Census of India and Bangalore Urban District at a glance during 1901-2011. Cartographic technique has been used to analysis and interpretation the data. Several indicators have been selected for calculating the urbanization.
“In order to understand the percentage of urbanization in Bangalore Urban District, it is computed with the help of the following formula.”
"In order to calculate the ratio of rural urban population in the study area, the following formula is also deduced.”
The tempo of Urbanization is computed on the basis of annual population growth rate. The formula computed here to calculate the tempo of urbanization is as follow:
Where,
ln = natural log,
PU = t+n and PU t = percent urban in t+n th census and t th census respectively,
PR = t+n and PR t = percent urban in t+n th and t th census respectively,
n = census interval = 10 (Kumari, 2014).
Moreover, In the present paper, the levels of urbanization have been studied based on Z-Score. The score measures the departure of individual observation, expressed in a comparable form. After calculating the Z score, the level of urbanization of each taluk have been calculated by the following way-
S.D. is the standard derivation.
Findings
Trends of urbanization in Bangalore Urban district:
The trends of Urbanization in Bangalore Urban District are seen to change in every decade from 1901 to 2011 (Table
In 1951, the population increased to 12,53,542 with highest growth percentage of 89.8% compared to all other decades. In 1961, the rate of urbanization was 17.7 which were highest among other decades.
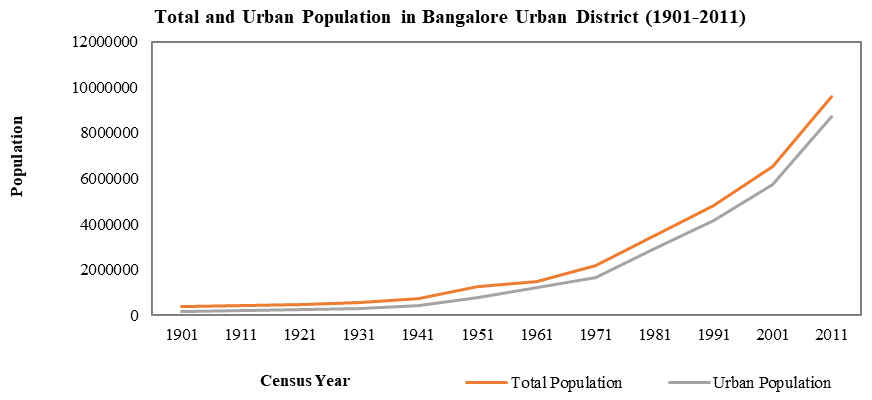
In 1951, the population increased to 12, 53,542 with highest growth percentage of 89.8% compared to all other decades. In 1961, the rate of urbanization was 17.7 which were highest among other decades. The reason for expansion during this decade is not known before the year 1971. However, the percentage of urban growth decline to 37.6 percent which showed a negative decline in urban growth rate. The growth rate of urbanization again increased to 74.9 % in 1981. In 2011, the total population in the district was 96,21,551 out of which 87,49,944 were urban population where the growth rate was 51.9%. About 90% of the total population of Bangalore Urban district started staying in urbanized area. Industrialization, commercialization and IT sector attracted not only the rural population within the state but also across the country. Majority of the migrated family members settled in Bangalore due to good weather, educational institutions and affordable medical facilities.
Level of Urbanization:
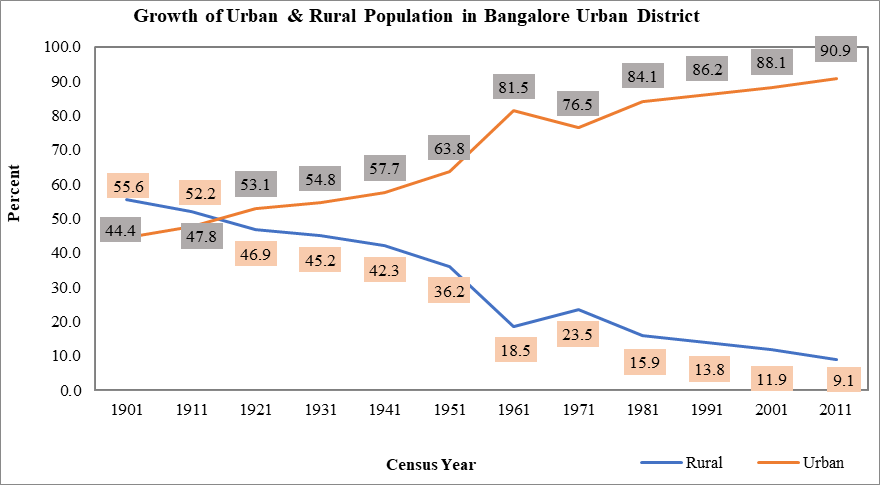
“The level of urbanization is defined as relative number of people who reside in urban areas. Percent urban [(U/P) *100] and percent rural [(R/P) *100 and urban-rural ratio [(U/R) *100] are used to measure degree or level of urbanization” (Kumari, 2014, p. 61). These remain utmost frequently required to find out the levels of urbanization.
From Table
Taluk wise Trends of urbanization in Bangalore Urban district:
The level of Urbanization in Karnataka is higher in associated to the country level. The table
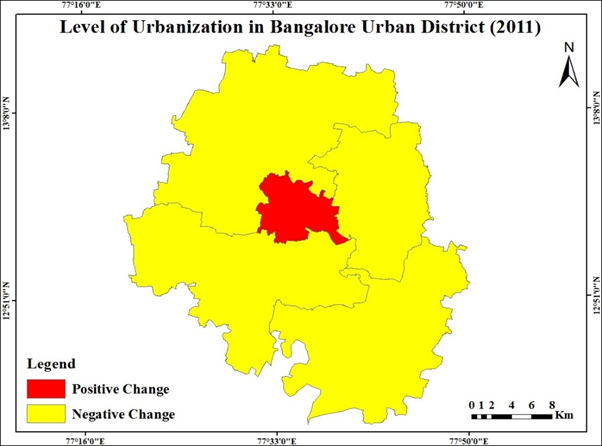
Taluk wise level of urbanization in Bangalore Urban district - 1991 to 2011:
The degree or level of urbanization is defined as relative number of people who live in urban areas. Percent urban [(U/P) *100] and percent rural [(R/P) *100 and urban-rural ratio [(U/R) *100] are used to measure degree of urbanization. These are most commonly used for measuring degree of urbanization. (Barakade & Todkari, 2014, p. 39)
In the present study, the levels of urbanization have been arranged into two categories (Positive and Negative) on basis of Z-Score as shown in Table
Decadal Growth Rate:
The table
From, 2001 -2011, the growth rate was 3.2%, of which 3.4% for urban population. The yearly growth rate of the district for urban population started increasing every decade out of which the highest growth rate was seen in the year 1941-1951 i.e. 4.7% and 1971-1981 i.e. 4.3%. Decadal Growth Rate of Population in Bangalore Urban District (1901-2011). The positive growth of population in the Bangalore Urban district from 1951 is mainly result of migration. The centripetal force of migration was because of many opportunities for education, employment, business and non-agricultural activities. The rapidly expansion of the city is the pull factor for population explosion. The vast growth of urban population from 1951 was a period of intensive industrialization. The main reason for increase in Decadal growth rate of Urban population is because Bangalore is now the commercial and IT Hub if India. About 35% of working-class population are engaged in Information Technology sector and related industries in Bangalore and numerous global Information Technology firms are signing employees from other part of the country as well as abroad. “Four new companies start business in this state every week and they create 50,000 new jobs in one year”.
Tempo of Urbanization:
“Tempo of urbanization means the speed of urbanization that shows the rate of change brought by urbanization. It is calculated based on annual population growth rates” (Kumari, 2014, p. 61). Tempo of urbanization refers to speed of urbanization and is measured as change registered in the level or degree of urbanization over the years. The tempo of urbanization is calculating between the rural and urban population from 1901 to 2011. The growth rate for rural population shows a negative decline since 1901 in each decade except 1961-1971. The tempo of urbanization in the district is seen to be highest in between 1951-1961 whereas it shows a negative decline of -0.63% in between 1961-1971 as shown in Table
Conclusion
The levels of urbanization have been analysed for Bangalore Urban district to understand the historical perspective. The analysis reveals taluk wise variation in urbanizations in the Bangalore Urban District. Highest percent of urbanization was observed in Bangalore City Taluk mainly due to industrialization, commercialization and development of IT Hub. While, the lowest percent of urbanization was found in Bangalore East Taluk. Overall, the percentage of urban population in the district was found to be 90.9% which means that most of the population in the district is urbanized. Anekal Taluk have recorded moderate level of urbanization while Bangalore North, Bangalore South and Bangalore East have recorded low level of urbanization. Thus, the growth and trend of urbanization in the District showed to retain high level of Urbanization since 1951 and tends to continue gradually in all the taluks of the Bangalore Urban District. The unplanned and abnormal development of Bangalore Urban District has resulted in several issues like unauthorised and unplanned residential colonies, ribbon development of Highways, Exploitation of Ground water, Poor Sewage, Poor Management of Solid Waste Management, Traffic Management and Congestion, Air and Noise Pollution, Health Issues and many other related issues whereas these issues can be overcome with some strategies like Phase or sector wise Development, Planned Development of Housing, Development of Highways Corridor and Traffic Management, Development of Transport Facilities and Infrastructure Development and Management, Ground Water Conservation and Rainwater Harvesting Methods, proper management of solid waste disposal , waste water disposal and sewage Management, Afforestation and development of green spaces which would result for the proper conservation , management and development of the Bangalore urban district.
References
- Banerjee, S., & De, D. (2014). Level of Urbanization: An Empirical Study of North 24 Parganas. International Research Journal of Social Sciences, 3(10), 12–20.
- Barakade, A. J., & Todkari, G. U. (2014). A study of Urbanization in Satara District of Maharashtra. Geoscience Research, 2(1), 38-44.
- Chakraborty, S., Chatterjee, S., Das, K., & Roy, U. (2015). Changing pattern of urbanization in West Bengal: An analysis of 2011 census of India data. Asian Journal of Research in Social Sciences and Humanities, 5(5), 169-181. https://doi.org/10.5958/2249-7315.2015.00117.3
- Chaolin, G. U., Lingqian, H. U., & Cook, I. G. (2017). China’ s Urbanization in 1949 – 2015: Processes and Driving Forces. Chinese geographical science, 27(6), 847–859. https://doi.org/10.1007/s11769-017-0911-9
- Gu, C. (2019). Urbanization: Processes and driving forces. Science China Earth Sciences, 62(9), 1351-1360. https://doi.org/10.1007/s11430-018-9359-y
- Khanna, D. (2019). Research Paper on Trends and Patterns in The Levels of Urbanization in Rajasthan (1901 to 2011). IJRAR- International Journal of Research and Analytical Reviews, 6(2), 134–141.
- Kumar, A., & Rai, A. K. (2014). Urbanization Process, Trend, Pattern and Its Consequences in India. Neo Geographia, 3(4), 54–77. http://interactionsforum.com/neo
- Kumari, K. (2014). The trends and level of urbanization in Eastern Uttar Pradesh. IOSR Journal of Humanities and Social Science, 19(10), 60-64.
- Mandal, S. (2017). Level and Trend of Urbanization: A Study on Purulia District of West Bengal. IOSR Journal of Humanities and Social Science, 22(12), 10-20. https://doi.org/10.9790/0837-2212031020
- Tripathi, S. (2016a). An overview of India’ s Urbanization, Urban Economic Growth and Urban Equity. https://mpra.ub.uni-muenchen.de/45537/
- Tripathi, S. (2016b). Determinants of Urbanization in Different Size / Class Distribution of Cities / Towns in India. https://mpra.ub.uni-muenchen.de/74757/
- Tripathi, S., & Mahey, K. (2018). Urbanization and economic growth in Punjab (India): an empirical analysis. Urban Research & Practice, 10(4), 379–402. https://doi.org/10.1080/17535069.2016.1227875
- Tv, R., Aithal, B. H., & Sanna, D. D. (2012). International Journal of Applied Earth Observation and Geoinformation Insights to urban dynamics through landscape spatial pattern analysis. International Journal of Applied Earth Observations and Geoinformation, 18, 329–343. https://doi.org/10.1016/j.jag.2012.03.005
Copyright information

This work is licensed under a Creative Commons Attribution-NonCommercial-NoDerivatives 4.0 International License.
About this article
Publication Date
12 October 2020
Article Doi
eBook ISBN
978-1-80296-088-4
Publisher
European Publisher
Volume
89
Print ISBN (optional)
-
Edition Number
1st Edition
Pages
1-796
Subjects
Business, innovation, sustainability, environment, green business, environmental issues, urban planning, municipal planning, disasters, social impact of disasters
Cite this article as:
Puttalingaiah, S., Hanjagi, A. D., & Irfan, S. (2020). Levels of Urbanization in Bangalore Urban District of Karnataka, India. In N. Samat, J. Sulong, M. Pourya Asl, P. Keikhosrokiani, Y. Azam, & S. T. K. Leng (Eds.), Innovation and Transformation in Humanities for a Sustainable Tomorrow, vol 89. European Proceedings of Social and Behavioural Sciences (pp. 70-80). European Publisher. https://doi.org/10.15405/epsbs.2020.10.02.7