
Social Vulnerability Changes and Sustainable Development in The Flooded Industrial Complex Area


Abstract
Focusing on disaster risk management of enterprises in industrial complex areas is significant for learning from disasters; however, there has not been much exploration of longer and social-oriented perspectives. Therefore, the study detailed in this paper sought to investigate systematically the changes before and after the 2011 flood disaster in the vulnerability of Ayutthaya province, primarily focusing on the social vulnerability gaps and changes in the district, including areas that both include and do not include industrial parks/estates, in order to examine sustainability. Field surveys and statistical analyses were undertaken to explore this research. As a result, the study found: 1) Phra Nakhon Si Ayutthaya (PNSA) is the most vulnerable district; 2) the east side of Ayutthaya, which does not include industrial parks/estates, indicates high social vulnerability; 3) Bang Pa-in district, which has two industrial parks/estates, became more vulnerable after the disaster with a growing high susceptibility and exposure tendency. The study recommends that updated flood and vulnerability risk information be shared and active collaboration be undertaken among stakeholders, including central and local government administrations, infrastructure providers, private enterprises and communities, not only during disasters but also before and after the disaster in order to attain sustainable development in the industrial complex area. This research was conducted as a part of the Science and Technology Research Partnership for Sustainable Development (SATREPS) (Japanese government ODA) project.
Keywords: Social vulnerabilitythe 2011 Chao Phraya River flood disastersustainable developmentindustrial complex area
Introduction
Climate change and disaster risk reduction are significant challenges for our shared future. In this regard, we can find many efforts related to various fields, such as the sustainable development goals (SDGs) set by the United Nations. However, losses from disasters tend to be increasing (Wallemacq, 2018). One of the reasons for this is that disasters cannot be explained by a single discipline, such as engineering, natural science, or social science, to develop practical solutions. Disasters are complex and change as time passes and are accompanied by socio-economic changes, as well as climate change and the advancement of science and technology. This point of view is crucial to understand disasters. Social Vulnerability Index (SVI) is one of the practical tools that can be used to assess social vulnerability in a target area to examine disaster risk. There are many works of literature published on SVI, mainly after Cutter et al. (2013). They are based on the same model explained below and have used Geographic Information Systems to visualize the findings. The basic calculation methods for SVI are nearly the same based on the maximum minus minimum values equations. However, the specific methods are different, as explained in the following sections. As mentioned in the Press and Release Model by Wisner et al. (2004), disaster risk can be considered for an overlapping area between hazard and vulnerability. Natural hazards are predominantly associated with natural processes and phenomena (United Nations Office for Disaster Risk Reduction [UNDRR], n.d.), and vulnerability can be defined as "the conditions determined by physical, social, economic and environmental factors or processes which increase the susceptibility of an individual, a community, assets or systems to the impacts of hazards" (UNDRR, n.d., para 1). In previous studies, mainly by natural scientists and engineers, hazard risk related to the 2011 Chao Phraya River flood has tended to be investigated and recognized as a disaster risk; vulnerability risk was not examined well, even though significant social science research has been conducted on the 2011 Chao Phraya River flood. Given the above situation, this study utilized a social vulnerability index in the industrial complex area (SVI-ICA) to understand the vulnerability risk and examined sustainability in the area from a longer perspective by comparing available data both before and after the disaster.
Problem Statement
The 2011 Chao Phraya River flood disaster and Industrial Parks
-
Outline of the damage
Severe flooding occurred during the 2011 monsoon season in Thailand, beginning at the end of July and ending in mid-January 2012. The flooding resulted in a total of 813 deaths, 9.5 million people affected, and economic damage of USD 40 billion (ADRC, 2019). Damage in the agriculture, manufacturing, and service industries lowered the country's GDP (market value) by about 33 billion baht and economic growth by 3.7%. Consequently, the annual GDP growth only increased by 0.1% in 2011, a significant decrease from the estimated growth of 3.8% (H.E.V. Futrakul, 2012). In addition to these economic declines, the Chao Phraya River floods drew global attention, which indicates that the impact of the floods did not remain within Thailand, but spread all over the world, mainly through foreign companies and industrial complexes.
Economic damage
The flood had a devastating impact on the industrial complexes in central Thailand and manufacturers with their factories there. National statistics show the changes in GDP during the fourth quarter of 2011. While GDP rose by 0.7% in agriculture, it declined by 10.1% in the non-agricultural sector, resulting in a 9.0% decrease in total. The non-agricultural sector includes manufacturing, construction, and hotels and restaurants, with GDP decreases by 21.8%, 5.9%, and 5.3%, respectively (Termpittayapaisith, 2012). These results show that the manufacturing sector was by far the most affected by the floods. The impact of the floods was particularly serious on local Japanese companies in economic terms. More specifically, those Japanese companies that had based their businesses in the country earlier than others had more damage. This is because many of those companies located their factories in the industrial complexes in central Thailand (Ayutthaya and Pathum Thani provinces), with the complexes being relatively old, mostly established in the 1980s (Okazumi & Nakasu, 2015; Nakasu et al., 2013).
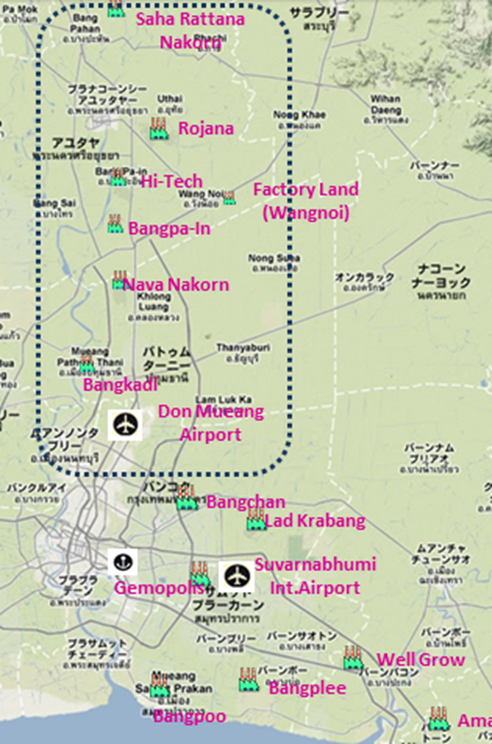
Well over 1,000 factories of 804 companies were inundated, including 43 companies in the Saha Rattana Nakorn Industrial Estate, 198 in the Rojana Industrial Park, 143 in the Hi-Tech Industrial Estate, 89 in the Bangpa-In Industrial Estate, 572 in the Factory Land Wangnoi, 227 in the Nava Nakorn Industrial Estate, and 44 in the Bangkadi Industrial Park (Table
Industrial complex areas, facilitated by Thai government policies and supply chain systems, have been enlarged along with the global economic trends in the area. Japanese enterprises advanced or relocated to the area, especially after the Plaza Agreement in 1985 and facilitated by the bankruptcy of Lehman Brothers, accompanied by strong appreciation in the Japanese yen (Nakasu, 2017).
Concerning the industrial complex areas, large-scale land-use change, and development led to drastically increased runoff, over-extraction of groundwater, and the filling in of canals and waterways. Overreliance on antiquated and poorly maintained infrastructure by both local and national governments further increased the vulnerability to the 2011 flood (Marks & Lebel, 2016).
(Source: Affected Industrial Estates (Source: Guy Carpenter, Bangkok Post), November 3, 2011. The authors have altered.)
Research Questions
This study has attempted to clarify the present social vulnerability and social vulnerability changes before and after the disaster in order to understand the area better and to propose effective countermeasures for a sustainable future in the industrial complex area. Accordingly, the research questions were as follows:
What were the vulnerabilities and vulnerability changes in the industrial complex areas before and after the 2011 flood disasters?
Have districts that have industrial parks/estates become safer after the disasters?
What were the most important lessons learned from this disaster and recommendations to attain sustainable development in the industrial complex areas?
Purpose of the Study
The purpose of this study was to contribute to the sustainable future in the flooded industrial complex areas by examining the social vulnerability changes from a longer perspective, which have not been investigated sufficiently. In particular, this study focused on a before and after comparison of the 2011 disaster in districts that both have and do not have industrial complexes, providing baseline knowledge for understanding disasters. This study indicates what changes have occurred after the disaster regarding a social vulnerability in order to examine sustainable development in the area, accompanied by specific recommendations.
Research Methods
Literature and scope of the research
Regarding the published literature, there are several approaches to investigate the 2011 flood. Marks and Lebel (2016) describe how Thailand’s incomplete decentralization and administrative fragmentation has created numerous barriers to polycentric disaster governance. Hagiwara et al. (2014) explained the chain reactions of the economic damage mainly derived from the experience of Japanese enterprises and points out issues that disrupted their businesses. That paper focused on the risk management changes of the firms after the 2011 flood, indicating they have strengthened their flood countermeasures as a whole, but points to the need to consider more about the collaborations with business partners or other entities. Okazumi and Nakasu (2013, 2015) examined the devastating exacerbation of economic damage through a social background perspective and enterprise inter-relationships. Nakasu (2017) clarified the reasons why so many Japanese companies moved to the potential risk area in Thailand. The reasons are from the perspective of both the country's social factors through decentralization policies facilitated by the Thai government and also yen appreciation triggered by the Plaza agreement (1985) and the Lehman Brother’s bankruptcy (2008) to propel Japanese enterprise relocation and advancement. Haraguchi and Upmanu (2015) emphasized the decision-making process of enterprises to clarify the trigger of economic damage. That paper proposed measures for related supply chain risk through setting research questions such as private investment decision-making, the diversified sources of procurement, emergent assistance from other partner companies in the same supply chain, and the degree of the recovery of customers. Tamada et al. (2013) approached the subject mainly from economic, political, hydrological, and technological perspectives with various authors. That book clarified the complexity of the 2011 flood and overviewed how human interventions affect the disaster, such as local people's lifestyle changes before the disaster, the establishment of the industrial complexes in the area, government agency conflicts, dam operation impacts, unexpected rainfall, and private company reactions. Singkran (2017) reviewed the 2011 flood from disaster management views and emphasized the need for more non-structural countermeasures and participatory collaboration among stakeholders for effective disaster management. Accordingly, while there have been publications investigating the industrial and political points of view, there has not been much investigation of longer and broader views, such as sustainability from the local society's viewpoint. Therefore, this study sought to investigate the changes in social vulnerability systematically. In particular, this study focused on interviews with Ayutthaya government officials and an investigation of statistical data by establishing a social vulnerability index to consider the sustainable future in the industrial complex areas. The scope of the study focused on the changes to vulnerability in the target areas before and after the 2011 disaster. The target areas were districts, sub-districts, and villages around the industrial parks, as mentioned in Figure
![Districts in Ayutthaya Province West side Ban Sai is Ban Sai (1413) [บางซ้าย is the
Thai word for Ban Sai] South side Ban Sai is Ban Sai (1404) [บางไทร is the
Thai word for Ban Sai]](https://www.europeanproceedings.com/files/data/article/10036/11228/ICH2019F023.fig.003.jpg)
Background of establishing the SVI-ICA
As mentioned in the previous section, Marks and Lebel (2016), Marks (2019), Okazumi and Nakasu (2015), Tamada et al. (2013), and Nakasu (2017) have investigated the socio-political background of the industrial complex areas. In particular, Nakasu (2017) explored the reasons why so many Japanese enterprises relocated to the area. In that paper, inappropriate regional development, decentralization policy, global economic events, and urbanization were identified. Besides, the industrial areas are mainly protected by a water wall to the east side of Ayutthaya. To the west side of Ayutthaya, primarily agricultural areas are used for water reservoirs to retain water, similar to a dam. Canals are also used to drain excess water. These were reported in interviews in March 2019 with the vice governor of Ayutthaya as the present significant strategic countermeasures used by the local government after the 2011 disaster. However, longer and broader perspectives, such as demographic trends, including post-disaster situations, are required to understand the sustainability of the area. By recognizing those aspects, this study used a social vulnerability index and examined social vulnerability changes.
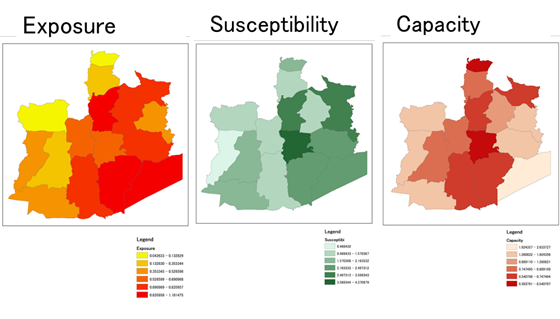
Exposure, Susceptibility, and Capacity
After referring to the Pressure and Release Model (PAR model) and other literature to identify a district's social vulnerabilities to natural disasters (Wisner et al., 2004), the authors created three categories – exposure, susceptibility and capacity – then, identified variables used to assess the social vulnerability of districts, as shown in Table
Establishing SVI-ICA
To develop the social vulnerability index in the industrial complex area (SVI-ICA), firstly, data was collected at the maximum level, including field surveys in Ayutthaya province, visiting Ayutthaya government offices and also a local university. After the process, there was a discussion of the variables to be used for establishing SVI-ICA, as well as creating each index: exposure, susceptibility and capacity. Each indicator, selected reasons and methodologies referred to the abundant recent literature, such as de Brito et al. (2018), di Girasole and Cannatella (2017), Fatemi et al. (2017), Fekete (2019a, 2019b), Ge et al. (2017), Morimoto (2019), Ostadtaghizadeh et al. (2015), Sorg et al. (2018), Stafford and Abramowitz (2017), Tavares et al. (2018). In particular, the study referred to Birkmann et al. (2013) and Morimoto (2019) to apply MOVE framework with the mentioned PAR model (Wisner et al., 2004) and Fekete (2019b) is referenced for demographic viewpoints. The equations applied the Human Development Index method developed by the United Nations Development Programme (UNDP), as indicated below in Eq. (1) and Eq. (2). Finally, each index was calculated by adding each value of the indicators.
The study did not establish SVI-ICA by merely combining each component, but used principal component analysis, as indicated in Table
Findings
Exposure, Susceptibility and Capacity by District in Ayutthaya
-
Exposure
As shown the results in Figure
Susceptibility
Figure
Capacity
Capacity can be seen in Figure
SVI-ICA by District
Figure
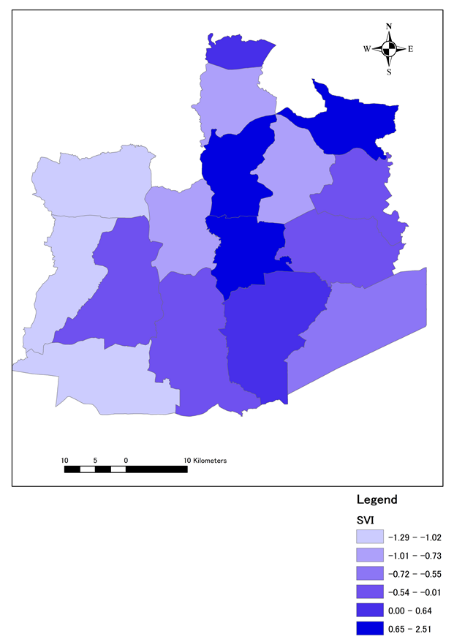
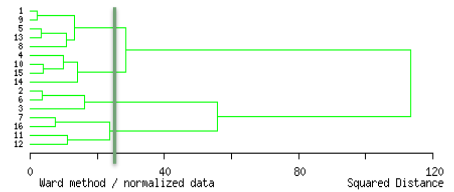
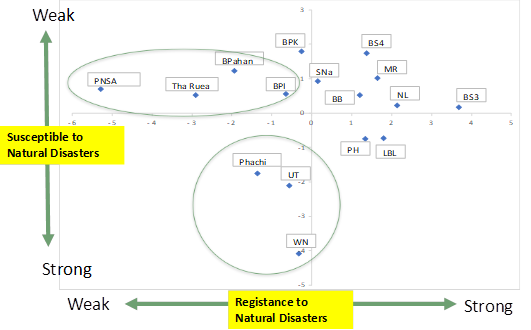
Cluster analysis and visualization of the differences
Based on the findings of the principal component analysis and SVI-ICA, this study conducted a cluster analysis to clarify the different characteristics of each district on SVI. Figure
Comparisons with before the 2011 flood disaster: Exposure, susceptibility and demographic changes
Given the limitation on available data, only the exposure and susceptibility indicators before the 2011 disaster were calculated. In addition, as a part of exposure comparison by longitudinal perspective, population changes of each district were also examined.
Exposure Index and Population Density
As indicated in Table
-
Susceptibility Indices and Child and Elderly Densities
Decreased child density and increased elderly density numbers are apparent for almost all the districts, as indicated in Table
-
Population Change
Annual average population change was calculated by the total population change between the target initial years and the end of the years. The proportion of annual average population change was calculated using the number of the interval years. Uthai and Nakhon Luang districts have a strong tendency to decrease population. Only two districts, Bang Pahan and Bang Phreak, had positive population changes. Others had negative population changes (Table
-
Countermeasure Changes
Concerning recent countermeasure changes in Ayutthaya, the local government introduced strategies and various projects after the 2011 disaster. These measures protect the industrial complex areas mainly by hard countermeasures, along with the utilization of the agricultural area as reservoirs after the harvest time and during the flood period, as well as use the canals to release excess water. These are well-considered and appear to be very useful. However, more effective countermeasures could be considered. In particular, the social changes in the area tend not to be examined and the application of the countermeasures usually considers the same social situations as before the disaster.
Discussions: Social Vulnerability Gaps and Changes
Based on the results, the exposure changes before and after the flood has a statistically significant difference between districts that have and do not have industrial parks/estates (The Wilcoxon Rank Sum Test value (w)=48, p=0.004>0.05). Notably, five districts, Phak Hai, Tha Ruea, Bang Pahan, Ban Phraek and Phachi, which have no industrial parks/estates, have negative exposure index changes. Negative exposure index change means the districts have tended to lose population and industry. Bang Pa-in, on the other hand, is the only district that has two industrial estates and a considerable population density, as well as an increasing exposure index change. Therefore, the exposure change provides both positive and negative aspects to consider sustainable development. Concerning susceptibility, there is no statistically significant difference between districts with and without industrial parks/estates ( w=37, p=0.06>0.05), although Bang Pa-in, Bang Ban, and Wang Noi have become more susceptible after the 2011 disaster. These districts have higher elderly and child densities after the disaster. These changes require more capacities to cope with disasters for sustainable development. In this study, capacity changes could not be measured because of the limitations of available data; however, the issue is clarified as mentioned. Concerning SVI-ICA, the recent data clearly shows there is statistically no significant difference between districts with and without industrial park (w=22, p=0.86>0.05). The data also indicates that PNSA is the highest, and the east side of Ayutthaya, which has no industrial parks/estates, such as Bang Pahan and Tha Ruea, are the second and the third highest districts. Bang Pa-in district, which has two industrial estates, is the fourth highest district. These recent SVI-ICA figures with past mentioned exposure and susceptibility changes indicate PNSA, the east side districts without industrial parks/estates, and Bang Pa-in district need more focus for disaster countermeasures than other areas.
Conclusion
Main Contributions and Recommendations
As a result, this study identifies the prioritized districts for disaster countermeasures, which have the highest SVI-ICA: PNSA, the east side districts without industrial parks/estates districts with high social vulnerability, and Bang Pa-in which has two industrial parks/estates have become more vulnerable after the disaster with growing high susceptibility and exposure tendency. There were no significant gaps found between districts with and without industrial parks/estates; however, disaster countermeasures for the west side of Ayutthaya province, which has farmland without industrial parks/estates, should also be considered. The area has tended to lose population and industry. Disaster risk should not only consider hazards, such as precipitations and topography, along with hard countermeasures, such as water walls, but the social vulnerability with social change should be examined as well.
Limitations and Challenges: Data Availability
Data availability is the core limitation and challenge for this study. Table
Future Directions
-
SATREPS Project: Need to Have an Integrated and Longer Perspective
The Japanese government ODA, SATREPS project, was launched (2018-2022) under the title "The Project on Regional Resilience Enhancement through Establishment of Area-BCM at Industry Complexes in Thailand." This project uses space, geospatial, and other related data and develops and applies the data not only for industrial complex business continuity management, but also for local governments and related stakeholders in the areas to enhance regional resilience (JST, 2019). In particular, the project sets up new community research to understand the relationship between local people and industrial parks/estates/zones in the area. The project also focuses on the local people's well-being, including employees and their families, for sustainable development in the area. This new perspective provides the project, as well as a bilateral science and technology cooperation scheme, a new challenge and will be a significant step to align with the United Nations Sustainable Development Goals (SDGs).
For a Sustainable Future with Industries
The 2011 Chao Phraya River flood clarifies the existence of globalized economic activities and the vulnerability of manufacturing industries. The industrial concentrations in developing countries caused by low price competition of products and increasing industrial-economic risk became apparent. The lessons learned are the need for risk management to adjust to changing global conditions. As well, national and local governments must understand the needs regarding information about risk and providing such information to foreign enterprises when they invite businesses from abroad, along with understanding global economic trends. For instance, information on the potential risks and how to cope with such risks by the national and local governments with stakeholders should be provided. Also, it is necessary to implement risk assessment using internationally standardized and recognized processes. At the same time, the companies have social responsibilities to disclose risk information, such as what business they are doing, what kinds of risks exist for the local people and what they can do during the disaster for the communities. At the same time, local governments and communities should know their social vulnerabilities and related changes in order to understand the risk clearly and also set up countermeasures according to the hazard risk. The 2011 Chao Phraya River flood was a trigger to acknowledge the necessity of risk management for companies, localities and governments in the context of a changing global industrial economy (Singkran, T, 2017). Regional planning considering potential risks of the changes, the roles of the companies, regions and nations, risk and risk assessment and information disclosure, as well as sharing risk information among related stakeholders, are issues to be prepared for and recognized for regional sustainability and resilience in the future. The mentioned SATREPS project is an example of the first step to tackle these issues; however, broader views are required and more discussion should be undertaken.
Acknowledgments
The authors would like to thank the Ayutthaya Government Office, National Statistical Office (NSO), Rajaphat University Phra Nakhon Si Ayutthaya and other agencies who provided their time, data and advice. The authors are also grateful to the SATREPS project members at Chulalongkorn University and Japan Science and Technology Agency (JST) and the Japan International Cooperation Agency (JICA), who allowed us to undertake this investigation. Our gratitude also extends to ADPC members who provided assistance in our surveys. This research was supported by the Science and Technology Research Partnership for Sustainable Development (SATREPS) in collaboration between Japan Science and Technology Agency (JST, JPMJSAI1708) and Japan International Cooperation Agency (JICA) and also Ratchadapisek Sompoch Endowment Fund (2019) under Climate Change and Disaster Management Cluster, Chulalongkorn University.
References
- Asian Disaster Preparedness Center (ADPC) iPrepare Business Facility. (2019). OBSERVATIONAL REPORT Baseline Exploratory Survey on Establishing Social Vulnerability Index, ADPC
- Asian Disaster Reduction Center. (2019). Thailand: Flood Retrieved 12 March, 2019, from https://www.adrc.asia/nationinformation.php?NationCode=764&Lang=en&NationNum=09
- Termpittayapaisith, A. (2012). NESDB Secretary General, Thailand's Future Development and Water Management Plans. Handout at the meeting of the Research Institute of Economy, Trade and Industry, Ministry of Economy, Trade, and Industry, 3, 7-8.
- Birkmann, J., Cardona, O. D., Carreño, M. L., Barbat, A. H., Pelling, M., Schneiderbauer, S., Kienberger, S., Keiler, M., Alexander, D., Zeil, P., & Welle, T. (2013). Framing vulnerability, risk and societal responses: the MOVE framework. Natural hazards, 67(2), 193-211. https://doi.org/10.1007/s11069-013-0558-5
- Cutter, S. L., Boruff, B. J., & Shirley, W. L. (2013). Social vulnerability to environmental hazards. Social science quarterly, 84(2), 242-261. https://doi.org/10.1111/1540-6237.8402002
- de Brito, M. M., Evers, M., & Almoradie, A. D. S. (2018). Participatory flood vulnerability assessment: a multi-criteria approach. Hydrology & Earth System Sciences, 22(1), 373-390. https://doi.org/10.5194/hess-22-373-2018
- di Girasole, E. G., & Cannatella, D. (2017). Social Vulnerability to Natural Hazards in Urban Systems. An Application in Santo Domingo (Dominican Republic). Sustainability, 9(11), 1-17.
- Fatemi, F., Ardalan, A., Aguirre, B., Mansouri, N., & Mohammadfam, I. (2017). Social vulnerability indicators in disasters: Findings from a systematic review. International journal of disaster risk reduction, 22, 219-227. https://doi.org/10.1016/j.ijdrr.2016.09.006
- Fekete, A. (2019a). Social Vulnerability (Re-)Assessment in Context to Natural Hazards: Review of the Usefulness of the Spatial Indicator Approach and Investigations of Validation Demands. International Journal of Disaster Risk Science, 10, 220-232. https://doi.org/10.1007/s13753-019-0213-1
- Fekete, A. (2019b). Social vulnerability change assessment: monitoring longitudinal demographic indicators of disaster risk in Germany from 2005 to 2015. Natural Hazards, 95(3), 585-614. https://doi.org/10.1007/s11069-018-3506-6
- Ge, Y., Dou, W., & Dai, J. (2017). A New Approach to Identify Social Vulnerability to Climate Change in the Yangtze River Delta. Sustainability, 9(12), 2236. https://doi.org/10.3390/su9122236
- Hagiwara, Y., Kuribayashi, D., Okazumi, T., & Nakasu, T. (2014). Characteristics of the Chain-Reaction Damage of the Japanese Firms Affected by the 2011 Thai Flood. Advances in River Engineering, 20, 397-402. (in Japanese)
- Haraguchi, M., & Upmanu, L. (2015). Flood risks and impacts: A Case Study of Thailand’s Floods in 2011 and Research Questions for Supply Chain Decision Making. International Journal of Disaster Risk Reduction, 14, 256-272. https://doi.org/10.1016/j.ijdrr.2014.09.005
- H.E.V. Futrakul. (2012). Thailand's Economy After the Great Flood BLL Seminar Handout, Research Institute of Economy, Trade, Industry, Ministry of Economy, Trade and Industry, March 23,2012,Tokyo.
- Japan Science and Technology Agency (JST). (2019). Regional Resilience Enhancement through Establishment of Area-BCM at Industry Complexes in Thailand: Enhance regional resilience through visualization of disaster risks with industry, government and academia collaboration. SATREPS (Science and Technology Research Partnership for Sustainable Development) Project. Retrieved March 20, 2019, from https://www.jst.go.jp/global/english/kadai/h2908_thailand.html
- JETRO. (2012). Special Topics: Information on Thai Flood Disaster Recovery, Tokyo (in Japanese). Retrieved 20 June, 2020, from http://www.jetro.go.jp/world/asia/th/flood/
- Marks, D., & Lebel, L. (2016). Disaster governance and the scalar politics of incomplete decentralization: fragmented and contested responses to the 2011 floods in Central Thailand. Habitat Int Decentralizing Disaster Gov Spec, 52, 57–66. https://doi.org/10.1016/j.habitatint.2015.08.024
- Marks, D. (2019). Assembling the 2011 Thailand floods: Protecting farmers and inundating high-value industrial estates in a fragmented hydro-social territory. Political Geography, 68, 66-76. https://doi.org/10.1016/j.polgeo.2018.10.002
- Morimoto, T. (2019). Spatial analysis of social vulnerability to floods based on the MOVE framework and information entropy method: Case study of Katsushika Ward, Tokyo. Sustainability, 11(2), 529. https://doi.org/10.3390/su11020529
- Nakasu, T., Okazumi, T., & Shimizu, Y. (2013). Establishment of Industrial Areas and New Risk Management: Chain Reactions of Economic Damage caused by 2011 Thailand Chao Phraya River Flood Disasters and Local Societies. The Journal of Urban Social Studies, 5, 159-169.
- Nakasu, T. (2007, July). Natural disasters and disaster management in Thailand: Status, risks, and trends. In Proceedings of the 13th International Conference on Thai Studies: Globalized Thailand.
- Okazumi, T., & Nakasu, T. (2015). Lessons learned from two unprecedented disasters in 2011–Great East Japan Earthquake and Tsunami in Japan and Chao Phraya River flood in Thailand. International journal of disaster risk reduction, 13, 200-206. https://doi.org/10.1016/j.ijdrr.2015.05.008
- Ostadtaghizadeh, A., Ardalan, A., Paton, D., Jabbari, H., & Khankeh, H. R. (2015). Community disaster resilience: a systematic review on assessment models and tools. PLoS currents, 7. https://doi.org/10.1371/currents.dis.f224ef8efbdfcf1d508dd0de4d8210ed
- Singkran, N. (2017). Flood risk management in Thailand: Shifting from a passive to a progressive paradigm. International journal of disaster risk reduction, 25, 92-100. https://doi.org/10.1016/j.ijdrr.2017.08.003
- Sorg, L., Medina, N., Feldmeyer, D., Sanchez, A., Vojinovic, Z., Birkmann, J., & Marchese, A. (2018). Capturing the multifaceted phenomena of socioeconomic vulnerability. Natural Hazards, 92(1), 257-282. https://doi.org/10.1007/s11069-018-3207-1
- Stafford, S., & Abramowitz, J. (2017). An analysis of methods for identifying social vulnerability to climate change and sea level rise: A case study of Hampton Roads, Virginia. Natural Hazards, 85(2), 1089-1117. https://doi.org/10.1007/s11069-016-2622-4
- Sukekawa, S. (2013). Impacts on Industries and Enterprises Caused by the Thai 2011 Great Flood. In Thai 2011 Great Flood. Chiba: IDE-JETRO. (in Japanese)
- Tamada, Y., Hoshikawa, K., & Funatsu, T. (Eds.) (2013). The 2011 Great Flood: Records and Lessons. In Thai 2011 Great Flood. Chiba: IDE-JETRO (in Japanese).
- Tavares, A. O., Barros, J. L., Santos, P. P., & Mendes, J. M. (2018). A new approach for social vulnerability in mainland Portugal area for risk mitigation. Safety & Reliability. Safe Societies in a Changing World, 1719-1726. http://hdl.handle.net/10316/84790
- United Nations Office for Disaster Risk Reduction. (n.d.). Terminology. Retrieved 29 July, 2019, from https://www.unisdr.org/we/inform/terminology
- United Nations Development Programme (UNDP) scheme. Australian Journal of Civil Engineering, 15(2), 103-108.
- Wallemacq, P. (2018). Economic losses, poverty & disasters: 1998-2017. Centre for Research on the Epidemiology of Disasters, CRED.
- Wisner, B., Blaikie, P., Cannon, T., & Davis, I. (2004). At Risk: Natural Hazards, People’s Vulnerability and Disasters. Routledge.
Copyright information

This work is licensed under a Creative Commons Attribution-NonCommercial-NoDerivatives 4.0 International License.
About this article
Publication Date
12 October 2020
Article Doi
eBook ISBN
978-1-80296-088-4
Publisher
European Publisher
Volume
89
Print ISBN (optional)
-
Edition Number
1st Edition
Pages
1-796
Subjects
Business, innovation, sustainability, environment, green business, environmental issues, urban planning, municipal planning, disasters, social impact of disasters
Cite this article as:
Nakasu, T., Bula-Or, R., Anantsuksomsri, S., & Positlimpakul, K. (2020). Social Vulnerability Changes and Sustainable Development in The Flooded Industrial Complex Area. In N. Samat, J. Sulong, M. Pourya Asl, P. Keikhosrokiani, Y. Azam, & S. T. K. Leng (Eds.), Innovation and Transformation in Humanities for a Sustainable Tomorrow, vol 89. European Proceedings of Social and Behavioural Sciences (pp. 239-257). European Publisher. https://doi.org/10.15405/epsbs.2020.10.02.23