
Statistical Approach To The Research Of Crime In The Russian Federation


Abstract
The relevance of a statistical study of crime is determined by the place it occupies in ensuring national security. The object of the study is the crime rate in the Russian Federation. The subject of the study is quantitative trends in the crime rate. The study of crime was based on the integrated and systemic approach and statistical methods: analysis of the time series, generalizing indicators, the method of statistical typological grouping, structural-dynamic and the method of correlation and regression analysis. The main feature of the study is the development of an information-methodological approach based on the formed system of indicators: the study of crime on various socio-demographic grounds; identifying qualitatively different groups of regions according to the severity index of crimes using the typological grouping method and identifying the influence of factors on the crime rate by the method of correlation and regression analysis. Territorial features and factors of crime should be taken into account when developing variants of managerial decisions of federal and regional programs determining social policy. State authorities should work out mechanisms for counteracting crime. The results of the crime rate survey can be used as a visual representation of the existing legal situation in the regions of the Russian Federation. Territorial features and factors of crime should be taken into account when developing variants of managerial decisions of federal and regional programs by the authorities determining social policy, and state authorities that form criminal policy should work out mechanisms for counteracting crime.
Keywords: Study of crimelatent crimescope of crime
Introduction
One of the global problems of our time, affecting all aspects of public life and posing a direct threat to the implementation of economic transformations, is a steady increase in the crime rate as a factor of social destabilization.
A number of authors studied recorded crime - Flatley, Kershaw, Smith, Chaplin, & Moon (2010) and latent crime - Inshakov (2011) and Luneev (2005). Such studies make it possible to draw the attention of state bodies that form criminal policy taking into account latent crime in order to develop effective measure regulating the counteraction of all crime.
The diversity of regional features in the Russian Federation has an impact on the significant differentiation of socio-economic indicators, one of which is the crime rate. In this regard, the study of territorial differences in crime makes it possible to differentiate the fight against crime in each region, to penetrate deeper into the mechanism for determining the crime rate and its changes, to establish patterns of crime in different economic, social, demographic and other characteristics of the subjects of the Russian Federation.
Problem Statement
To conduct a study of crime, the authors studied the works of several authors. The theoretical foundations of crime are devoted to the works of the following authors: Kleymenov (2012), Kvashis, Genrikh, Kamalova, & Morozov (2013), Meshkova (2013), Imangaliyev & Hanov (2015), Volkonskaya (2014). The methodological issues of crime are reflected in the works of Kvashis & Heinrich (2013).
The purpose of this work is to study the social image of crime, based on a comprehensive and systematic approach and statistical methods of analysis.
Research Questions
Considering the gaps in the existing literature and the need to implement an integrated approach to the study, the authors set the following research questions:
Identify the features of the crime process when comparing the average crime rates in Russia in the long interval from 1961 to 2016;
Identify the statistical characteristics of the decrease in crime for 2011-2016;
Study the socio-demographic structure of crimes in a number of characteristics (gender, age and occupation);
Develop the qualitative characteristics of the structures mobility under study using the author’s scale of structural differences - Chistik (1995).
Highlight qualitatively different groups of regions of Russia according to the crime severity index;
Carry out a simulation of the crime rate on the basis of the formed system of indicators.
Purpose of the Study
Some authors consider the psychological and behavioral causes of crime: Li & Brunton-Smith (2018); Armstrong, Cain, Wylie, Muftić, & Bouffard (2018); Rocque & Snellings (2018). A number of authors explore approaches to reduce crime and certain aspects of violent crime: Nazaretian & Marolla (2013), Farrell, Tilley, & Tseloni (2014). The work of Walby, Towers, & Francis (2016) consider the types of crime and related factors. In our subject area, crime should be defined as a quantitatively measured massively complex (multifactorial) phenomenon, with quantitative differences in the territorial aspect and characterizing the state of national security. Therefore, the study applied the principles of econometrics, which were considered by the following authors: Hill, Griffiths, & Lim (2012), Studenmund (2014).
The purpose of the study is to analyze the social image of crime based on the information and methodological approach and the formed system of indicators.
Research Methods
To achieve the purpose of the study, general scientific and special methods and techniques of scientific knowledge, such as logical-theoretical analysis, synthesis and analysis, generalization; systemic and integrated approaches with an arsenal of economic and statistical research methods: a method of generalizing statistical indicators, a tabular method and graphical methods, methods of statistical analytical grouping, structure analysis, a method of analyzing a number of dynamics and a method of correlation and regression analysis are applied. A significant set of research tools is associated with the complexity and versatility of the process under study.
Findings
Conducting a dynamic analysis of the crime rate in the Russian Federation allows a detailed analysis of development features of the phenomenon under study, based on average crime rates in the time period studied from 1961 to 2016 over five-year periods (Figure
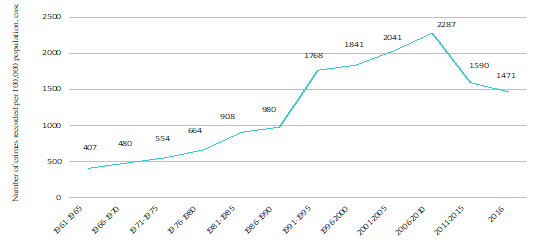
Source: authors, based on official data of the Federal State Statistics Service. Access mode: http://www.gks.ru
First stage: During the period of five-year plans and before the collapse of the USSR (1961–1990), there were increases in average crime rates without sharp jumps. For 30 years, the number of crimes per 100 thousand people of the population increased from 407 to 980 cases (by 141% or 2.4 times), the most significant increase was observed in 1981-1985 - 37%, or 244 cases.
Second stage: After the collapse of the USSR and until the end of the economic crisis (1990-2010). In this time period there was a significant increase in the average crime rate. For 20 years, it increased from 1,768 to 2,287 cases (by 29%, or 1.3 times). The increase in the average crime rate in 1991-1995 compared with the previous five years (1986-1990) amounted to 80%, or 788 cases.
In this period of time, the sphere of private property expanded in Russia, and market relations developed, which were characterized by a higher prevalence of crime than under the rule of state ownership and the planned system. It should also be noted that this growth rate was not observed at the first stage, where an increase in the average crime rate in 1986-1990 amounted to only 576 cases compared to 1961-1965.
The third stage: After the end of the economic crisis and before major changes in the foreign policy of Russia and a new economic crisis (2011-2016). The average crime rate in the studied period of time (for the analysis is taken the period 2011-2015) compared with the previous one (2006-2010) significantly decreased by 31%, or 697 cases.
For the entire analyzed period (56 years), the average crime rate in 2011–2015 increased by 291%, or 1,183 cases, compared to 1961–1965, when in the period after the collapse of the USSR (1991–1995) this figure increased by 334%, or 1361 cases.
A the present time the crime rate (2016) has reached the average level between 1986-1990 and 1991-1995. In 2016, the number of crimes per 100 thousand people was 1,471 cases, and in 1991 - 1,463 cases, the difference was only 8 cases, and the time span included 16 years.
In order to understand the identity of the offender, it is necessary to examine its structure. The ratio of different types of crimes (Table
Leading positions were occupied by thefts - almost 65 and 69% of the total number of crimes, crimes related to drug trafficking were in second place - 13% and 16%. The third place in terms of share in the total number of recorded crimes was taken by crimes in the economic sphere - 9% and 6%, the total decrease in the indicator by 71.5 thousand cases or by 3.21 percentage points.
In 2011 and in 2016, the largest share was taken by theft - 65% and 69%, respectively. Their number in 2016 decreased by 167.5 thousand cases, but the weight in the total mass remained quite high, an increase of 4.4.
Gender-based crime indicators characterize the significant predominance of male criminals over women. Moreover, over 50% of all crimes committed by women are self-serving. The killings and intended grievous bodily harm are largely committed by men. In this case, the ratio of the number of persons who committed crimes, male to female, in 2011 and in 2016 was 1: 6. In 2016, the number of crimes decreased by 2%. The proportion of females was 15%, while the proportion of males increased by 0.72 percentage points and was 85%.
The age characteristic of criminals makes it possible to identify the degree and intensity of criminogenic activity in certain representatives of age groups. During the studied periods, the largest share was accounted for persons aged 30-49: 41.53% in 2011 and 47.57% in 2016, an increase of 6.04, or 50.8 thousand people, which indicated about a very high increase in crime in adulthood.
The second place in terms of weight in 2011 was taken by persons aged 18–24 years old - 24.40%, and in 2016 - persons aged 25–29 years old and make up 18.99%. In the third position, the situation with respect to the age of persons changed and amounted to 18.65% and 17.95%, respectively, in 2011 and 2016.
A person without a permanent source of income most often violates the law. During the study period, their number decreased by 26.3 thousand people, but the percentage ratio in the group remained fairly high. There are more crimes (by 1.5 percentage points) committed by employees. One of the reasons for the increase in this indicator is the decline in real wages with an increase in consumer prices. Low wages are no longer able to meet the growing needs of the population.
When characterizing a change in the structure, one can reveal its stability or mobility in time. For this purpose, Ryabtsev index of structural differences and the author’s scale for assessing the significance of structural differences are used (Chistik, 1995). Changes that occurred in the structure of recorded crimes by age, according to the occupation of persons who committed crimes, and for certain types of crimes amounted to 0.08, respectively; 0.02 and 0.05.
Based on the scale of assessing the materiality of differences in structures, the authors came to the following conclusion. During the period from 2011-2016, the structure of recorded crimes for certain groups shows a low level of differences in structures. In the age structure of offenders, a very low level of differences in structures was revealed. And there was identity in the structure by occupation at the time of the crime.
The analysis of the socio-demographic structure of crime by sex, age and occupation allows identifying the most vulnerable segments of society and take measures to improve the situation.
To reflect the level of public severity of various crimes committed at different times and in different territories, a typological grouping of regions of the Russian Federation by the crime severity index was built in 2016 compared to 2011 (Table
Crime severity points indicate a penalty for a particular type of crime. When measuring the crime severity index, the measure provided for by the Criminal Code of the Russian Federation is a punitive measure. The standard case was one point equal to one year’s imprisonment, and a single standard criterion for evaluating various crimes according to their public danger was obtained.
The values of the crime severity index <100% indicate that the cumulative crime severity in 2016 compared with the same indicator in 2011 decreased, despite the fact that the total number of crimes in a number of regions increased. In our case, in 77 regions (92.77%) the value of the rate under study is less than 100%.
In the group with a “low” crime severity, there are 14 regions of the Russian Federation (16.87%), which illustrated a rather strong decrease in the aggregate crime severity. The lowest value of the crime severity index was recorded in the Nizhny Novgorod region (51.65%), where a decrease in the number of recorded crimes for each type occurred. The main downward effect on the crime severity index was the indicator of “crimes in the economic sphere”, for which the maximum penalty is 15 years of imprisonment, in 2016 compared to 2011 it decreased by 78.18% or 152 cases per 100 thousand people population. The Samara region has 57.45% - 7th place in the Russian Federation, 5.8% higher than the leading region. It also has a decrease in all types of crimes. The main reduction effect on the crime severity index was the reduction in the number of record robberies and thefts - by 100 cases (71.87%) and 318 cases (63.41%) per 100 thousand people, respectively.
The value of the index in the Moscow region is equal to 68.57%, which makes it possible to attribute it to the regions that are characterized by “average” CSI, where there is a decrease in each type of crime. In 2016 compared to 2011, there was a decrease in the number of robberies and thefts by more than 50%; in absolute changes, the decline was only 41 cases and 157 cases per 100 thousand people, respectively. In addition, it should be noted that the Moscow region in terms of the average annual population takes 2nd place, which also has a direct effect on reducing the crime severity index in the region, since there are fewer crimes per 100 thousand people.
The group with a “growing” crime severity index is St. Petersburg (CSI is 83.95%), where the number of crimes related to drug trafficking (the maximum penalty is 15 years of imprisonment) slightly increased, by 1, 36% (4 cases per 100 thousand people). The most significant reduction effect was provided by the “theft” indicator - a decrease of 63 cases per 100 thousand people (13.86%). The city of Moscow is also included in this group (CSI is 89.68%), which has the highest average annual population. In 2016, the number of crimes related to drug trafficking increased significantly by 41.31% (38 cases per 100 thousand people), while the rate of “crimes in the economy” remained unchanged - 65 cases per 100 thousand people. The number of other types of crimes reduced, but it was small in the total mass of recorded crimes.
The group with a “high” crime severity index included six constituent subjects of the Russian Federation: the Republic of Tyva, the Kamchatka Territory, the Republic of Chechen, the Sakhalin region, the Republic of Dagestan and the Voronezh region, which are located according to increase in CSI from 100.77% to 109.56%. CSI values> 100% indicate that the cumulative crime severity increased in 2016 compared with the same indicator in 2011.
This type of analysis allows for a more detailed analysis of problem sides in the field of crime in each subject of the Russian Federation and to direct the activities of law enforcement agencies directly to the fight against specific acts.
Social phenomena, including crime, are the result of the simultaneous influence of a large number of factors. Therefore, when studying these phenomena, it is necessary to identify the main ones, abstracting from the secondary ones. To study the factors of crime, a model was constructed in the form of a linear multiple regression equation, which is an analytical form of the actual dependence of the modeled indicators on various factors.
As noted above, individual factors influence crime indirectly, through complex interweaving with other factors, often indirect, secondary, and therefore not taken into account in the process of conducting a pair analysis. Multiple regression analysis allows simulating the entire system of factorial links of crime and quantifying the role of individual factors determining its level.
To analyze the impact on the crime rate, expressed as the number of recoded crimes per 100 thousand people in the region’s population, who have reached the age of criminal responsibility, factors (Xn) were selected.
As is known, in the real statistical aggregate there are often cases that are significantly different from the main body in the value of the feature being studied and lead to a distortion of research results. Anomalous observations were excluded at the initial stage of the study using a robust estimation.
After eliminating the outlining cases (in the aggregate there is one abnormally high observation - the Republic of Tyva, in which the indicator “number of recorded crimes per 100,000 people” is equal to 3442 cases), the totality becomes more homogeneous. The study will involve the remaining 84 subjects of the Russian Federation.
A matrix of paired correlation coefficients was constructed. It allowed revealing the presence of multicollinearity and analyzing the relationship between the resultant and factorial signs (Table 05).
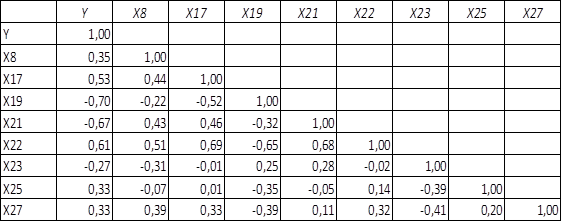
Source: authors, based on official data of the Federal State Statistics Service. Access mode: http://www.gks.ru
Note that the number of recorded crimes per 100 thousand people is most closely associated with such indicators as:
Life expectancy of men at birth (years), the coefficient of pair correlation is -0.70, a strong inverse correlation;
Overall marriage rate per 1000 population (%),the coefficient of pair correlation is -0.67, a strong inverse correlation;
Total divorce rate per 1000 population (%),the coefficient of pair correlation is 0.61, a strong direct correlation;
Sale of alcoholic beverages per capita (l), the coefficient of pair correlation is 0.53, a strong direct correlation.
There is an average relationship between the other factors and the performance indicator in the range of │0,25-0,5│.
The carried out crime rate modelling allows deriving the multiple regression equation:
= 6956,85 – 97,89*Х19 – 150,23*Х21.
The resulting model is reliable at 62.7% (according to the adjusted multiple coefficient of determination), while with a probability of 95.0%, the variation in the number of recorded crimes per 100 thousand people of the population by 65.6% is explained by the variation of factors X19 and X21 included in the model , and by 34.4% - a variation of other factors unaccounted for in the model. Statistically reliable, according to the Fisher criterion, the obtained regression coefficients are significant by Student t-test.
Economic-statistical interpretation of the conducted modelling of the entire factorial links of crime and a quantitative assessment of the role of individual factors determining its level:
With an increase in the life expectancy of men at birth for 1 year, the number of recorded crimes per 100 thousand people decreases by 98 cases.
At the beginning of the study, it was found out that 85.4% of crimes are committed by males. Most often the age of a criminal is 30-49 years old, and people over 50 years old do not so often commit criminal acts. As a result, it can be argued that the older a male is, the more deliberate his actions and he commits crimes less frequently.
With an increase in the overall marriage rate per 1000 people of the population by 1 percentage point the number of recorded crimes per 100 thousand people is reduced by 150 cases.
Marriage is a deliberate step that requires a person to be willing to bear responsibility towards his marriage partner and future children. Emerging responsibilities that mean taking care of a loved one and the fear of losing him make them more thoughtful about their actions and live in harmony with the law.
As a result of the simulation, the factors that influence the emergence and development of crime are partially identified. However, the resulting model explains 63% of the influence of the identified factors on the number of recorded crimes per 100 thousand people. It is worth noting that the consideration of new sources of departmental information, allow giving a comprehensive assessment of the territorial differentiation of crime in the Russian Federation.
Conclusion
The analysis of average crime rates in the Russian Federation over five years for 1961-2016 shows that the average crime rate for the analyzed period is markedly different (upward) in the 90s and early 2000s, reaching its peak in 2008-2010 (financial crisis of 2008), then the economic situation stabilizes, and in 2016 the average crime rate reached the level of the period of the collapse of the USSR. So in 2016, the indicator of the number of crimes per 100 thousand people was equal to 1,471 recorded crimes, and in 1991 - 1,463 cases, the difference is only 8 cases, and the time span includes 16 years.
The structural analysis of recorded crimes by types suggests that in 2011 and in 2016, the largest share was accounted for by theft - 65% and 69%, respectively; crimes related to drug trafficking took the second place - 13% and 16%; the third place in the total number of recorded crimes was occupied by crimes in the economic sphere - 9% and 6%.
The analysis of the age structure revealed that crimes committed by older persons aged 30-49 years old (42% in 2011 and 48% in 2016) prevail. The second place in terms of ratio in 2011 by taken by persons aged 18-24 years old - 24%, and in 2016 - persons aged 25-29 years old and made up 19%. In 2016, 85% of crime cases were committed by males and in 65% of cases - by persons without a permanent source of income.
According to the crime severity index in 2016 compared to 2011, 4 groups of regions of the Russian Federation were identified: with “low”, “average”, “growing” and “high” crime severity. In 2016, a decrease in the aggregate crime severity index was observed in 77 regions (93%).
A system of statistical indicators is proposed, which includes factors affecting the crime rate in the regions of the Russian Federation. Using these factors, a simulation of the legal situation in the regions was carried out, which showed that in 66% the variation in the number of recorded crimes per 100 thousand people was explained by the variation of such factors as the increase in life expectancy for men at birth and the overall marriage rate per 1000 people. The remaining 34% of the change in the rate is explained by factors not considered in the simulation.
References
- Armstrong, G. S., Cain, C. M., Wylie, L. E., Muftić, L. R., & Bouffard, L. A., (2018). Risk factor profile of youth incarcerated for child to parent violence: A nationally representative sample. Journal of Criminal Justice, 58, 1- 9.
- Chistik, O.F. (1995). Evolution of forms of ownership in region economy: theory and experience. Samara, Russian Federation: Samara State Academy of Economics.
- Farrell, G., Tilley, N., & Tseloni, A. (2014). ‘Why the Crime Drop?’ Crime and Justice, 43, 421– 490.
- Flatley, J., Kershaw, C., Smith, K., Chaplin, R., & Moon, D. (2010). Crime in England and Wales 2009/10. Home Office Statistical Bulletin. UK: Crown Copyright, Home Office.
- Hill, R.C., Griffiths, W.E., & Lim, G.C. (2012). Principles of econometrics. Hoboken: John Wiley & Sons, Inc.
- Imangaliyev, N., & Hanov, T. (2015). Identity of the criminal and some questions of prevention of thefts. International magazine of experimental education, 5, 104-109.
- Inshakov, S.M. (2011). Theoretical bases of a research and analysis of latent crime. Moscow: YUNIT-DANA
- Kleymenov, I.M. (2012). Crime in the USA: tendencies, reasons, measures and counteractions. Bulletin of the Omsk university, 1, 115-119.
- Kvashis, V.E., & Heinrich, N.V. (2013). Crime in Russia and foreign countries: methodological aspects of the comparative analysis. Prologue: the magazine about law, 4, 23-31.
- Kvashis, V.E., Genrikh, N.V., Kamalova, A.K., & Morozov, N.A. (2013). The Russian crime in a mirror of the international statistics. The Scientific portal of the Ministry of Internal Affairs of the Russian Federation, 3, 41-49.
- Luneev, B.B. (2005). Crime of the XX century: global, regional and Russian trends. Мoscow: Volters Kluver
- Li, G., & Brunton-Smith, I. (2018). Crime-general and crime-specific spatial patterns: A multivariate spatial analysis of four crime types at the small-area scale. Journal of Criminal Justice, 58, 22-32. https://dx.doi.org/10.1016/j.jcrimjus.2018.06.003.
- Meshkova, L. (2013). Health of the nation as one of aspects of national security. Health of the nation and national security, 1, 345-348.
- Nazaretian, Z., & Marolla, D. (2013). Questioning Canadian Crime Incident Rates. Canadian Journal of Criminology and Crime Justice, 55, 239 – 61.
- Rocque, M., & Snellings, Q. (2018). The new disciplinology: Research, theory, and remaining puzzles on the school-to-prison pipeline. Journal of Criminal Justice, 59, 3-11.
- Studenmund, A.H. (2014). Using Econometrics: A Practical Guide. Harlow, Essex, UK: Pearson.
- Volkonskaya, E.M. (2014). Current trends of crime. Bulletin of the Voronezh institute of the Ministry of Internal Affairs of the Russian Federation, 14, 63 – 68.
- Walby, S., Towers, J., & Francis, B. (2016). Is Violent Crime Increasing or Decreasing? New Methodology to Measure Repeat Attacks Making Visible the Significance of Gender and Domestic Relations. The British Journal of Criminology, 56(6), 1203–1234, https://dx.doi.org/10.1093/bjc/azv131.
Copyright information

This work is licensed under a Creative Commons Attribution-NonCommercial-NoDerivatives 4.0 International License.
About this article
Publication Date
20 March 2019
Article Doi
eBook ISBN
978-1-80296-056-3
Publisher
Future Academy
Volume
57
Print ISBN (optional)
-
Edition Number
1st Edition
Pages
1-1887
Subjects
Business, business ethics, social responsibility, innovation, ethical issues, scientific developments, technological developments
Cite this article as:
Chistik, O., Blinova, S., & Merkushova, N. (2019). Statistical Approach To The Research Of Crime In The Russian Federation. In V. Mantulenko (Ed.), Global Challenges and Prospects of the Modern Economic Development, vol 57. European Proceedings of Social and Behavioural Sciences (pp. 1193-1204). Future Academy. https://doi.org/10.15405/epsbs.2019.03.121