
Deficit Of Executive Cognitive Functioning In Adolescents Showing Signs Of Deviant Behavior


Abstract
The adolescence is known to be accompanied by an increased rate of risky, asocial and delinquent behavior collectively referred as deviant behavior. The present work addresses the question of whether this increase in a deviant behavior in adolescents is related to a deficit in basic components of executive functions such as ability to sustain and focus attention as well as suppress irrelevant information. We conducted an experiment in which these basic components of executive functions were compared for two groups: a target group (D-group) of adolescents showing signs of deviant behavior (58 participants including 32 males and 26 females), and a control group (C-group) of adolescents showing typical developmental profile (58 participants including 46 males and 12 females). All participants first completed Achenbach checklist to assure correctness of their assignment to a particular group. Then the Raven's Progressive Matrices test was administered to estimate non-verbal intellect. Finally, executive functions were scored with the computerized versions of Stroop Color and Word Test, Bourdon-Wiersma test, two-colored Schulte-Gorbov tables test. The data of all there computerized test showed that adolescents from D group demonstrated poorer performance (committed more errors and showed slower performance) as compared to their peers from C group. The results suggest that weakness/disruption of executive functions is tightly related to signs of deviant behavior and support the view that there might be a causal relationship between the former and the latter.
Keywords: Adolescencedeviant behaviorexecutive functions
Introduction
In public opinion as well as among professionals, adolescence (12 – 17 ages) is frequently associated with negative changes in behavior such as avoiding any activities that require persistent efforts; impulsiveness; elevated emotional lability, sometimes to the extent of showing signs of aggressiveness, inclination to making unreasonable, bad and risky decisions; refusal to follow social norms. These "achievements" of adolescence results in a growing risk of causing a health harming; besides, chances of negative social consequences grow because of conflicts with pears or adults and criminal actions, i.e. those behavioral patterns that are referred to as deviant behavior.
Despite intensive studies of individual traits of behavior and cognitive development during adolescence (Casey, 2015, review) the question of why this developmental period is accompanied by increased risk of deviant behavior remains open. A scientific analysis of this phenomenon faces an apparent contradiction between progressive age-related changes in executive functions and underlying brain mechanisms of the latter (Klingberg, Forssberg & Westerberg, 2002; Blakemore & Choudhury, 2006; Karn, Isbell, Giuliano & Neville, 2015; Vinette & Bray, 2015), on the one hand, and a reduced ability for self-control, on the other hand (Cauffman, Steinberg & Piquero, 2005; Spear, 2000; Steinberg, 2010).
Psychological studies suggest that adolescents showing signs of deviant behavior differ from their typically developing peers primarily by impairment of motivational regulation which underlies goal-directed activities. In these adolescents, the deviant behavior frequently manifest itself in the asocial or even delinquent motives and in choosing inappropriate means to achieve their goals (Kornilova, Grigirenko & Smirnov, 2005; Mendelevich, 2005; Il’in, 2012). Experimental studies show that delinquent behavior in adolescents is frequently accompanied by excessive risk-taking (Van Leijenhorst, Zanolie, Van Meel, Westenberg, Rombouts & Crone, 2010; Cservenka, Herting, Seghete, Hudson & Nagel, 2013) and avoidance of those activities that, require sustained and prolonged effort known as delay aversion (Moreira, Jupp, Belin & Dalley, 2015). In favor of the view that the disorder of motivational regulation constitutes one of the causes of deviant behavior are the data of neurophysiological studies on non-optimal state of fronto-basal (Galvan, Hare, Parra, Penn, Voss, Glover & Casey, 2006; Ernst, Pine &Hardin, 2006; Casey, Jones &Hare, 2008; Bjork, Smith, Chen & Hommer, 2010) and limbic (Arain, Haque, Johal, Mathur, Nel, Rais & Sharma, 2013; Semenova & Machinskaya, 2015) brain structures. At the same time, numerous studies suggest that suboptimal/disrupted emotional regulation is not likely the sole cause of adolescent deviant behavior. Yet another determinant for this kind of behavior is disruption of executive cognitive functioning in the adolescents (Muscatello, Scimeca, Pandolfo, Mico, Romeo, Mallamace & Bruno, 2014; Paschall &Fishbein, 2002). According to several researchers (Pokhrel, Herzog, Black, Zaman, Riggs & Sussman, 2013; Yurgelun-Todd, 2007), it is the relative immaturity of the prefrontal cortex that causes «weakness» of executive functions is the major cause for the observed behavioral problems in adolescents. However, one might ask the following question: Why not all the adolescents show signs of deviant behavior if the age-related immaturity of the brain is indeed the primary cause of that kind of behavior? Some researchers (Galvan et al., 2006; Steinberg, 2010; Somerville & Casey, 2010; Somerville, Jones & Casey, 2010; Casey, 2015) suggest that deficit of executive functions in adolescents is a secondary effect, which in turn is caused by disruption of the balance between activity of the frontal cortex and subcortical brain structures affected by changes in hormonal status. According to these researchers, critical for showing deviant behavior is suboptimal (due to immaturity or disruption) activity balance between the frontal cortex and subcortical structures involved in motivational regulation, not mere increase or decrease in the activity of these parts of the brain.
In order to explore an impact of the primary functional deficit of the frontal cortex onto the risk of deviant behavior in adolescence it seems reasonable to compare between the state of the basic components of the executive functions in adolesents who show signs of deviant behavior and those who do not. This comparison is assumed to be made based only on the performance scores of those cognitive tasks with minimal involvement of the processes of motivational regulation.
Problem Statement
There is no consensus among researchers regarding what causes the lack of self-control in adolescents. Frequently, a deficit of executive functions is considered most probably to underlie this lack of self-control. However, the assumption of "weakened" executive functions is hardly compatible with known progressive changes in executive cognitive functioning during adolescence. Some researchers suggest that reported deficit of executive functions in adolescents who show signs of deviant behavior might be a secondary effect caused in turn by disruption of emotional and motivational regulation. Thus, the major problem that is addressed in the present work is whether suboptimal state of executive functions directly contributes to behavioral problems in adolescents.
Research Questions
We addressed the following questions. First, we are interested if there are any differences in cognitive control, selective attention and the ability to sustain attention between adolescents with deviant behavior and those showing typical development? Second, if such differences do exist, which of the above cognitive abilities suffer most in adolescents with deviant behavior?
Purpose of the Study
The present study was aimed at evaluating basic components of executive functions in a group of adolescents who showed signs of deviant behavior and compare the results with those obtained in a control group of adolescents.
Research Methods
A total of 116 adolescents aged from 13 to 16 with no history of neurological or psychiatric disorders participated in the study. A half of them (58 participants including 32 males and 26 females) belong to control group (CG) with mean age of 14.6 years. The remaining participants (58 participants including 46 males and 12 females) belong to the target group (DG) with mean age of 13.4 years. These adolescents were recruited from attendants of the Moscow suburb municipal center providing educational, psychological and medical assistance for adolescents showing signs of asocial and/or delinquent behaviour.
All the participants as well as their parents gave written informed consent for the study.
In order to assess the extent of deviant behavior we used Russian version of Youth Self-Report (YSR) from Achenbach System of Empirically Based Assessment (ASEBA) for school-age children (Achenbach, 1991). This questionnaire includes 113 statements, and uses following scales for scoring: Withdrawn/Depressed, Somatic Complaints, Social Problems, Thought Problems, Attention Problems, Rule-Breaking Behavior, Anxious/Depressed, and Aggressive Behavior. In this paper, we analyzed all scales except Somatic Complaints.
Non verbal intelligence was assessed with a computerized version of Raven's Progressive Matrices [RPM, Raven, 2003]. We used 10.1 inches touch screen DIGMA CITI 1803 tablet computer running Microsoft Windows 10 operating system. This version of the test includes 5 blocks of trials, with 12 trials in each. In each trial, a geometrical pattern with a missing piece was shown. At the same time, a participant was given 6 choices for filling in the missing piece. All the choices made by a participant were recorded along with the response times. These data were then used to calculate the major RPM scores: the number of correct responses and the per minute response rate.
In order to score the state of executive functions, we used three computerized versions of the following tasks: (1) two-colored Schulte-Gorbov tables (Gorbov, 1971), (2) a letter-based variant of Dot cancellation test, also known as Bourdon-Wiersma test, widely used by Russian neuropsychologists (Druzhinin & Ushalov, 2002), and (3) Stroop task (Stroop, 1935; Scarpina & Tagini, 2017).
The computerized version of two-colored Schulte-Gorbov tables consists of five subtests. In each subtest, a 2-dimensional 5-by-4 table was shown on the 10.1 inches touch screen of a DIGMA CITI 1803 tablet computer running Microsoft Windows 10 operating system. This 5-by-4 table is filled in with a set of 10 black-inked numbers ranged from 1 to 10 and a similar set of red-inked numbers, all 20 numbers being randomly assigned to the cells of the table. The participants were asked to search for a subtest-specific sequence of numbers and point to each found number by touching a corresponding tablet's cell. In the first two subtests, the participants were asked to point to black-inked (subtest 1) and red-inked (subtest 2) numbers in ascending order. In the 3rd subtest, the participants had to point to the black-inked numbers in the reversed order. The 4th subtest, the most difficult, required an ascending order of pointing to black-inked and red-inked numbers pairs, with black first and red second ("black one", "red one", "black two", "red two", etc.). In the 5th subtest, the participants had to name the red-inked number in the reversed order.
Separately for each subtest, we calculated the number of errors of several kinds (omissions, color and order errors, and response repetitions) along with overall number of errors. An average search time (in seconds) was also computed.
We used a computerized version of Bourdon test for children (Akhutina, Kremlyov, Korneev, Matveeva & Gusev, 2017). This version consists of three subtests in each of which a participant is presented with a 16-by-12 table filled in with 7 different Cyrillic letters which appeared with approximately equal frequency. In the subtest 1 and 2, a participant was asked to point to all "K" and "C" letters, respectively, while in the 3rd subtest the task was to point to all occurrences of both letters.
Separately for each subtest, we used the following scores: (1) accuracy which is computed as a difference between the frequency of correct responses and frequency of false alarms and (2) rate which is the number of letters processed in a minute.
A computerized version of Stroop test includes three subtests. In each subtest, a participant was asked to react to a color of a target stimulus by pressing as quick as possible a key assigned to the color. Four functional keys (F5 through F8) were assigned to four different colors (red, yellow, green, and blue) used in the version of the test. In the first subtest, a participant was shown words naming the same color which was used to type them. Thus no stimuli with conflicting features were shown in this subtest. In the second subtest a four-X pattern, XXXX, with differently colored X, was shown.
The third subtest was similar to the first one, but the font color did not match the meaning of the color naming word, and thus corresponded to the conflicting condition. In all the subtests, participants made their responses by pressing a proper functional on the external keyboard attached to the tablet computer. The following color-coding map was used: F5 – red, F6 – yellow, F7 – green, F8 – blue.
For each subtest, we calculated a number of errors and a total time required to complete the subtest. Analysis of variance was used to test statistical hypotheses.
Findings
Achenbach checklist
The scores computed after processing the Achenbach checklist data both C and D groups are shown in Table
As it is seen from the Table
Raven's Progressive Matrices (RPM)
A comparison RPM scores in D and C groups showed the following results. Compared to their peers from C group, the adolescents from the target group D showed lower average number of correct answers (36.966 (9.069) vs. 44.914 (7.057)) but higher per minute response rate (5.744 (2.956) vs. 4.690 (1.921)).
As One-way ANOVA with GROUP (C, D) as a factor showed these between-group differences turned out to be statistically significant for both variables, the number of correct answers (F(1, 114) = 27.750, p < 0.001, ² = 0.196) and the per minute response rate (F(1, 114) = 5.179, p < 0.025, ² = 0.043).
Executive functions
Bourdon test
The mean over subtests values of Accuracy and Rate are shown in Figure
It is clearly seen from the Figure
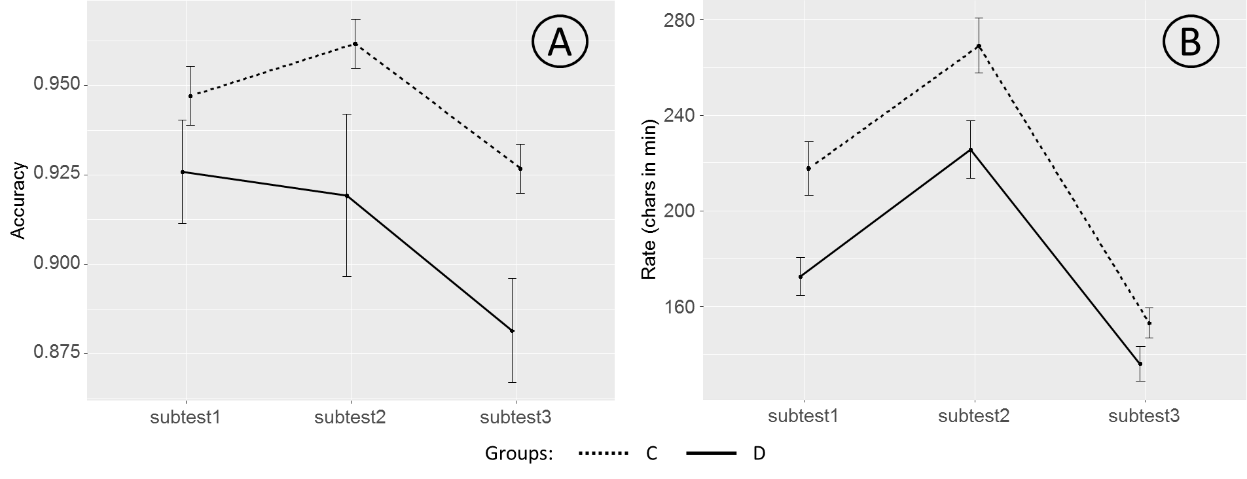
A repeated measure analysis of variance (rmANOVA) with SUBTEST (1, 2, 3) as a within-subject factor and GROUP (C, D) as a between-subject factor was conducted for both Accuracy and Rate scores. This analysis showed a significant effect of the SUBTEST factor onto both Accuracy (F(2, 113) = 6.916, p = 0.001, ² = 0.109) and Rate (F(2, 113) = 158.981, p < 0.001, ² = 0.738) variables. The GROUP factor also showed a significant effect for both variables, Accuracy (F(1, 114) = 6.615, p = 0.011, ² = 0.055) and Rate (F(1, 114) = 8.201, p = 0.005, ² = 0.067).
The SUBTEST-by-GROUP interaction was significant for the Rate (F(2, 113) = 5.188, p = 0.007, ² = 0.084) but not for the Accuracy variable (F(2, 113) = 1.004, p = 0.370, ² = 0.017).
Stroop test
The data of three participants from group D were excluded from the analysis because these adolescents did not follow the instruction in the third subtest.
The average number of errors and mean time of test completion are shown in Figure
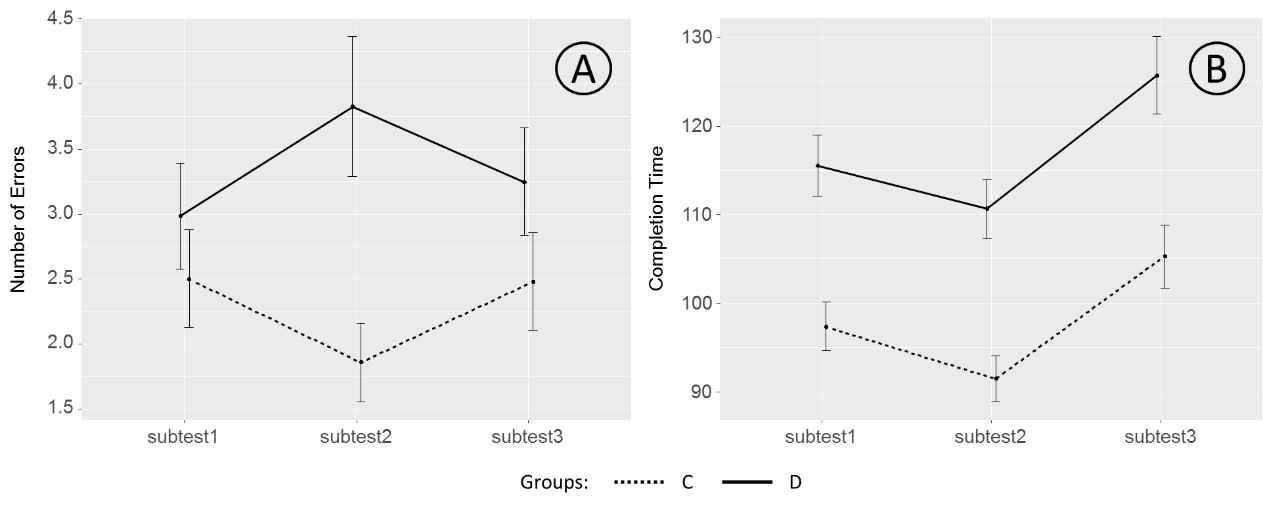
Figure
These observations are supported by the results of statistical tests. A rmANOVA with SUBTEST (1, 2, 3) as a within-subject factor and GROUP (C, D) as a between-subject factor was conducted separately for mean number of errors and completion time variables. This analysis showed a significant main effect of the SUBTEST factor onto completion time (F(2, 110) = 39.290, p < 0.001, ² = 0.417), but no such effect was found for the number of errors (F(2, 110) = 0.054, p = 0.947, ² = 0.001). At the same time, the main effect of the GROUP factor was found for both error rate (F(1, 111) = 7.653, p = 0.007, ² = 0.065) and completion time (F(1, 111) = 19.137, p < 0.001, ² = 0.147). A SUBTEST-by-GROUP interaction was significant for neither error rate (F(2, 110) = 2.209, p = 0.115, ² = 0.039), nor the test completion time (F(2, 110) = 0.211, p = 0.810, ² = 0.004).
Two-colored Schulte-Gorbov tables
The data of three adolescents from group D were excluded from the analysis since these participants did not follow the instruction in the subtest 4.
In figure
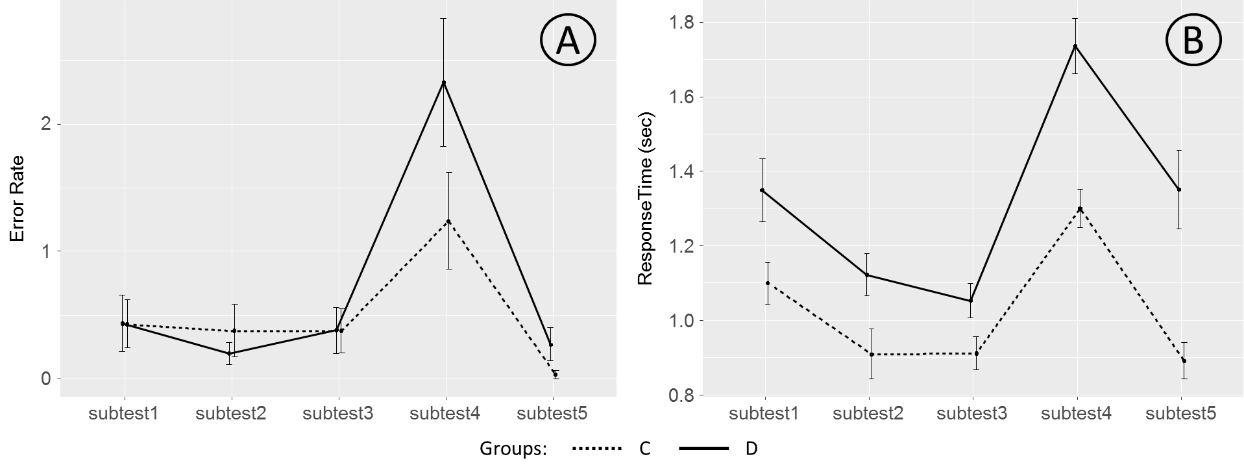
It is seen from the figure
A rmANOVA with SUBTEST (1 through 5) as a within-subject factor and GROUP (C, D) as a between-subject factor was conducted separately for mean error rate and response time variables. This analysis revealed a significant impact of the SUBTEST factor onto both error rate (F(4, 108) = 7.392, p < 0.001, ² = 0.215) and response time (F(4, 108) = 48.634, p < 0.001, ² = 0.643) variables. The main effect of the GROUP factor was found for the response time (F(1, 111) = 21.729, p < 0.001, ² = 0.164) but not for the error rate (F(1, 111) = 1.519, p = 0.220, ² = 0.013). Similarly, SUBTEST-by-GROUP interaction was found significant for response time (F(4, 108) = 4.440, p = 0.002, ² = 0.141) but did not reach a significance level for error rate (F(4, 108) = 1.239, p = 0.299, ² = 0.044).
An additional analysis of error rates of different types (omissions, color and order errors, and response repetitions) showed that the only significant difference between two groups of adolescents was limited to the repetition rates (F(1, 111) = 4.305, p = 0.040, ² = 0.037), with adolescents from the target group committing more errors of this kind comparing the adolescents from the control group.
The results reported above are in general agreement with previous findings. Thus, similarly to what is found in the present study, a significant correlation between Schulte-Gorbov test scores and integral score for executive functions are observed in younger schoolchildren for the Rate variable in all subtests and additionally for Accuracy score in the most difficult 4-th subtest (Akhutina, Korneev & Matveeva, 2016). Also it has been reported earlier that accuracy in Bourdon test, the error rate in Schulte-Gorbov tables task and error rate in the Stroop test – all these variables correlate with the integral score for executive functions (Voronova, Lomakin & Kotova, 2017). These similarities support the suggestion that D-group adolescents showed poor performance relative to their counterparts from C-group because of weakness or disruption of executive functions.
So far, we have attributed the differences in scores measured in two groups, D and C, to the underdeveloped/weakened/disrupted execution functions. However, these two groups were not perfectly balanced with respect to age, and the age-mismatch could cause the difference in scores just because the executive functions are known to undergo a significant development during the adolescence (Blakemore & Choudhury, 2006).
To address this issue, we check whether age affects the measured scores in each group as well as in the whole sample of participants.
The scores computed for all the Achenbach checklist scales did not show any statistically significant correlation for neither the whole sample (p > 0.344), nor for the C (p > 0.120) or D (p >0.057) groups. This suggests that the group assignment has not been significantly affected by age.
Subjecting RPM scores to similar analysis showed that the number of correct responses did correlate with age in the whole sample (r =0.218, p = 0.019) seemingly because of the participants from the control group (r =0.269, p = 0.041). The response rate did not correlate with age (r = -0.039, p = 0.679).
Similar analysis of the data of Bourdon-Wiersma test showed that the performance rate in subtests 1 and 2 did correlate with age for the whole sample of participants (r =0.281, p = 0.002 and r =0.189, p = 0.043, respectively). Within two groups, this parameter did not reach a significant correlation with age (r < 0.234, p >0.076).
Thus, age might affect the response rate but not the number of errors in this test.
In Stroop test, we found a negative correlation of the performance time (time to complete the task) with age in subtests 1 and 2 (r =-0.217, p = 0.021 and r =-0.256 p = 0.006, respectively) when participant from both C and D groups were pooled together. However, no such correlations were found within groups for any subtest (all p > 0.175). Besides, no correlations were found between number of errors and age for any subtest (all p >0.292). The above pattern of correlations shows that there might be a moderate impact of age onto temporal parameters of the Stroop test performance, but the number of committed errors was hardly affected by age of participants.
Finally, an analysis of the scores measured in the two groups pooled together for two-colored Schulte-Gorbov tables showed significant correlations with age of both response time (r < -0.189, p < 0.046 across all 5 subtests) and number of errors in the subtest 4 (r =-0.189, p = 0.045) and subtest 5 (r =-0.245 p = 0.009).
When groups C and D were tested separately, the only age-related correlation were found in group C for the number of errors in subtest 4 (r = -0.304, p = 0.021) and for response time in subtest 2 (r = -0.305, p = 0.024). It follows from the above consideration that the scores for two-colored Schulte-Gorbov tables turned out to be most age-sensitive used in the present study. Therefore, these scores are not reliable in contrasting executive cognitive functioning in D and C groups of adolescents. Fortunately, the only significant between group difference in two-colored Schulte-Gorbov tables scores is limited to the completion time of the most difficult subtest 4, which, therefore, must not be used to differentiate between two groups of the adolescents.
Conclusion
The data we reported in this paper show that adolescents with signs of deviant behavior showed poorer performance in computerized versions of tests estimating core components of executive functions relative to their counterparts from the control group. The largest difference is observed for error rate and performance time scores in two tests: Bourdon-Wiersma test and Stroop Color and Word Test. This difference suggest a relative "weakness" of the functional components of executive functions which are scored with the two tests. In particular, the relatively low scores in Bourdon-Wiersma test found in adolescents with deviant behavior seem to point to a reduced ability to selectively focus and sustain attention in those adolescents. Similarly, an increased error rate and longer reaction time in Stroop test found in adolescents with deviant behavior suggest a reduced ability to suppress irrelevant information in those adolescents relative to their peers from the control group.
Thus, a preliminary conclusion that follows from the analysis of the data reported in the present study is that a deficit of executive functions might be a primary factor responsible for an elevated risk of deviant behavior in adolescents. However, we cannot exclude all together the impact of the lack of emotional and motivational regulation onto executive functions. Additional studies are required to resolve this issue.
Acknowledgments
The work was supported by Russian Foundation for Basic Research, project # 17-06-00837-OGN
References
- Achenbach, T. M. (1991). Manual for the youth self-report and 1991 profile. Burlington: Department of Psychiatry, University of Vermont.
- Akhutina, T. V., Korneev, A. A., & Matveeva, E. YU. (2016). Razvitie funkcij programmirovaniya i kontrolya u detej 7—9 let. Vestnik Moskovskogo universiteta. Seriya 14: Psihologiya, 1, 42–63. doi: 10.11621/vsp.2016.01.42 [in Russian]
- Akhutina T. V., Kremlyov A. E., Korneev A. A., Matveeva E. YU. & Gusev A. N. (2017). Razrabotka komp'yuternyh metodik nejropsihologicheskogo obsledovaniya. In E.V. Pechenkovoj & M.V. Falikman (Eds.) Kognitivnaya nauka v Moskve: novye issledovaniya. Materialy konferencii 15 iyunya 2017 (pp. 486–490) . Moscow OOO «Buki Vedi», IPPiP. [in Russian]
- Arain, M., Haque, M., Johal, L., Mathur, P., Nel, W., Rais, A., . . .& Sharma, S. (2013). Maturation of the adolescent brain. Neuropsychiatric Disease and Treatment, 9, 449-461. doi: 10.2147/NDT.S39776
- Bjork, J. M., Smith, A. R., Chen, G., & Hommer, D. W. (2010). Adolescents, Adults and Rewards: Comparing Motivational Neurocircuitry Recruitment Using fMRI. PLoS ONE, 5(7), e11440. doi: 10.1371/journal.pone.0011440
- Blakemore, S. J., & Choudhury, S. (2006). Development of the adolescent brain: implications for executive function and social cognition. Journal of Child Psychology and Psychiatry, 47(3‐4), 296-312. doi:10.1111/j.1469-7610.2006.01611.x
- Casey, B. J. (2015). Beyond simple models of self-control to circuit-based accounts of adolescent behavior. Annual review of psychology, 66, 295-319. doi: 10.1146/annurev-psych-010814-015156
- Casey, B. J., Jones, R. M., & Hare, T. A. (2008). The adolescent brain. Annals of the New York Academy of Sciences, 1124(1), 111-126. doi: 10.1196/annals.1440.010
- Cauffman, E., Steinberg, L. & Piquero, A. R. (2005) Psychological, neuropsychological and physiological correlates of serious antisocial behavior in adolescence: the role of self-control. Criminology, 43, 133-176. doi: 10.1111/j.0011-1348.2005.00005.x
- Cservenka, A., Herting, M. M., Seghete, K. L. M., Hudson, K. A., & Nagel, B. J. (2013). High and low sensation seeking adolescents show distinct patterns of brain activity during reward processing. Neuroimage, 66, 184-193. doi: 10.1016/j.neuroimage.2012.11.003
- Druzhinin, V. N., Ushakov, D. V. (2002) Kognitivnaya psihologiya. Uchebnik dlya vuzov. Moscow, Per Se. [in Russian]
- Ernst, M., Pine, D. S., & Hardin, M. (2006). Triadic model of the neurobiology of motivated behavior in adolescence. Psychological medicine, 36(3), 299-312. doi: 10.1017/S0033291705005891
- Galvan, A., Hare, T. A., Parra, C. E., Penn, J., Voss, H., Glover, G., & Casey, B. J. (2006). Earlier Development of the Accumbens Relative to Orbitofrontal Cortex Might Underlie Risk-Taking Behavior in Adolescents. The Journal of Neuroscience, 26(25), 6885-6892. doi: 10.1523/jneurosci.1062-06.2006
- Gorbov F.D. (1971) Determinaciya psihicheskih sostoyanij. Voprosy psihologii, 5, 20-29 [in Russian]
- Il'in E.P. (2012) Psihologiya riska. Saint-Petersburg, Piter [in Russian]
- Karns, C. M., Isbell, E., Giuliano, R. J., & Neville, H. J. (2015). Auditory attention in childhood and adolescence: An event-related potential study of spatial selective attention to one of two simultaneous stories. Developmental cognitive neuroscience, 13, 53-67. doi: 10.1016/j.dcn.2015.03.001
- Klingberg, T., Forssberg, H., & Westerberg, H. (2002). Increased brain activity in frontal and parietal cortex underlies the development of visuospatial working memory capacity during childhood. Journal of cognitive neuroscience, 14(1), 1-10. doi: 10.1162/089892902317205276
- Kornilova T. V., Grigorenko E. L., Smirnov S. D. (2005) Podrostki grupp riska. Saint-Petersburg, Piter [in Russian]
- Moreira, F. A., Jupp, B., Belin, D., & Dalley, J. W. (2015). Endocannabinoids and striatal function: implications for addiction-related behaviours. Behavioural Pharmacology, 26(1 and 2 - Special Issue), 59-72. doi: 10.1097/fbp.0000000000000109
- Mendelevich V. D. (2005) Psihologiya deviantnogo povedeniya. Saint-Petersburg, Rech [in Russian]
- Muscatello, M. R., Scimeca, G., Pandolfo, G., Mico, U., Romeo, V. M., Mallamace, D., . . . Bruno, A. (2014). Executive functions and basic symptoms in adolescent antisocial behavior: a cross-sectional study on an Italian sample of late-onset offenders. Compr Psychiatry, 55(3), 631-638. doi: 10.1016/j.comppsych.2013.11.015
- Paschall, M. J., & Fishbein, D. H. (2002). Executive cognitive functioning and aggression: A public health perspective. Aggression and Violent Behavior, 7(3), 215-235. doi: 10.1016/S1359-1789(00)00044-6
- Pokhrel, P., Herzog, T. A., Black, D. S., Zaman, A., Riggs, N. R., & Sussman, S. (2013). Adolescent Neurocognitive Development, Self-Regulation, and School-Based Drug Use Prevention. Prevention science : the official journal of the Society for Prevention Research, 14(3), 218-228. doi: 10.1007/s11121-012-0345-7
- Raven J. (2003) Raven Progressive Matrices. In: McCallum R.S. (eds) Handbook of Nonverbal Assessment. Springer, Boston, MA doi: 10.1007/978-1-4615-0153-4_11
- Scarpina, F., & Tagini, S. (2017). The Stroop color and word test. Frontiers in psychology, 8, 557. doi: 10.3389/fpsyg.2017.00557
- Semenova, O. A., & Machinskaya, R. I. (2015). The influence of the functional state of brain regulatory systems on the efficiency of voluntary regulation of cognitive activity in children: II. neuropsychological and EEG analysis of brain regulatory functions in 10–12-year-old children with learning difficulties. Human Physiology, 41(5), 478-486. doi: 10.1134/S0362119715050126
- Somerville, L. H., & Casey, B. J. (2010). Developmental neurobiology of cognitive control and motivational systems. Current opinion in neurobiology, 20(2), 236-241. doi: 10.1016/j.conb.2010.01.006
- Somerville, L. H., Jones, R. M., & Casey, B. J. (2010). A time of change: behavioral and neural correlates of adolescent sensitivity to appetitive and aversive environmental cues. Brain and cognition, 72(1), 124-133. . doi: 10.1016/j.bandc.2009.07.003
- Spear, L. P. (2000). The adolescent brain and age-related behavioral manifestations. Neuroscience & Biobehavioral Reviews, 24(4), 417-463. doi: 10.1016/S0149-7634(00)00014-2
- Steinberg, L. (2010). A dual systems model of adolescent risk‐taking. Developmental psychobiology, 52(3), 216-224. doi: 10.1002/dev.20445
- Stroop, J. R. (1935). Studies of interference in serial verbal reactions. Journal of experimental psychology, 18(6), 643. doi: 10.1037/h0054651
- Van Leijenhorst, L., Zanolie, K., Van Meel, C. S., Westenberg, P. M., Rombouts, S. A., & Crone, E. A. (2010). What motivates the adolescent? Brain regions mediating reward sensitivity across adolescence. Cereb Cortex, 20(1), 61-69. doi: 10.1093/cercor/bhp078
- Vinette, S. A., & Bray, S. (2015). Variation in functional connectivity along anterior-to-posterior intraparietal sulcus, and relationship with age across late childhood and adolescence. Developmental cognitive neuroscience, 13, 32-42. doi: 10.1016/j.dcn.2015.04.004
- Voronova, M.N., Lomakin, D.I., and Kotova, E.V. (2017). Ispol'zovanie komp'yuternyh metodik v ocenke sostoyaniya upravlyayushchih funkcij mozga u podrostkov. In Lurievskij podhod v mirovoj psihologicheskoj nauke: V Mezhdunarodnyj Kongress pamyati A.R. Luriya (sbornik tezisov) (pp. 36–36). Izd-vo Ural'skogo universiteta, Ekaterinburg. [in Russian]
- Yurgelun-Todd, D. (2007). Emotional and cognitive changes during adolescence. Current opinion in neurobiology, 17(2), 251-257. doi: 10.1016/j.conb.2007.03.009
Copyright information

This work is licensed under a Creative Commons Attribution-NonCommercial-NoDerivatives 4.0 International License.
About this article
Publication Date
23 November 2018
Article Doi
eBook ISBN
978-1-80296-048-8
Publisher
Future Academy
Volume
49
Print ISBN (optional)
-
Edition Number
1st Edition
Pages
1-840
Subjects
Educational psychology, child psychology, developmental psychology, cognitive psychology
Cite this article as:
Machinskaya, R., Kurgansky, A., Korneev, A., & Lomakin, D. (2018). Deficit Of Executive Cognitive Functioning In Adolescents Showing Signs Of Deviant Behavior. In S. Malykh, & E. Nikulchev (Eds.), Psychology and Education - ICPE 2018, vol 49. European Proceedings of Social and Behavioural Sciences (pp. 368-379). Future Academy. https://doi.org/10.15405/epsbs.2018.11.02.40