Deficit Of Executive Cognitive Functioning In Adolescents Showing Signs Of Deviant Behavior
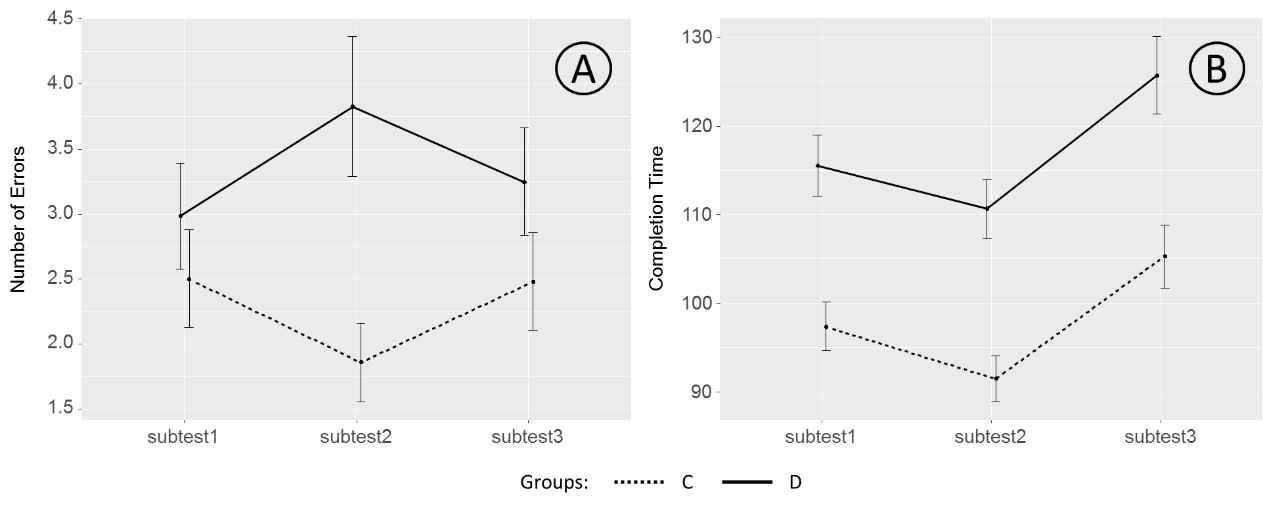
Figure 2: Mean number of errors (A) and completion time (B) for Stroop test in the target (D) and control (C) groups of participants. The experimental points for different subtests are connected with the solid and dotted lines for the target and control groups, respectively. Error bars correspond to the standard error of the mean.