Deficit Of Executive Cognitive Functioning In Adolescents Showing Signs Of Deviant Behavior
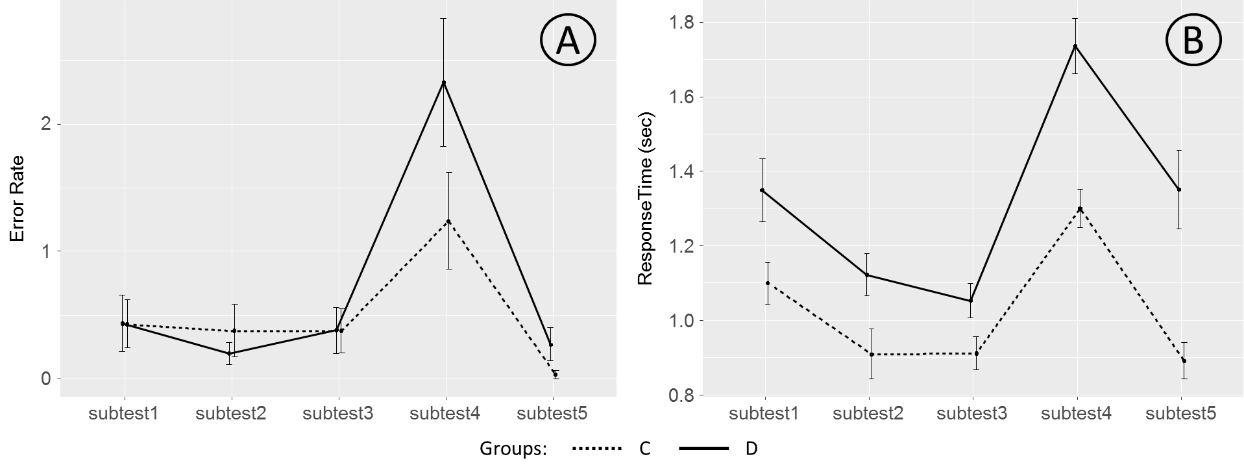
Figure 3: Mean error rate (A) and mean response time (B) for Two-colored Schulte-Gorbov tables in the target (D) and control (C) groups of adolescents. The experimental points for different subtests are connected with the solid and dotted lines for the target and control groups, respectively. Error bars correspond to the standard error of the mean