
Developing Databank as an Instrument for the Elder People Wellbeing Analysis


Abstract
Recent researchers succeed in well-being measuring of elder people life. Russian scientists have to run after the leaders investigating the official statistics data and analyzing the trends of indices. Within the project in Evaluation and enhancement of social, economic and emotional wellbeing of older adults we designed the model of older generation well-being measuring and the database to calculate objective and subjective indices according to this model. This paper is focused on the database created to elder people well-being research. The information system’ structure is subscribed. It is consisted of database and web-interface. Either the results of its application for elder people well-being assessing are presented. Using the information system we defined some trends in indices dynamics for Tomsk region at 2000 - 2013. We found the next results: the employed pensioners’ number increases significantly, the rural pensioners number is declining. The elder people’s availability for using IT grew from 5.56 per cent to 78 per cent of the respondents during 2007-2013. There is a positive dynamics in all analyzed social objects visiting availabilities for elder people. More than 80 per cent of respondents can visit medical clinic, department store, pharmacy and the bank office on foot. The social care and Pension Fund nearness is less.
Keywords: Well-being estimationelder peopleinformation systemdatabaseTomsk region
Introduction
During last 10 years the researchers’ interest for elder people wellbeing grows significantly. Methodology of surveys is large and incorporates such categories as welfare, life needs satisfaction, happiness, health, active aging and others listed at the economic literature on the factors associated with subjective well-being (Dolan, Peasgood, & White, 2008), and Veenhoven’s Database of Happiness (Veenhoven, 2016). Scientists involve economic and mathematic modeling, indices correlation, statistical datasets analysis to subscribe relations in economic growth, elderly people’s income, their employment, health, social and household activities, environment quality and wellbeing. These problems become very serious now because of population senescence of European countries, USA and also Russian Federation. Any governance begins from the current situation analysis.
There are a number of databases and reviews, which give a lot of measuring for analysis. The most known of them are:
– the Global Age Watch Index (AW),
– the Active Ageing Index (AAI),
– the OECD Better Life Index (BLI),
– OECD Regional Well-Being: A User’s Guide,
– the Eurostat Feasibility study for Well-Being Indicators.
We are to note that all these information systems allow getting information about well-being indices for state level but not for region. The data about Russia are presented in these bases incompletely without the elder people group allocation.
But this problem of elder people’s well-being is very important for Russian Federation because of the constant increase of pensioners and the declining of able-bodied people ratio in the population structure. Russian economy’s feature is the significant difference in regional indices of elder people’s well-being and it must be considered in any research. Economic Higher School researchers constructed the database of well-being in Russia but it includes population of all ages in conjunction. It helps to calculate the well-being indices for the country level but is inadequate for regional level: the number of elder people respondents living in the regions is too small to get the correct assessments in our problems. The accessed data in the Russian official statistics are not full.
Within the project in Evaluation and enhancement of social, economic and emotional wellbeing of older adults we designed the model of older generation well-being measuring and the database to calculate objective and subjective indices according to this model. This paper is focused on the database created to Tomsk region elder people life problems research. The structure of this database and its application results for Tomsk region elder people well-being are presented in this work.
Information System of elder people Well-being Analysis
Structuring model of elder people Well-being
The older generation’s well-being is actively researched by leading scientists (Bowling (1995), Murrell et al. (1999), McKenna et al. (1999), Carr, Gibson & Robinson (2001), Hyde et al. (2003), Alexandrova (2005), Cummins (2005), Easterlin (2006), Kahneman & Krueger (2006), Costanza et al. (2007)). The model of older generation well-being used in this paper is based on hierarchy of functions related to the management and life procurement support and includes two levels of impacts: system and practical. The overall holistic model of elderly population’s well-being was developed on the basic principles of system analysis approach and presented in the report for the 26th International Business Information Management Association Conference (Pavlova, Monastyrny & Gumennikov, 2015). The systemic approach integrates a number of both subjective and objective indicators calculated and presented in such databases and reviews as:
– the Global Age Watch Index (AW),
– the Active Ageing Index (AAI),
– the OECD Better Life Index (BLI),
– OECD Regional Well-Being: A User’s Guide,
– the Eurostat Feasibility study for Well-Being Indicators.
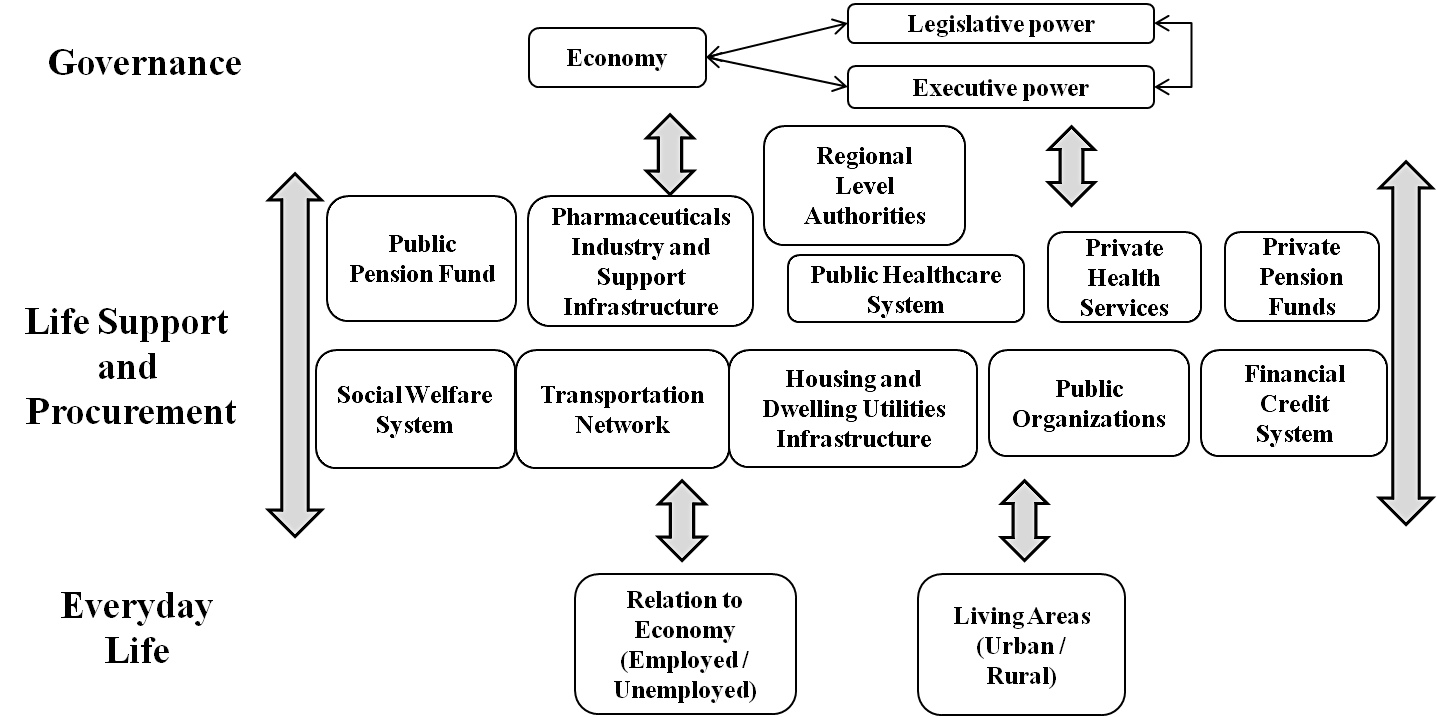
Invariant parts of the presented model are functions of governance and procurement support. The governance functions are performed by such structural elements of the system as the “Government” and the “Economy”, creating a balance between the desirable and the possible. The function of procurement support is performed by institutions and organizations, creating and supporting living environment for the elderly people. The variable part of the model is a social target group itself in a variety of individual characteristics, problems, needs and opportunities on the level of everyday life (Fig.1). This approach allows researching multiple target groups and generating modifications of the model, depending on the research goals.
The presented model serves as the base for the development of the information system database of elderly people well-being.
Databank designing
The database structure is developed according to the proposed model for estimation the population well-being. It includes:
1.Types of studying objects: «Government», «Provision», «Economy», «Retired households», «Near surroundings (friends and acquaintances)», «Other population» and the detailed descriptions (27 objects);
2. Needs and resources: «Health and physical activity», «Revenue», «Accommodation», «Growth», «Communications and social connections», «Social activity», «Leisure», «Mobility».
3. Indicators (45 source indicators plus calculating indicators).
4. Connections between objects, needs and resources, and indicators.
Our information system consists of database and web-interface.
Web-interface is the part of web-site http://statlwl.tpu.ru/. It allows to add data into the database and also to display data (the user need to login in order to have an access for database).
For creating the database we chose the database server MySql. For implementing the web-interface to the database and the methodologies for calculation the values of indicators we used PHP. And we also used Twitter Bootstrap on the client side of web-interface.
As for the web-interface, we have a certificate of registration of the computer program («The control program for database of indicators of well-being of older people», certificate of the Russian Federations’ state registration № 2015619013, authors: Barisheva G.A., Monastirnii Ye.A., Spitsin V.V., Shabaldina N.V., Gumennikov I.V.).
Physical model of the created database is shown on Figure
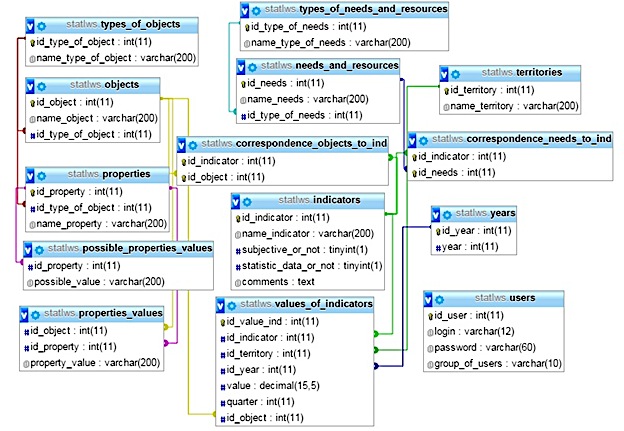
We filled the database based on the official statistics of well-being of older people that we’ve got from TomskStat (Pavlova et al., 2016). Created database contains 45 source indicators, it covers the time period from 2000 to 2013 years, and in the current step includes more than a thousand of values of the source indicators (1021 values). In addition to the source indicators, the created information system allows to generate different user requests and based on such a request to calculate automatically the values of calculating (not source) indicators (for example, there can be the growth rate for the specified year, the structure by objects, the ratio of the indicators). Having in mind these calculating indicators, one can assure that the quantity of the displaying data is much more than the number of values of indicators stored in database.
Results of information system applying for elderly people Well-being Analysis: case of Tomsk region
Examining the dynamics of basic indicators we found some trends in elder people’s well-being during last 12 years. Below we present the results for the three areas of research:
The structure dynamics of pensioners' number (dynamics of the share of employed pensioners and the share of rural pensioners)
The pensioners’ availability for social objects (medical, consuming, financial and social care).
The pensioners’ availability for IT-using (computer, internet).
Tomsk region elder people’s structure dynamics
The structure of pensioners in Tomsk region shows stable growth of employed persons ratio. The rise dynamics is reflected in the table
As we can see, a small recession of 2003 was changed by a stable increase since 2004 so the number of employed elder people was doubled during ten years. The pension amount in order to state laws was increased on 294 per cent, so we can presume that the elder people tried to rise their welfare.
At the same time, we are to state the decrease of rural pensioners’ number ratio in the Tomsk region’s elder people structure (Table
We can see that the number of rural pensioners is stable (increase for 0.2 per cent) for last twelve years but the whole number increased for 13.6 per cent. It means, in our opinion, that elder people left the countryside for towns joining to their children or other relatives. Above trend may be connected with the higher pension amount and social objects vicinity which is higher in big localities such as Tomsk and other towns of the region (Asino, Kolpashevo, Strejevoy and in lesser degree Kedroviy).
Tomsk region elder people’s social objects availabilities
We’ve realized some growth of social objects availability for pensioners, while assessing database indices. The interview is based on the interval assessments of pensioners living at Tomsk and in countryside. The dynamics is described at the Figures
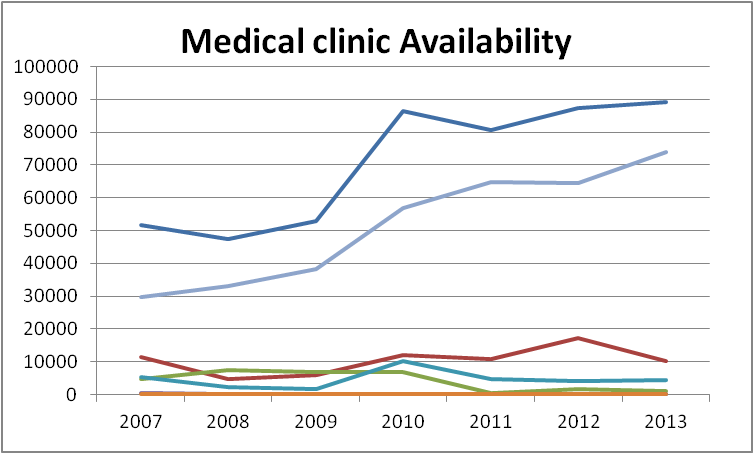
It is undoubted that the social objects moved nearer to pensioners of Tomsk region since 2007, so they can get the pharmacy, medical clinic, department store, social care service, bank office and Pension Fund in a shorter time on foot or by traffic less than a half hour. The respondents answered, that the grocery store was available on foot initially.
The dynamics can be traced in the Table
We can conclude that the Tomsk region officials tried to bring medicals and bankers closer to pensioners last seven years.
Tomsk region elder people’s IT - using
As for computer and internet usage, the elder people demonstrate the growing interest for these activities, which is subscribed at the Table
There were insignificant ratio of elder people using IT (PC and Internet) in 2007, but in 2013 their number reached 78 per cent.
Conclusions
During our research we successfully created and applied information system (consisting of database and web-interface) in assessments elder people’s well-being. Examining the dynamics of several basic indicators we defined some trends in elder people’s well-being in Tomsk region during last 7-12 years:
- the employed pensioners’ number is raising significantly from 24% in 2002 to 41.5% in 2013;
- the rural pensioners' number is declining from 40% in 2002 to 35% in 2013;
- the average availability for using IT is growing quickly;
- the average availability for visiting social objects is growing irregularly, but shows good ratio of nearness: for more than 80% respondents medical care, bank and department store could be reached on foot in 2013 instead of 57% in 2007. The social care and Pension Fund offices’ nearness is less: 47-57% in 2013 instead of 34% in 2007.
At the same time we faced with some difficulties:
Official statistics gives incomplete data in well-being measuring. We have no information about gender and age structure of pensioners and the only solution was to perform complementary interview.
There are no detailed subscriptions of information systems created to help in well-being measurements, so our research was performed particularly for Tomsk region, but it seems appropriate to use it for all regions of Russia
The next stage of research will be dedicated to creation of the instruments allowing to calculate indices including both subjective and objective data in order to verify their meanings.
Acknowledgements
This work was performed by the authors in collaboration with Tomsk Polytechnic University within the project in Evaluation and enhancement of social, economic and emotional wellbeing of older adults under the Agreement No.14.Z50.31.0029.
References
- AAI in Brief (2014). Active Ageing Index. United Nations Economic Commission for Europe. URL: http://www1.unece.org/stat/platform/display/AAI/I.+AAI+in+brief (Accessed: 15.03.2016).
- Alexandrova, A. (2005). Subjective well-being and Kahneman's 'objective happiness'. Journal of Happiness Studies, 6, 301-324.
- Bowling, A. (1995b). Measuring disease: a review of disease-specific quality of life measurement scales. Open University Press.
- Carr, A.J., Gibson,B.& Robinson, P.G.(2001). Is quality of life determined by expectations or experience? British Medical Journal, 332, 1240–1243.
- Costanza, R., et al. (2007). Quality of Life: An Approach Integrating Opportunities, Human Needs, and Subjective Well-being. Ecological Economics, 61. 2-3, 267-76.
- Cummins, R.A. (2005). Moving from the quality of life concept to a theory. Journal of Intellectual Disability Research, 49-10, 699-706.
- Dolan, P., Peasgood, T., & White, M. (2008). Do we really know what makes us happy? A review of the economic literature on the factors associated with subjective well-being. Journal of Economic Psychology, 29, 94-122.
- Easterlin, R. A. (2006). Life Cycle Happiness and its Sources. Intersections of Psychology, Economics, and Demography. Journal of Economic Psychology, 27.4, 463-82.
- EuroStat: Feasibility study Well-Being Indicators: Critical Review. URL: http://ec.europa.eu/eurostat/documents/118025/118135/Feasibility_study_Well-Being_Indicators.pdf/2475816b-9e4f-44e4-9ebf-2cd05762df77 (Accessed: 21.03.2016)
- Federal State Statistics Service: official website (2014). Official documents. URL: http://www.gks.ru/wps/wcm/connect/rosstat_main/rosstat/ru/about/credentials (Accessed: 11.03.2016) (in Russian).
- HelpAge International (2014), Global AgeWatch Index 2014: Insight report, summary and methodology. URL: http://www.helpage.org/global-agewatch/reports/global-agewatch-index- 2014-insight-report-summary-and-methodology/ (Accessed: 21.03.2016).
- Hyde, M., Wiggins R. D., Higgs P. & Blane D. B. (2003). A measure of quality of life in early old age: The theory, development and properties of a needs satisfaction model (CASP-19), Aging & Mental Health, 7:3, 186-194.
- Kahneman, D. & Krueger, A.B. (2006). Developments in the measurement of subjective well-being. Journal of Economic Perspectives, 20-1, 3-24.
- McKenna, S.D., Doward, L.C., Alonso, J., Kohaman, T., Neiro, M., Prielo, L. & Wiren, L. (1999). The QoL-AGHDA: an instrument for the assessment of quality of life in adults with growth hormone deficiency. Quality of Life Research, 8, 373–383.
- Murrell, R. C., Kenealy, P. M., Beaumont, J. G. & Lintern, T. C. (1999). Assessing quality of life in persons with severe neurological disability associated with multiple sclerosis: The psychometric evaluation of two quality of life measures. British Journal of Health Psychology, 4(4), 349-362.
- OECD Better Life Index: Create Your Better Life Index (2016). URL: http://www.oecdbetterlifeindex.org/ (Accessed: 23.03.2016).
- OECD Regional Well-Being: A User’s Guide (2014). URL: http://www.oecdregionalwellbeing.org/assets/downloads/Regional-Well-Being-User-Guide.pdf (Accessed: 21.03.2016).
- Pavlova I., Gumennikov I. & Monastyrny E. (2016). The Profile of Older Generation in Russia: Evidence from the Tomsk Region. The European Proceedings of Social and Behavioural Sciences EpSBS, 7, 393-399, DOI: DOI:
- Pavlova, I., Monastyrny, E. & Gumennikov, I. (2015). Developing a Holistic System Approach for MeasuringWell-being of the Older Generation in Russia. Proceedings of The 26th International Business Information Management Association Conference, 2755 – 2767.
- Veenhoven, R. World Database of Happiness, Erasmus University Rotterdam, The Netherlands. URL: http://worlddatabaseofhappiness.eur.nl. (Accessed: 21.03.2016).
- Zaidi, A., Gasior, K., Hofmarcher, M.M., Lelkes, O. Marin, B., Rodrigues, R., Schmidt, A., Vanhuysse, P. & Zolyomi, E. (2013), Active Ageing Index 2012. Concept, Methodology and Final Results. Research Memorandum/ Methodology Report, European Centre Vienna, March 2013. URL: www.euro.centre.org/data/aai/1253897823_70974.pdf (Accessed: 15.03.2016).
Copyright information

This work is licensed under a Creative Commons Attribution-NonCommercial-NoDerivatives 4.0 International License.
About this article
Publication Date
17 January 2017
Article Doi
eBook ISBN
978-1-80296-018-1
Publisher
Future Academy
Volume
19
Print ISBN (optional)
-
Edition Number
1st Edition
Pages
1-776
Subjects
Social welfare, social services, personal health, public health
Cite this article as:
Shabaldina, N., Spitsin, V., Spitsina, L., Monastyrny, E., Pavlova, I., Gumennikov, I., & Shashkova, A. (2017). Developing Databank as an Instrument for the Elder People Wellbeing Analysis. In F. Casati, G. А. Barysheva, & W. Krieger (Eds.), Lifelong Wellbeing in the World - WELLSO 2016, vol 19. European Proceedings of Social and Behavioural Sciences (pp. 648-657). Future Academy. https://doi.org/10.15405/epsbs.2017.01.86