
Conceptualising The Free Bus Service Quality Performance Assessment

Abstract
This synthesised paper explores the theory of service quality that affects passenger’s satisfaction level on free bus services. Free bus services are an initiative by local authorities in encouraging people to switch their mode of transportation from private to public vehicles. However, planning and managing the services of free bus still remain as complex matters due to the lack of extensive in the understanding of the concept of service quality performance. Thus, it is very important to identify the state-of-the-art of service quality on free bus services that bring significant impact towards passengers. The Service Quality (SERVQUAL) model was studied in depth to precisely understand the fundamental of service quality that contributed to the level of passenger’s satisfaction. This model consists of 5 main dimensions (reliability, tangibility, responsiveness, empathy and assurance) that play important roles in evaluating the quality of service. Reliability helps in providing the service consistently and meeting with the schedule of information. Tangibility focuses on the physical place aspect, and helping the passengers falls under the responsiveness attribute. Last but not least, empathy is the attribute that considers the aspect of giving best services to the passengers. Meanwhile, assurance attribute is based on gaining the trust and confidence in fulfilling the needs of passenger. These attributes aid transport planners and decision makers to capture the level of free bus service performance and paving ways for improvement plan to be embedded in providing better public transportation particularly in free bus.
Keywords: Free bus, passenger’s satisfaction, SERVQUAL, attributes
Introduction
Ministry of Transport Malaysia (2017) stated that the Average Daily Traffic being recorded was 2,259,300. This situation portrays an image of Malaysia as one of the most stressful cities in Asia due to the factors of pollution, gender equality as well as traffic congestion (Delhi, 2017). Therefore, Malaysia started the initiative to reduce the congestion. For example, the state government of Selangor had introduced the free bus service with the aim to encourage the users of private vehicles to change their mode of transportation to the public transportation. The key development of economic revenue, less impact on environment and capacity to support the population growth based on good service quality are the important aspects that need to be considered in improving the overall public transportation system (Bachok, Osman & Ponrahono, 2014; Ponrahono, Bachok, Ibrahim & Osman, 2016). Therefore, in order to make sure the free transit program is successful, it is very important to identify the quality of service based on specific attributes to evaluate the current performance for a better improvement in the future.
According to Muthupandian and Vijayakumar (2012) the model of SERVQUAL helped in focusing on the grey area in ensuring the high quality of service that should be received by every passenger that ride public transports. Barabino, Deiana and Tilocca (2012) also stated that this model measured on several features of the passengers’ expectations and perceptions on the bus service quality, in which the end results helped in the improvement and implementation of programs on public transportation services organised by the agencies. The application of this model in identifying the free bus service quality performance is necessary and important in establishing the specific attributes that influent the level of service quality. Therefore, understanding the fundamental of this model in depth is vital to identify the conceptual evolution of the attributes in assessing the quality of the free bus service performance.
Problem Statement
The previous study related with bus service performance aimed on the impact of human population, congestion, productivity, revenue and policies (Badami & Haider, 2007; Dell’Olio, Ibeas, & Cecin, 2011) but;
There was still scant literature on the passenger’s satisfaction aspects (Singh, 2017).
This is proved with a statement made by Parasuraman, Zeithaml and Berry in 2009, where only several researchers had focused their study on the service quality even though there were revolutions in the service sector all over the world. The lack of understanding of the concept of service quality and the foundation are the causes of the root issues of most services not being quantified, tested or endorsed by the company's management, comprehensively and well interpreted (Parasuraman et al., 2009).
Limited studies in the application of the SERVQUAL model (Barabino et al., 2012)
This model was actually practically adopted and employed in various fields such as education, banking or hospitality except on the public transportation due. Hence, the in-depth review of the model concept and fundamental is very important in identifying the state-of-the-art of service quality on free bus services that bring significant impact towards passengers.
Research Questions
There are two (2) research questions to answer the purpose of the study:
- What is the service quality factors in influencing the level of passenger’s satisfaction when using the free bus?
- What are the significant attributes in choosing the service quality factors in measuring the level of passenger’s satisfaction when using the free bus?
Purpose of the Study
This study aimed in exploring the state-of-the-art of service quality attributes in the assessment of free bus quality performance. The objectives are:
- To identify the service quality factors that significant in level of passenger’s satisfaction assessment.
- To discuss the significant attributes of service quality factors in measuring the level of passenger’s satisfaction.
Research Methods
Model of SERVQUAL
The attributes of SERVQUAL enables to identify and measure the elements of passengers’ satisfaction based on psychological view and locality that are being captured (Mikhaylov, Gumenyuk, & Mikhaylova, 2015) in measuring the perceived and expected service quality. Basically, this model consists of five (5) dimensions which are:
- Tangibility: the state of physical facilities and equipment provided by the service as well the appearance of an employee
- Reliability: Capabilities of the service management to perform the promised service accurately, reliable and precisely
- Responsiveness: The willingness to provide efficient service and help the passengers
- Assurance: The knowledge and ability of employees to convey trust and confidence skills towards the passengers
- Empathy: The competency to give attention, empathy and care to the passengers
Systematic Review
Julie and Jill (2004) stated that this type of method is known as one of the critical synthesis in identifying evidence from the study that involves relevant variables based on the clarifications through research questions, literature, methods, data extraction, summarising and interpretation of results. This type of review is being used because it helps in adapting various and wide range of questions in finding the key component that forms the comprehensive evidence of literature.
Findings
Service quality is an important aspect in establishing and sustaining the relationship between service operators and passengers by identifying the gap between both perceived and expected service. Each attribute in the survey instrument should cover all the basic needs of passengers according to five (5) different dimensions on this model. According to Tripathi, Kumar and Nema (2012) this model is able to test on the empirical data for different cities that have different unique perceptions on using public transportation. In other words, it helps in capturing all the personal traits, cultural and contextual factor that may influence satisfaction quality (Mikhaylov et al., 2015).
Hence, the service quality attributes in this model is applicable for service quality survey in any locality and universal to be adapted in any field of service quality assessment, especially in public transportation services. Table 1 shows the previous studies related to the field of transportation that adopted the SERVQUAL model approach in service quality assessment.
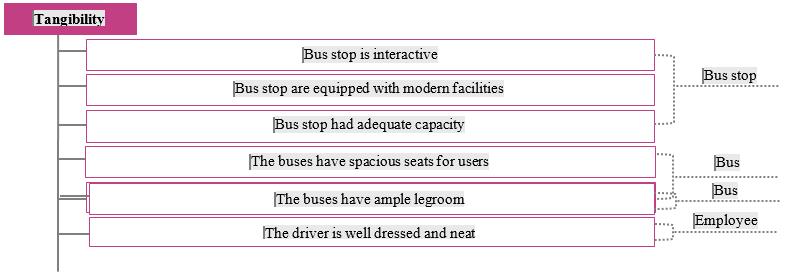
Tangibility in Service Quality of Free Bus
According to Roux and Jager (2012) the intangibility concept based on physical evidence, tools and equipment where if this element is being interpreted in the service quality of bus, thus it enables to identify the viewpoint of passengers on the physical aspects’ quality performance.
To deliver a good service, bus management must consider their nature of service and acknowledge the potential consequences of all elements on bus service quality that help bringing the positive impact on the responses from passengers regarding their satisfaction level based on their service experience at the bus stop and on-board.
Figure 1 shows the list of attributes under the tangibility dimension, but as for this study, the price aspect will not be being included.
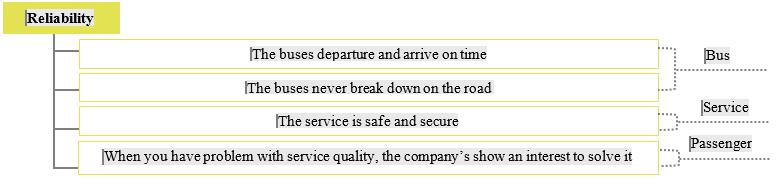
Reliability in Service Quality of Free Bus
The reliability in public transport especially for free bus depends on the company management in conducting punctual service delivery for the efficiency of service operation and scheduling system. Additionally, timetables are the important criteria in the scheduling process because the circulation of information to passengers is one of the critical aspect for a successful public transportation service in which it directly helps in maintaining the demand, as well as helping passengers in identifying the consistency and credibility of service. Thus, it is very clear that implementing an appropriate system helps to improve the reliability of public transport service, encourage continuous co-operation between bus and authorities and enhance the passenger’s satisfaction (Govinder, 2014). Figure 2 below shows an example of attributes related to the free bus services based on the previous study analysis.
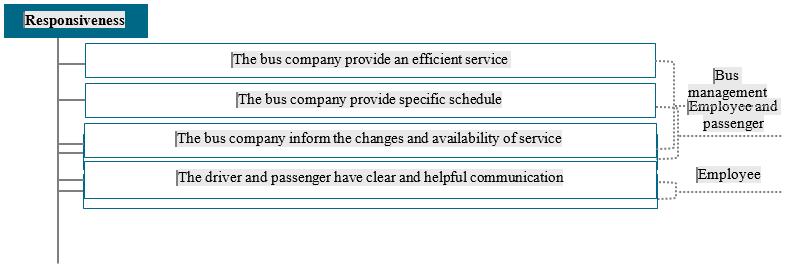
Responsiveness in Service Quality of Free Bus
Muthupandian and Vijayakumar (2012) mentioned that the primary factor of this dimension focuses on the willingness of service operator in providing the prompt service to passengers but at the same time is able to identify the abilities of the employees in interacting with the passengers. This dimension helps to improve the ability of transportation management in responding towards the changes based on the passengers’ needs and market (Kritchanchai & MacCarthy, 1999). Usually when the passengers experience the service problems, they will expect the employees of the service operation to solve it as soon as possible or at that particular time (Francis & Richard, 2017). Besides, in constructing the instruments, it is important to consider the variety of route service, various form of transportation and forming the integrated network that is flexible and could achieve the purpose of public transportation. Figure 3 is an example of attributes that are interpreted based on responsiveness aspect that focuses on the quality of free bus service.
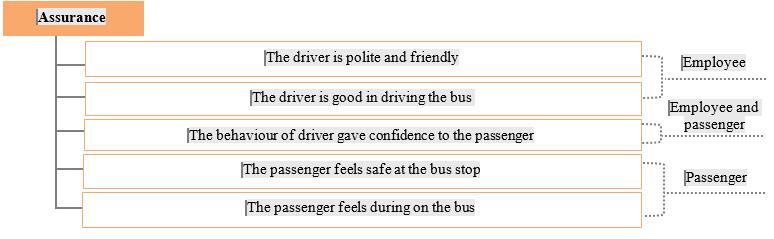
Assurance in Service Quality of Free Bus
The term “assurance” refers to an activity that provides service confidence in order to make sure the quality of service for bus transportation is being performed effectively (Giblin & Li, 2007). This dimension focuses on forecasting any reliable problems which turned out as reviews by the passengers in figuring out the problem of the services provided. Francis and Richard (2017) stated that once the confidence ability is being enhanced within the mind of the passengers, the chances for passengers in asking for help while riding the bus automatically shows that the employee is in the sense to perform the job very well, and as passengers, they would feel safe. Assurance also helps in enhancing the interpersonal relationship between employee and passengers as it is an important aspect to be considered in identifying the quality of service in bus transportation (Jager & Plooy, 2007). Figure 4 shows an example of preferable attributes to be asked to the passengers for the satisfaction level survey.
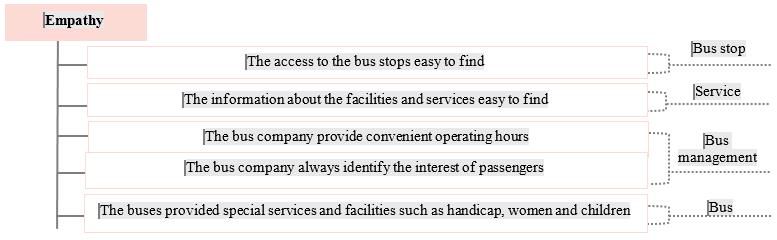
Empathy in Service Quality of Free Bus
According to Wieseke, Geigenmüller, and Kraus (2012) empathy is the feeling that exists when the interaction between the passengers and employees happens throughout their basis psychological profile. For example, when the service is good, the passengers would feel that the quality of service is smooth and satisfying and that would encourage them to use the services in the future. Study by Mikhaylov et al. (2015) concluded that empathy was one of the important values in providing caring and attention ability to fulfil the needs of passengers. The passengers’ empathy will directly affect the loyalty of passengers because this dimension has high cognitive and affective interaction towards the user. In measuring the quality of service of free bus. Figure 5 shows an example of attributes adapted from the previous study.
Conclusion
Service quality factors consists of five (5) dimensions namely tangible, reliability, responsiveness, assurance and empathy had brought significant influence and impacts in measuring the quality of service and level of satisfaction. Each of the attribute plays an important role in constructing, implementing and improving the quality of service not only for free bus but also for other public transportation services. However, in measuring the quality of service and satisfaction level, researcher should know and understand the environment of transport services to be studied according to the different aspect of time, seats or the space of the vehicle. In short, the SERVQUAL model helps in specifying the standard quality of the service either it falls below passenger expectations or vice versa.
Acknowledgments
This research was fully supported by Putra Grant UPM - Putra Young Initiative (GP-IPM/2018/9592500).
References
Bachok, S., Osman, M. M., & Ponrahono, Z. (2014). Passenger’s aspiration towards sustainable public transportation system: Kerian District, Perak, Malaysia. Procedia - Social and Behavioral Sciences, 153, 553–565.
Badami, M. G., & Haider, M. (2007). An analysis of public bus transit performance in Indian cities. Transportation Research Part A: Policy and Practice, 41(10), 961–981.
Barabino, B., Deiana, E., & Tilocca, P. (2012). Measuring service quality in urban bus transport: A modified SERVQUAL approach. International Journal of Quality and Service Sciences, 4(3), 238–252.
Ceran, E. B., & Esen, T. E. C. (2018). Service quality perception comparison in transport systems within the context of users of Istanbul city’s. International Journal of Social Sciences, 6(October), 94-1–6.
Delhi, N. E. W. (2017). Asia’ s least and most stressful cities Bangladesh’ s capital Dhaka tops the list of the most stressed cities in Asia whereas Sydney followed by Singapore, Taipei and Osaka are the least stressed cities in Asia, according to the data compiled by the U. The Nation.
Dell’Olio, L., Ibeas, A., & Cecin, P. (2011). The quality of service desired by public transport users. Transport Policy, 18(1), 217–227.
Francis, L., & Richard, J. (2017). Customer service quality management in public transport: The case of rail transport in Tanzania. International Review, (3), 102–117.
Giblin, S., & Li, R. (2007). Quality assurance systems in transport modelling. 30th Australian Transport Research Forum, 1–12.
Govinder, K. K. (2014). A theoretical overview of public transport service quality: A focus on bus and mini-bus taxi service in South Africa. Journal of Social Sciences (COES&RJ-JSS), 3(2), 301–316.
Jager, J. De, & Plooy, T. Du. (2007). Measuring tangibility and assurance as determinants of service quality for public health care in South Africa. Acta Commercii, 96–111.
Julie, B., & Jill, M. (2004). Reviewing the literature: adopting a systematic approach. Journal of Family Planning and Reproductive Health Care, 30(1), 13–16.
Kritchanchai, D., & MacCarthy, B. L. (1999). Responsiveness of the order fulfilment process. International Journal of Operations and Production Management, 19(8), 812–833.
Mikhaylov, A., Gumenyuk, I., & Mikhaylova, A. (2015). The SERVQUAL model in measuring service quality of public transportation: Evidence from Russia. Quality, Access to Success, (September).
Ministry of Transport Malaysia. (2017). Statistik Pengangkutan Malaysia. In Statistik Pengangkutan Malaysia 2017. Retrieved from http://www.mot.gov.my/my/StatistikTahunan Pengangkutan/Statistik Pengangkutan Malaysia 2017.pdf
Muthupandian, K. S., & Vijayakumar, C. (2012). Measurement of passengers service quality in public transportation: SERVQUAL analysis. Munich Personal RePEc Archive, 1(5), 1–9.
Ok, S., & Hengsadeekul, T. (2018). Customer satisfaction on service quality of bus transport: A survey of passengers from Phnom Penh to Poipet in Cambodia. Journal of Social Science Studies, 5(2), 114.
Parasuraman, A., Zeithaml, V. A., & Berry, L. L. (2009). A conceptual model of service quality and its implications for future research. The Journal of Marketing, 49(4), 41–50.
Ponrahono, Z., Bachok, S., Ibrahim, M., & Osman, M. M. (2016). Assessing passengers’ satisfaction level on bus services in selected urban and rural centres of Peninsular Malaysia. Procedia - Social and Behavioral Sciences, 222, 837–844.
Roux, T., & Jager, J. de. (2012). A comparison of tangible service quality delivery by different grocery store formats in South Africa. IJBPE, 5(September), 145–157.
Sam, E. F., Hamidu, O., & Daniels, S. (2018). SERVQUAL analysis of public bus transport services in Kumasi metropolis, Ghana: Core user perspectives. Case Studies on Transport Policy, 6(1), 25–31.
Singh, S. (2017). Assessment of passenger satisfaction with public bus transport services: A case study of Lucknow City (India). Studies in Business and Economics, 11(3), 107–128.
Tripathi, V., Kumar, A., & Nema, G. (2012). Measuring Service Quality in Indian Public Transport System: A Comprehensive Review Asia-Pacific Marketing Review. Asia-Pacific Marketing Review, I(June), 113–119.
Wieseke, J., Geigenmüller, A., & Kraus, F. (2012). On the role of empathy in customer-employee interactions. Journal of Service Research, 15(3), 316–331.
Copyright information

This work is licensed under a Creative Commons Attribution-NonCommercial-NoDerivatives 4.0 International License.
About this article
Publication Date
26 December 2017
Article Doi
eBook ISBN
978-1-80296-950-4
Publisher
Future Academy
Volume
2
Print ISBN (optional)
-
Edition Number
1st Edition
Pages
1-882
Subjects
Technology, smart cities, digital construction, industrial revolution 4.0, wellbeing & social resilience, economic resilience, environmental resilience
Cite this article as:
Shukri, N. S. M., & Ponrahono*, Z. (2017). Conceptualising The Free Bus Service Quality Performance Assessment. In P. A. J. Wahid, P. I. D. A. Aziz Abdul Samad, P. D. S. Sheikh Ahmad, & A. P. D. P. Pujinda (Eds.), Carving The Future Built Environment: Environmental, Economic And Social Resilience, vol 2. European Proceedings of Multidisciplinary Sciences (pp. 825-833). Future Academy. https://doi.org/10.15405/epms.2019.12.84