
Content Validation and Reliability Study of Workplace Solid Waste Segregation Behaviour


Abstract
One of the causes of environmental pollution is a waste generation, and the fundamental solution for this is waste minimisation through waste segregation. Many studies have been done for the behaviour modification for the waste separation at source, but a lack of study targets the educational institution staff as the respondent. Plus, at the organisational level, less study on the factors influencing the workers to practice green behaviour individually and the tools or instruments readily tested do not cover the organisation and individual perspective. Thus, this research aims to evaluate the validity and reliability of the items in the questionnaire to assess green human resource management, pro-environmental concern and solid waste segregation behavioural intention. Nine experts were involved in the validation study, and 37 university staff responded to the reliability study pre-testing. The content validation was analysed using the content validation index, which is the item content validation index (I-CVI), scale content validation index (S-CVI) and experts agreement (Fleiss Kappa Statistic) (k). The reliability study used the value of Cronbach's alpha (Cronbach's α) as the guideline for the item's reliability. The I-CVI for all the items ranges from 0.78 to 1.00, and the average of each domain is between 0.89 to 1.00 for its relevancy and clarity. The items also show the perfect expert agreement when each domain's average (k) values were between 0.88 to 1.00. The Cronbach's α of all items ranged from 0.87 to 0.97. Thus, all the items generated are validated and reliable for testing.
Keywords: Expert validation, content validation index, fleiss kappa statistic, reliability
Introduction
In recent decades, global waste production has expanded dramatically, and there are no signs of a slowdown. As the population rises, solid waste management worsens global ecology, economy, and public health. The world annually generates 2.01 billion metric tonnes of municipal solid waste (MSW). Among these, 33% are not being handled in a way that is safe for the environment. ASEAN's per capita MSW generation is 1.14 kg/capita/day, whereas the average daily waste generated by a single person in the country is 0.74 kg, ranging from 0.11 to 4.54 kg (Ian Tiseo, 2022). The above findings indicate the absence of solid waste strategic planning and insufficient financial investment in waste management. Thus, this poor environmental management will harm public health and affect the nation's economy and sociological balance (Boiral et al., 2019).
Malaysia generated a massive amount of municipal garbage, projected at 38,427 metric tonnes per day (1.17 kg/capita/day) in 2021, with 82.5% of waste going to landfills. In comparison, fewer than 20% of garbage is recycled. Given these circumstances, solid waste output in 2022 will reach 14 million tonnes annually. This quantity can be estimated by imagining the Petronas Twin Tower filling up with trash every week. In the meantime, the Solid Waste Corporation (SWCorp) said that the recycling rate that was achieved in the year 2020 was 30.67%, which is lower than the recycling rates that are achieved in other developed countries such as Singapore (59%), Korea (49%) and Taiwan (60%) (Waste to Energy for A Sustainable Future, 2021).
The Twelfth Malaysia Plan (12MP) seeks to address these issues by increasing the percentage of recycled domestic waste from 30% to 40%. This development plan's five-year time frame (2021-2025) aims to achieve a clean, green, and resilient strategy for national growth. The enforcement of waste separation at the source as the supporting effort to reduce, reuse, and recycle (3R) campaign will make the comprehensive and environmentally friendly waste management possible. More effort will be made to improve waste sorting and recycling infrastructure, especially in residential, institutional, and commercial zones. These actions are in keeping with the 2019 National Cleanliness Policy, which aims to lessen the environmental impact of waste by bolstering the circular economy and other waste-to-wealth programmes (Waste to Energy for A Sustainable Future, 2021)
Based on the waste management hierarchy, the bottom of the pyramid leads to more sustainable living, opposite the top, which is more investable. The bottom of the waste management hierarchy is waste minimisation or reduction; the upper part is treatment and disposal. Waste reduction means the action to minimise the waste from the source before to the landfill. The fundamental initiative for this part is waste segregation. Waste segregation is the primary essential step before recycling. Logically, the recycling rate will drastically increase when the waste segregation at sources is perfectly done. However, we are facing a lower recycling rate than the other country. Many initiatives have been done in the aspect of technology, governance, social and financial. However, the progress is still running slowly and costly, where the most fundamental factor for this goal is human participation which means behaviour modification (Derdowski et al., 2020). Referring to the National Policy 2020, the strategy to increase the recycling rate is to reinforce the implementation of waste separation in residential, industrial, commercial and institutional areas. Much research has been done in the residential and industrial sectors, but there is a lack of studies in institutions focusing on employee perception and behaviour (Blok et al., 2015)
In light of the growing attention paid worldwide to enhancing environmental consciousness, lowering carbon emissions, raising recycling rates, and cutting energy consumption, it is essential to explore the organisational factors that encourage the ecological behaviours of employees. The inability of organisations to comprehend how to influence their workforces to engage in environmentally conscious actions is a barrier to environmental friendliness (Lasrado & Zakaria, 2020; Manika et al., 2021). To find solutions to environmental issues, a great number of research has been carried out to investigate the ecological behaviours of employees in a wide range of economic sectors (Aslam et al., 2021; Saeed et al., 2019). However, current research on employee ecological behaviour does not provide enough evidence of holistic indicators to initiate employee ecological behaviour in the workplace.
Regardless of the emphasis placed on the environmentally responsible behaviours of employees, not much thought has been put into getting individual staff to adopt more environmentally conscious practices, particularly in the higher education sector (Anwar et al., 2020; Malik et al., 2019). Higher education sectors play an essential role in the entire service and manufacturing sector by supplying a trained and skilled workforce (Farooq, Yusliza, Muhammad, & Saputra, 2022; Farooq, Yusliza, Muhammad, Omar, et al., 2022). Over the past few years, higher education institutions have made growing efforts to include environmental management and green practices in their services (Aboramadan, 2022). Hence this study will take part in a higher educational institution in Malaysia.
Environmentally responsible business practices are now necessary to form a company's reputation and its edge over the competition. A growing number of businesses have recognised the necessity of including staff members to improve sustainable performance. These efforts typically take the shape of programmes designed to cut down on waste and improve resource use overall (Davis et al., 2020; Young et al., 2015). Furthermore, the results of a recent survey demonstrated an increase in the use of green human resource management (GHRM) methods to encourage employee participation in environmentally responsible behaviours (Omarova & Jo, 2022). By tying together HRM processes, including training, performance management, recruitment, employee participation, and reward, with the company's environmental objectives, GHRM makes environmental management more effective (Ojo et al., 2019, 2022). Even though there has been a growing academic interest in the impact that GHRM practises play on environmental performance, recent studies have urged for additional research to be done on the factors that motivate employees to engage in environmentally responsible behaviours (Davis et al., 2020; Paillé & Francoeur, 2022).
Establishing an instrument that adequately addresses all concerns about behaviour and the environment can be challenging because different individuals from different communities will have different perceptions. The research carried out by Tian and Robertson (2019) developed an instrument to measure environmentally conscious behaviour, whereas the research carried out by Ansari et al. (2021) and Raza et al. (2021) concentrated on the knowledge component. In addition, Ojo et al. (2019), Wang et al. (2021) and Filimonau et al. (2018) only focused on values and attitudes aspects. The only similar research has been conducted by (Yong et al., 2019; Yu et al., 2020), which unfortunately has some weaknesses which are limited to the behaviour and knowledge of the industrial community and not generally applicable to the broader community. Complying with the concept of social science, meaningful and valuable research can be accomplished by testing its instruments' reliability and validity to avoid claims or misinformation (Drost, 2011). Reliability is when the same result comes out of repeated measurements, and validity is the sign that a test or measuring tool is accurate and precise (Drost, 2011; Nunally, 1978). Hence, this study aims to develop valid and reliable items for solid waste segregation behaviour at the workplace in higher educational institutions. In continuation of what was just discussed, the objectives of this research are to investigate the following questions:
Q1: What is the validation index for all the items in three dimensions of solid waste segregation behaviour?
Q2: What is the reliability index for all the items in three dimensions of solid waste segregation behaviour?
Methods
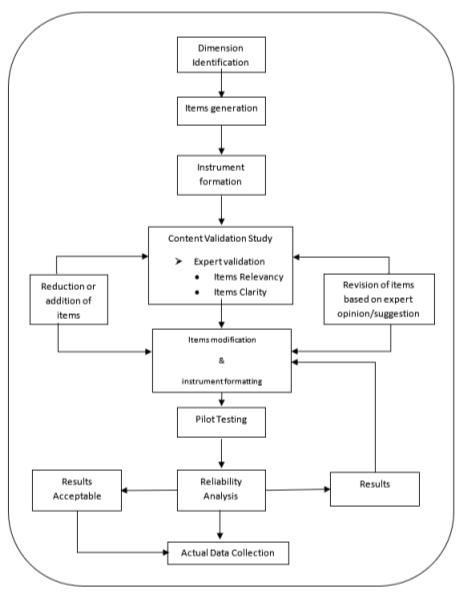
The flowchart of the methods used in this study is shown in figure 1. The first stage of instrument development comprises three stages: the first stage identifies the content domain, the second stage generates sample items, and the third stage builds the instrument. The crucial step in the domain confirmation is the extensive literature review, where the researcher analyses the framework, constructs and items of employee green behaviour used by the previous scholars. Reviewing the existing literature, the researcher could spot several holes in the construct's theoretical underpinnings. Then, from the construct, all the items were gathered from the different scholars with the same construct and theory. Subsequent, all the items were listed for the instrument generating that suited the study.
After that, the researcher prepares the content validation form, which measures the content validation of items' relevancy and clarity. Specific experts were appointed for the items' judgment to ensure the assessment instrument's content validity. The selection of the domain specialists needs to be based on their in-depth understanding of the topic and their specialised training or extensive professional experience. It is suggested that three specialists be consulted to evaluate content validity. Although there is no set limit on the number of experts who can participate, it is highly improbable that more than ten will be included, given that the greater the number of experts, the lower the likelihood that they will all be able to reach a consensus (Yusoff & Department of Medical Education, School of Medical Sciences, Universiti Sains Malaysia, MALAYSIA, 2019; Zelt et al., 2018). Researchers chose nine experts, six academics and three industry experts, based on their knowledge and experience in organisational behaviour and environmental science, to evaluate the questions' content validity.
Content validation can be done in either a face-to-face or non-face-to-face setting. Non-face-to-face approach was used for this study. Using this approach, an online content validation form was delivered to the experts, and clear instructions were provided to make the content validation process easier to complete. The three most critical things to evaluate are cost, time, and response rate. The face-to-face technique may be more expensive and time-consuming due to the difficulties of gathering all specialists, but the response rate will be the highest. The response rate and time may be the most challenging aspects of the non-face-to-face strategy due to the difficulty of receiving a response on time and the possibility of not receiving a response from the expert (Taherdoost, 2018).
The next step is to check the domain and content validation form items. The domain's definition and representative objects are offered to domain experts. Before assigning a score to each item, the experts must thoroughly assess the domain and its components. In order to increase the items' applicability to the given issue, the experts are asked to provide feedback, either verbally or in writing. All feedback is considered when deciding how to improve the domain and its items.
Then, the complete response validation form was analysed to determine the item's content validation (I-CVI) and scale content validation (S-CVI), followed by the experts' agreement (Fleiss Kappa Statistic (k). The I-CVI score for each item was determined by taking the total number of experts and dividing it by the number of experts who gave the item a rating of 3 or 4. In the case of five or fewer judges, it is recommended that I-CVI be 1.00, and in the case of six or more judges, it is recommended that I-CVI not be less than 0.78 (Almohanna et al., 2022). The S-CVI was computed to determine the extent to which the overall scale contains valid information. The S-CVI model, on which there is universal consensus, can be used to conceptualise it, as can the S-CVI model (average). S-CVI (average) emphasises average item quality rather than the average performance of the experts. It is recommended that a minimum S-CVI should be 0.8 to reflect content validity (Yusoff & Department of Medical Education, School of Medical Sciences, Universiti Sains Malaysia, MALAYSIA, 2019).
Researchers widely use CVI to assess content validity. However, the value does not consider the possibilities of exaggerated values due to random agreement. As a result, because it eliminates any random chance agreement, the (k) coefficient computation confirms better knowledge of content validity. The (k) is a consensus index for an interrater agreement that is used in addition to CVI to confirm that expert agreement is not a consequence of chance. Calculating the Kappa Statistic requires the random agreement probability, which is represented by the formula Pc = [N! / A! (N - A)!]. 0.5N. In this formula, N refers to the total number of experts on the panel, and A indicates the total number of experts who believe that the topic at hand is significant. The formula for calculating the kappa statistic is as follows: K = (I-CVI - Pc) / (1 – Pc). The evaluation criteria for (k) indices are classified as the values below by following the statement from (Brusseau et al., 2022; Nichols et al., 2010).
a) 0.40 to 0.59: low or weak agreement between expert
b) 0.6 to 0.74: the moderate agreement between expert
c) More than 0.74: excellent or near-perfect agreement between expert
Once questionnaires are prepared, a pre-testing study has been done, and a pre-test is a vital next step in the research process. It is essential to do a pilot test of the survey to identify areas for improvement, lessen measurement error, ease the respondent burden, ascertain whether respondents correctly comprehend questions, and guarantee that question order does not affect responses. In the context of social science research, a pre-test can be thought of as a critical study of the instrument that will help establish the survey's validity and reliability. Hence the final draft was circulated randomly among the HEI employees by emailing the Microsoft form to them. There were 37 respondents in this pre-testing study, and the results were analysed through the SPSS version 26 to measure the items' reliability.
The consistency of measurement is directly related to reliability (Bryman, 2015). The degree to which a measure is free of bias and, thus, free of errors is directly proportional to the degree to which the measure can be relied upon to provide consistent results across both time and items in the instrument (Sekaran & Bougie, 2016). According to (Saunders et al., 2019), "reliability" refers to the consistency of the findings produced by a data gathering or analysis procedure. The reliability of a variable is evaluated using a method known as composite reliability (Hair et al., 2017). This method includes merging the items that constitute a variable to get a score, also known as a data point, for the variable in question. This study utilised composite reliability to confirm the investigation's internal consistency. The overall reliability value can vary from 0 to 1, with higher values representing greater confidence (Hair et al., 2017). Values between 0.60 and 0.70 are considered appropriate for exploratory research, whereas values between 0.70 and 0.90 are considered satisfactory for more scientific research stages, as stated by Nunally (1978). Composite dependability with a threshold of 0.70 (> 0.70), as suggested by Nunnally and Bernstein (1999) was used in this investigation.
Findings
Content validation
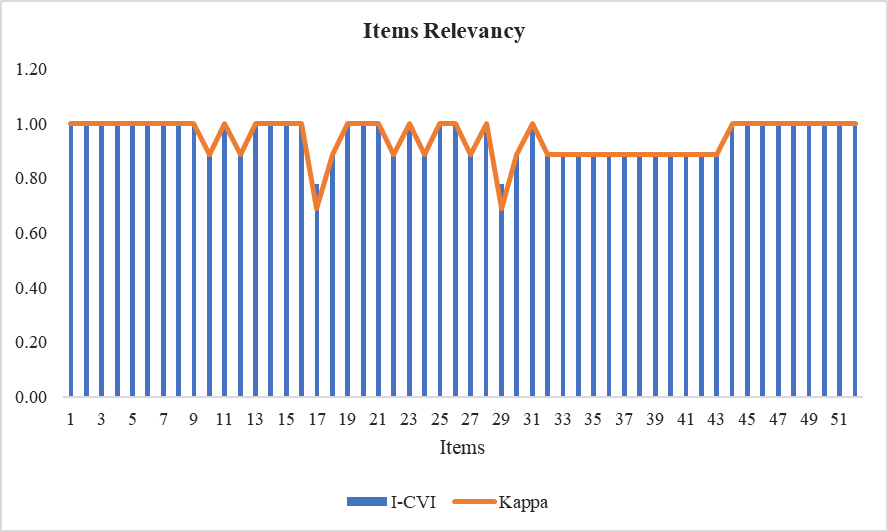
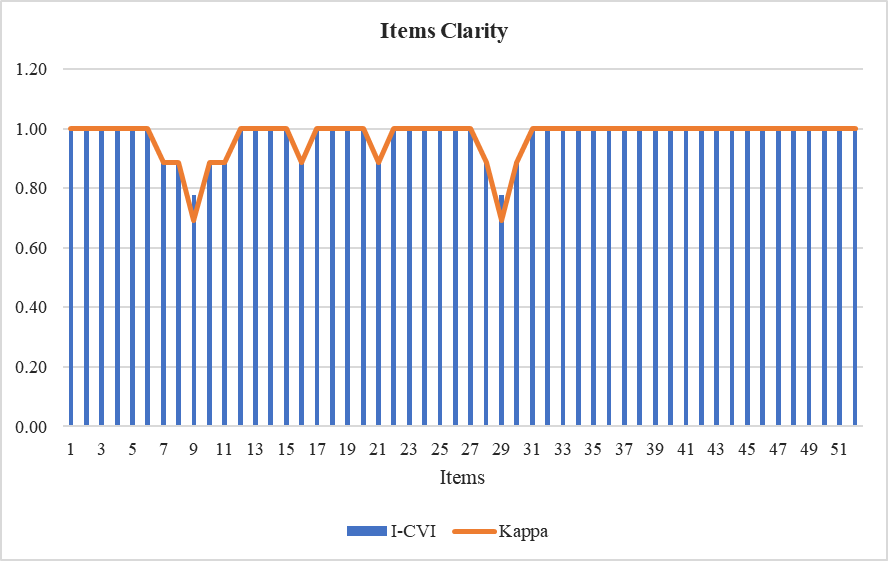
Figures 2 and 3 are combinations of bar graphs and a line graph that illustrate the results of validity and intra-reliability of each item from all the dimensions involved in this research. Figure 2 illustrates the first element of validity, item relevancy. In contrast, Figure 3 illustrates the second element, which is the clarity of items. Hence, these two graphs give the big picture of each item's content validity index (I-CVI) and agreement level of experts or intra-reliability (Fleiss Kappa Statistic) (k).
Focusing on the (I-CVI) value, the graph bar has illustrated that all the 52 items from four dimensions have a value range of 0.78 to 1.00. Most of the items reach the acceptable value of more than 0.83 except items 17 and 29, which are 0.78.
The line graph from Figures 2 and 3 are illustrated the agreement level of experts or the item's inter-reliability index through the value of (k). Based on the graph, the value range is between 0.69 to 1.00. Almost all the items have an excellent agreement between experts except items 9, 17 and 29, where they have the lowest score of 0.69.
Content validity indices
The I-CVI for relevancy and clarity of all items ranged between 0.78 to 1. A total of 48 items from all dimensions score the acceptance value for its relevancy, where 34 items have the highest value, 1.00, and 19 items score 0.89, while 2 items did not achieve the acceptance value of I-CVI. 50 items reached the acceptance value of I-CVI for its clarity, where 42 items scored 1.00, followed by the others item that scored 0.89, while only 2 items reached the required value.
The S-CVI (average) of relevancy for social demographic profile, green human resource management, pro-environmental concern and solid waste segregation behaviour was 1.00 (table 1), 0.96 (table 2), 0.89 (table 3) and 1.00 (table 4) respectively. Dimensions 1 and 3 have the S-CVI (average) of 0.98, while dimensions 2 and 4 scores 0.96 and 1.00, respectively. Hence, all the dimensions have the acceptance value of relevancy and clarity validation index for their items and scale. However, due to the unacceptance value of I-CVI, four items need revising for their relevancy and clarity, which are items 17 and 29 and items 9 and 29, respectively.
Experts agreement (Fliess Kappa Statistic) (k)
The highest or almost perfect agreement (average) of content relevancy was scored by dimension 1 and 4, followed by dimension 2 and 3, where the value is 1.00, 1.00, 0.95 and 0.88, respectively. In comparison, the highest (k) value of content clarity was dimension 4 (1.00), followed by dimension 1 (0.98), then dimension 3 (0.97) and lastly, dimension 2 (0.96).
The (k) value range for all items was between 0.69 to 1.00. All the items in dimension 1 (table 1) and 4 (table 4) have the almost perfect agreement value for their item relevancy and clarity, where both dimension scores range between 0.89 to 1.00. In contrast, dimension 2 (table 2) and dimension 3 (table 3) range have shown the lowest value of (k) for its several items' relevancy and clarity which is 0.67, which is below the acceptance value of 0.74. Although the value of (k) average for totals items were 0.95 and 0.97 for their relevancy and clarity, the consideration for revising each item is still explicitly needed for items that are unsuccessful in reaching the acceptance value. As a result, the items chosen for further data collection were solely based on recommendations and expert consultation.
The result above is essential guidance for item selection, and several items have been retained, while some have been modified by paraphrasing, combination, and separation. After some modification, a total of 54 items have been selected for this research.
Reliability study
The Cronbach's alpha analysis results in Table 5 reveal that the reliability value ranges from 0.871 to 0.977. Based on the results, green human resource management, the first construct in this research, has the highest Cronbach alpha (0.977), followed by the solid waste segregation behavioural intention, and closed with pro-environmental concern (0.871), which is the lowest value. Hence all three constructs in this study show outstanding consistency and reliability between all the items.
Conclusion
In this study, an instrument of solid waste segregation behaviour at the workplace was developed and validated among the university staff in Malaysia. The questionnaire consisted of 52 items on demographic profile, green human resource management, pro-environmental concern, and solid waste segregation behavioural intention. All the items in the domains were valid and reliable for the actual data collection, and all the items and scaled successful score the value of I-CVI and S-CVI more than the accepted value, which is 0.83. All the items also managed to get an excellent expert agreement by scoring the Fleiss Kappa Statistic more than 0.69. In addition, the average of all the items from each domain also shows the excellent value of content validity and expert agreements.
Moreover, all the items show high reliability where Cronbach's alpha for all the domains ranges between 0.88 to1.0. Hence, based on the analysis, all the items have good validity and reliability. However, based on the notes or commend from the experts, some modifications have been done to improve the instrument. Therefore, from the 52 items earlier, 54 items have been finally generated to be tested for the actual data collection. In conclusion, the content validation index facilitates the validity and reliability process for the research variables.
References
Aboramadan, M. (2022). The effect of green HRM on employee green behaviors in higher education: the mediating mechanism of green work engagement. International Journal of Organizational Analysis, 30(1), 7–23. DOI:
Almohanna, A. A. S., Win, K. T., Meedya, S., & Vlahu-Gjorgievska, E. (2022). Design and content validation of an instrument measuring user perception of the persuasive design principles in a breastfeeding mHealth app: A modified Delphi study. International Journal of Medical Informatics, 164, 104789. DOI: 10.1016/j.ijmedinf.2022.104789
Ansari, N. Y., Farrukh, M., & Raza, A. (2021). Green human resource management and employees pro-environmental behaviours: Examining the underlying mechanism. Corporate Social Responsibility and Environmental Management, 28(1), 229–238. DOI:
Anwar, N., Nik Mahmood, N. H., Yusliza, M. Y., Ramayah, T., Noor Faezah, J., & Khalid, W. (2020). Green Human Resource Management for organisational citizenship behaviour towards the environment and environmental performance on a university campus. Journal of Cleaner Production, 256, 120401. DOI:
Aslam, H., Azeem, M. U., Bajwa, S. U., Ramish, A., & Saeed, A. (2021). Developing organisational citizenship behaviour for the environment: the contingency role of environmental management practices. Management Decision, 59(12), 2932–2951. DOI:
Blok, V., Wesselink, R., Studynka, O., & Kemp, R. (2015). Encouraging sustainability in the workplace: A survey on the pro-environmental behaviour of university employees. Journal of Cleaner Production, 106, 55–67. DOI:
Boiral, O., Heras-Saizarbitoria, I., & Brotherton, M. C. (2019). Nature connectedness and environmental management in natural resources companies: An exploratory study. Journal of Cleaner Production, 206, 227–237. DOI:
Brusseau, A., Ko, J., & Lim, H. K. (2022). Reliability Study of the Items of the Alberta Infant Motor Scale (AIMS) Using Kappa Analysis. International Journal of Environmental Research and Public Health, 19(3), 1767. DOI:
Bryman, A. (2015). Social Research Methods (4th edition). Oxford university press.
Davis, M. C., Unsworth, K. L., Russell, S. v., & Galvan, J. J. (2020). Can green behaviors really be increased for all employees? Trade-offs for "deep greens" in a goal-oriented green human resource management intervention. Business Strategy and the Environment, 29(2), 335–346. DOI:
Derdowski, L. A., Grahn, Å. H., Hansen, H., & Skeiseid, H. (2020). The new ecological paradigm, pro-environmental behaviour, and the moderating effects of locus of control and self-construal. Sustainability (Switzerland), 12(18), 7728. DOI:
Drost, E. A. (2011). Validity and Reliability in Social Science Research. Education Research and Perspectives, 38(1).
Farooq, K., Yusliza, M. Y., Muhammad, Z., Omar, M. K., & Nik Mat, N. H. (2022). Employee ecological behavior among academicians at the workplace. Social Responsibility Journal, 19(4), 713-740. DOI:
Farooq, K., Yusliza, M. Y., Muhammad, Z., & Saputra, J. (2022). Developing a Conceptual Model of Employee Ecological Behavior using an Integrative Approach. Journal of Environmental Management and Tourism, 13(1), 29–38. DOI:
Filimonau, V., Matute, J., Mika, M., & Faracik, R. (2018). National culture as a driver of pro-environmental attitudes and behavioural intentions in tourism. Journal of Sustainable Tourism, 26(10), 1804–1825. DOI:
Hair, J., Hollingsworth, C. L., Randolph, A. B., & Chong, A. Y. L. (2017). An updated and expanded assessment of PLS-SEM in information systems research. Industrial Management & Data Systems, 117(3), 442-458. DOI:
Ian Tiseo. (2022, June 21). Global waste generation - statistics & facts. Statista. Statista. https://www.statista.com/topics/4983/waste-generation-worldwide/#dossierContents__outerWrapper
Lasrado, F., & Zakaria, N. (2020). Go green! Exploring the organisational factors that influence self-initiated green behavior in the United Arab Emirates. Asia Pacific Journal of Management, 37(3), 823–850. DOI:
Malik, M. I., Nawaz Mir, F., Hussain, S., Hyder, S., Anwar, A., Khan, Z. U., Nawab, N., Shah, S. F. A., & Waseem, M. (2019). Contradictory results on environmental concern while re-visiting green purchase awareness and behavior. Asia Pacific Journal of Innovation and Entrepreneurship, 13(1), 17-28. DOI:
Manika, D., Blokland, Y., Smith, L., Mansfield, L., & Klonizakis, M. (2021). Using stealth marketing techniques to increase physical activity and decrease sedentary time in the workplace: A feasibility study investigating the spill-overs of employee pro-environmental behaviour. International Journal of Business Science and Applied Management, 16(1), 28–49.
Nichols, T. R., Wisner, P. M., Cripe, G., & Gulabchand, L. (2010). Putting the kappa statistic to use: Putting the Kappa Statistic to Use. The Quality Assurance Journal, 13(3-4), 57-61. DOI:
Nunally. (1978). Validity and Reliability in Social Science Research. Education Research and Perspectives, 38(1).
Nunnally, J. C., & Bernstein, I. H. (1999). Psychometric theory (3rd ed.). In Journal of Psychoeducational Assessment (Vol. 17). DOI:
Ojo, A. O., Raman, M., & Downe, A. G. (2019). Toward green computing practices: A Malaysian study of green belief and attitude among Information Technology professionals. Journal of Cleaner Production, 224, 246–255. DOI:
Ojo, A. O., Tan, C. N.-L., & Alias, M. (2022). Linking green HRM practices to environmental performance through pro-environment behaviour in the information technology sector. Social Responsibility Journal, 18(1), 1-18. DOI:
Omarova, L., & Jo, S.-J. (2022). Employee Pro-Environmental Behavior: The Impact of Environmental Transformational Leadership and GHRM. Sustainability, 14(4), 2046. DOI: 10.3390/su14042046 [DOI] | [CR]
Paillé, P., & Francoeur, V. (2022). Enabling employees to perform the required green tasks through support and empowerment. Journal of Business Research, 140, 420–429. DOI:
Raza, A., Farrukh, M., Iqbal, M. K., Farhan, M., & Wu, Y. (2021). Corporate social responsibility and employees' voluntary pro-environmental behavior: The role of organizational pride and employee engagement. Corporate Social Responsibility and Environmental Management, 28(3), 1104-1116. DOI:
Saeed, B. bin, Afsar, B., Hafeez, S., Khan, I., Tahir, M., & Afridi, M. A. (2019). Promoting employee's proenvironmental behavior through green human resource management practices. Corporate Social Responsibility and Environmental Management, 26(2), 424–438. DOI:
Saunders, M., Lewis, P., & Thornhill, A. (2019). Research Methods for Business Students. In M. Saunders, P. Lewis, & A. Thornhill (Eds.), In Research Methods for Business Students (8th edition).
Sekaran, U., & Bougie, R. (2016). Research Methods for Business A Skill Building Approach (7th edition). Wiley & Sons.
Taherdoost, H. (2018). Validity and Reliability of the Research Instrument; How to Test the Validation of a Questionnaire / Survey in a Research. SSRN Electronic Journal. DOI:
Tian, Q., & Robertson, J. L. (2019). How and When Does Perceived CSR Affect Employees' Engagement in Voluntary Pro-environmental Behavior? Journal of Business Ethics, 155(2), 399–412. DOI:
Wang, H., Li, J., Mangmeechai, A., & Su, J. (2021). Linking perceived policy effectiveness and proenvironmental behavior: The influence of attitude, implementation intention, and knowledge. International Journal of Environmental Research and Public Health, 18(6), 1–17. DOI:
Waste to Energy for A Sustainable Future. (2021, December). Malaysian Investment Development Authority (MIDA). https://www.mida.gov.my/waste-to-energy-for-a-sustainable-future/
Young, W., Davis, M., McNeill, I. M., Malhotra, B., Russell, S., Unsworth, K., & Clegg, C. W. (2015). Changing behaviour: Successful environmental programmes in the workplace. Business Strategy and the Environment, 24(8), 689-703. DOI:
Yong, J. Y., Yusliza, M. Y., Jabbour, C. J. C., & Ahmad, N. H. (2019). Exploratory cases on the interplay between green human resource management and advanced green manufacturing in light of the Ability-Motivation-Opportunity theory. Journal of Management Development, 39(1), 31-49. DOI:
Yu, W., Chavez, R., Feng, M., Wong, C. Y., & Fynes, B. (2020). Green human resource management and environmental cooperation: An ability-motivation-opportunity and contingency perspective. International Journal of Production Economics, 219, 224–235. DOI:
Yusoff, M. S. B., & Department of Medical Education, School of Medical Sciences, Universiti Sains Malaysia, MALAYSIA. (2019). ABC of Content Validation and Content Validity Index Calculation. Education in Medicine Journal, 11(2), 49-54. DOI: 10.21315/eimj2019.11.2.6
Zelt, S., Recker, J., Schmiedel, T., & vom Brocke, J. (2018). Development and validation of an instrument to measure and manage organisational process variety. PLoS ONE, 13(10). DOI:
Copyright information

This work is licensed under a Creative Commons Attribution-NonCommercial-NoDerivatives 4.0 International License.
About this article
Publication Date
18 August 2023
Article Doi
eBook ISBN
978-1-80296-963-4
Publisher
European Publisher
Volume
1
Print ISBN (optional)
-
Edition Number
1st Edition
Pages
1-1050
Subjects
Multi-disciplinary, Accounting, Finance, Economics, Business Management, Marketing, Entrepreneurship, Social Studies
Cite this article as:
Jalil, N. J., Sapingi, R., Muslim, N. A., & Issa, M. R. (2023). Content Validation and Reliability Study of Workplace Solid Waste Segregation Behaviour. In A. H. Jaaffar, S. Buniamin, N. R. A. Rahman, N. S. Othman, N. Mohammad, S. Kasavan, N. E. A. B. Mohamad, Z. M. Saad, F. A. Ghani, & N. I. N. Redzuan (Eds.), Accelerating Transformation towards Sustainable and Resilient Business: Lessons Learned from the COVID-19 Crisis, vol 1. European Proceedings of Finance and Economics (pp. 563-580). European Publisher. https://doi.org/10.15405/epfe.23081.50