GIS-Monitoring of Regional Transport Network
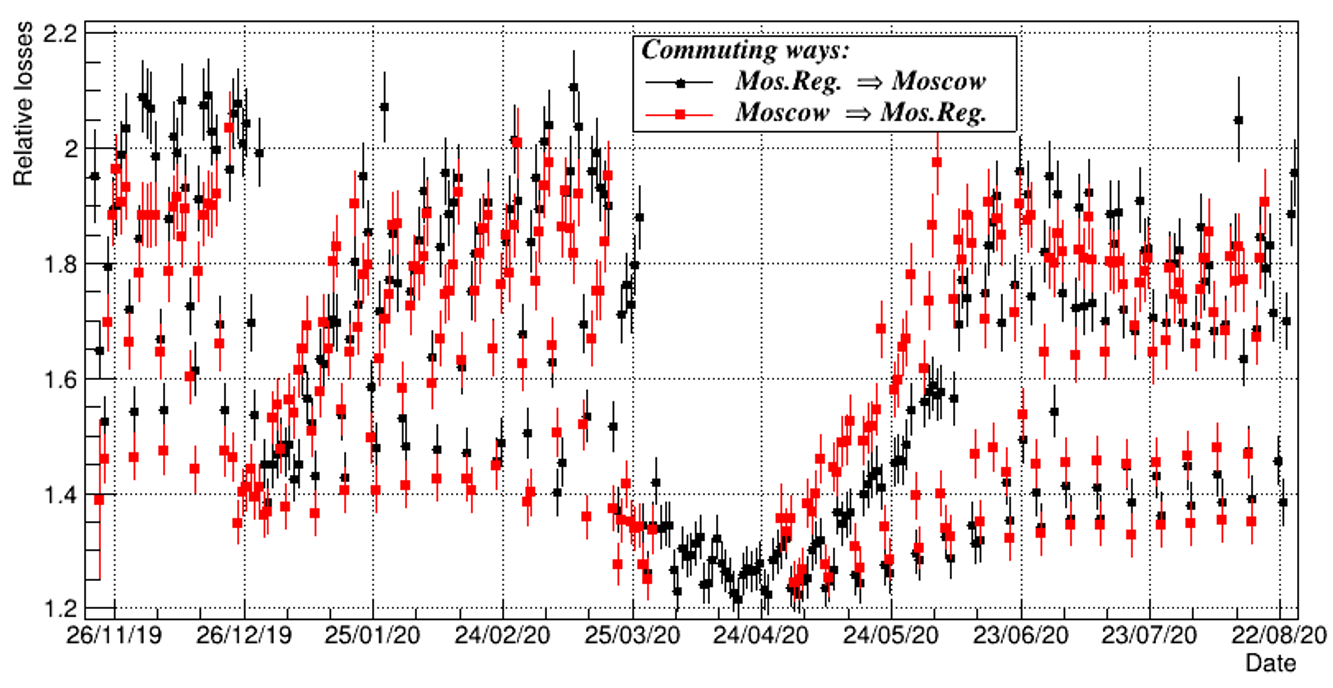
Figure 6: Average daily travel time losses due to traffic jams (black dots - center-area, red dots - center-area). On the vertical axis, the ratio of losses in comparison with a trip without traffic jams, calculated by formula (1b)