
GIS-Monitoring of Regional Transport Network


Abstract
The work is devoted to GIS-monitoring of the transport network of the Moscow metropolitan area (MMA). This direction is an actual trend in the modern regional economy, as it can be seen from a brief overview of the scientific publications presented in work. Special software has been developed for the automatic collection, accumulation, and processing of data on MMA commuters (a sample of 20 thousand virtual people living at a distance of up to 80 km from Moscow) from the region to the center. Data is collected hourly through the Yandex platforms (Maps and Traffic), which allows us to monitor the regional transport network's load status in time and space. Indicators of commuter's losses are discussed, and an analysis of time and financial losses of MMA commuters is carried out. The methods of collecting, storing, and analyzing the data are described, as well as the first results obtained are presented. Prospects for further work are discussed.
Keywords: Big DatacommutingGISregional economytransport
Introduction
The use of GIS technologies for the scientific analysis of transport systems in general, and commuting in particular, continues to be a popular trend. In particular, for an extensive overview of studies using GIS data (Blind et al., 2018). Dauth and Haller (2016) investigated changes in wages depending on home-work distance (due to job change). The source is data from the German federal agency, which included the exact coordinates of housing and work coordinates, and the distance was considered in the GIS platform OpenStreetMap Routing Machine as the shortest distance to travel between points. Based on the same data, Heuermann et al. (2017) investigated employer compensation for center-periphery commuting travel.
Frimmel et al. (2017); Paetzold and Winner (2016) combined tax data from the Austrian Ministry of Finance and employee-employer data from the Austrian Social Security Database. The GIS system was used to calculate the travel distance to work based on the employee's zip codes and the employer (the geographic center of the region was taken for each index). The honesty of employees' declaration of tax benefits for MTM was investigated. As a result, the travel length was overstated in 30% of declarations!
A standard GIS system offers commuting routing with a single vehicle. Djurhuus et al. (2016) propose the implementation of multimodal commuting trips (more than one mode of transport) by integrating information from the planner (timetables) into GIS using SQL. This approach has been successfully applied in Denmark's metropolitan area with very complex multimodal commuting trips: bus, train, light metro, metro, ferry, bicycle, and walking for 30 thousand people.
In (Obaco et al., 2016), GIS systems (QGIS and Stata) were used to define cluster functional urban areas in Ecuador. GIS was used to determine the length and time of travel between given geo-coordinates. In (Rehak & Kacer, 2018), the GIS system is used to assess the proximity of Bratislava districts (according to simulated routes (time and length) from the district to the center using the Google Map API) to the center for the subsequent comparison of this indicator with housing prices determined by sales proposals on the Internet.
The variety of applications demonstrates the fact that GIS technology has evolved into a powerful data analysis tool in economic research. Its use for analyzing the transport network will be discussed below.
Monitoring the region's transport network using modern digital technologies is a strategical direction of the development for a modern metropolis within the framework of the concept of a "smart city". Increasing the mobility of the population, the quality of urban infrastructure, and the quality of management of the urban environment are among the hot topics and important applied problems of the modern regional economy.
Problem Statement
Monitoring the region's transport network using modern digital technologies is a strategical direction of the development for a modern metropolis within the framework of the concept of a "smart city". Increasing the mobility of the population, the quality of urban infrastructure, and the quality of management of the urban environment are among the hot topics and important applied problems of the modern regional economy.
Attempts to build smart city subsystems are being carried out in the world's leading cities (Barcelona, New York, London, Beijing, Moscow, etc.). Permanent monitoring and analysis of the quality of the transport system in the region is in current scientific research. An increasing number of objects of the system (public and private transport, roads, bridges, tunnels, etc.) are equipped with inexpensive GPS devices for recording information (photo and video recorders), which, being used massively (using Big Data technology), will allow conducting a global analysis of the traffic situation. If earlier such studies were quite expensive (Scharenbroich et al., 2009; Zhu & Levinson, 2015), then in the future, their cost will decrease as the cost of the final recording devices becomes significantly cheaper. GIS technologies have been used to construct commuters' traffic flows in New York and Amsterdam (Arribas-Bel & Michiel, 2012). GIS analysis was used to assess the correlation of business geography with the levels of development of territories and infrastructure in India (Vaz, 2013). An interesting and well-developed GIS study was the analysis of the impact on the external environment depending on commuting trips, transport alternatives of models and traffic scenarios based on data from a special transport study by Vodafone, which covered 1829 respondents (Wood, 2003). An interesting analysis of daytime pictures of workers' trips in Flanders (a polycentric agglomeration in the north of Belgium, (Dalton et al., 2015), where the difference in travel times of people during and outside rush hour was investigated, while the routes were simulated in a GIS program.
Overall, it is clear that the collection of big data on the transport network will only grow. Finally, the smartphone became the main generator of data (GPS-sensor, which is always with you!). Mobile telecom operators have complete information about users' mobility, and this data is already used for scientific data analysis (Makhrova et al., 2016).
Thus, the proposed methodology is in the modern mainstream of using big data obtained online. It will be discussed in detail below.
Research Questions
Data from the monitoring of the transport network by residents will allow us to study several topical scientific issues.
Investigation of the cyclicality of the transport network load at different time scales - day, week, month, year. In this case, the qualitative nature will be determined, but quantitative estimates of the process parameters will be made.
Estimation of time and financial losses incurred by the region as a whole, and people in particular, from traffic jams.
Analyse the spatial structure and temporal dynamics of the process.
Learn to predict the transport network state based on the available data using innovative machine learning technologies (a task in the long term).
Purpose of the Study
The Yandex.Maps and Yandex.Traffic web platforms (Yandex Map Platform, 2020; Yandex Traffic Platform, 2020) calculate user-specified traffic routes with and without traffic jams via API (application program interface) in real time. Starting the Yandex.Traffic service, the user sees the state of the transport system only for his route (Figure
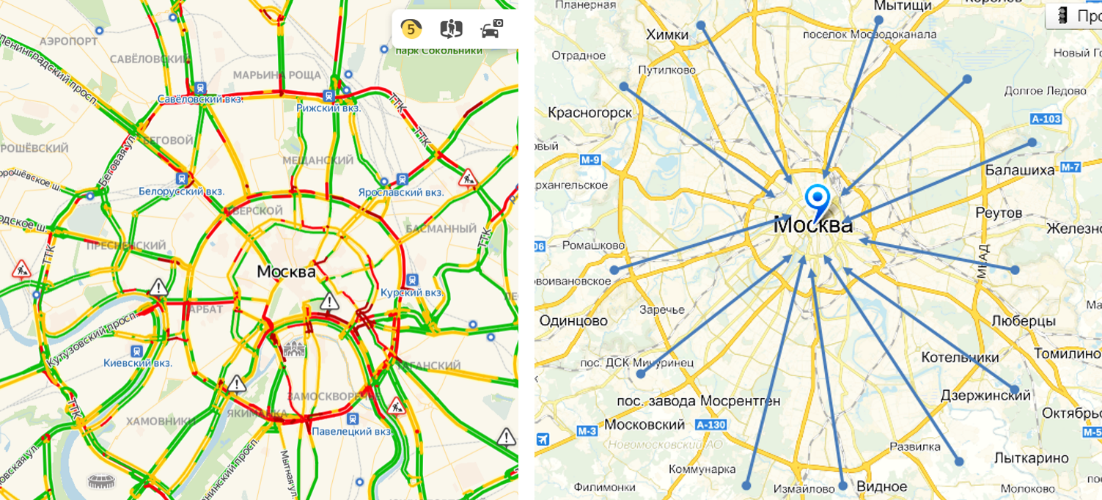
The purpose of our project is to capture information simultaneously for thousands of virtual users dispersed throughout the region in order to assess the situation with the transport network as a whole. And, accordingly, assess the macroeconomic effect of traffic jams for each resident in particular and the region's economy as a whole.
Next, we move on to a detailed presentation of the research methodology.
Research Methods
The methodology is based on generating a basic fixed set of commuters whose home-job paths cover the region of interest (the MMA in this work). And further, regular in time (in this work, hourly) collection of information about the home-work-home paths for all commuters from the basic set. The last step is to analyse the time series accumulated from the base set of commuters.
Base set and controlled region
The base set includes a set of N virtual commuters with places of residence and work defined by geographic coordinates (latitude and longitude) on the map (GIS coordinates). It makes no sense to set the coordinates of real people (hence virtualization), since the Yandex.Maps router builds a route along real roads between any two points specified on the map, which is what we need. The main thing is that the places of residence and work of virtual people in the base sample should be chosen in such a way that their home-work routes would evenly cover the transport network of the study area, for example, the Moscow Ring Road (Figure
Size of base sample
Base sample size is a trade-off between precision and the complexity of large data. The main problem is that the Yandex platform bans the user's IP due to a large number of requests treating it as a DDOS hacker (Hulme, 2020). As a result, the sample size should not exceed 20 thousand people, while it is necessary to take measures to parallelize the data collection process.
Basic set fixation
The basic sample is specially fixed for a set of correct time series by analogy with a fixed sample of panel research respondents. The collection of a fixed set allows you to analyse the temporal dynamics of data obtained by statistical methods at any time scale, from minutes to years.
Generated base sample
The basic sample for the Moscow agglomeration was generated from 20 thousand virtual MMA commuters living at a distance of 20, 50 and 80 km from the centre of Moscow city, specified by the GIS coordinate C0 = (55.7520,37.6166), and their places of work were selected within a radius of 5 km from the centre Moscow (Figure
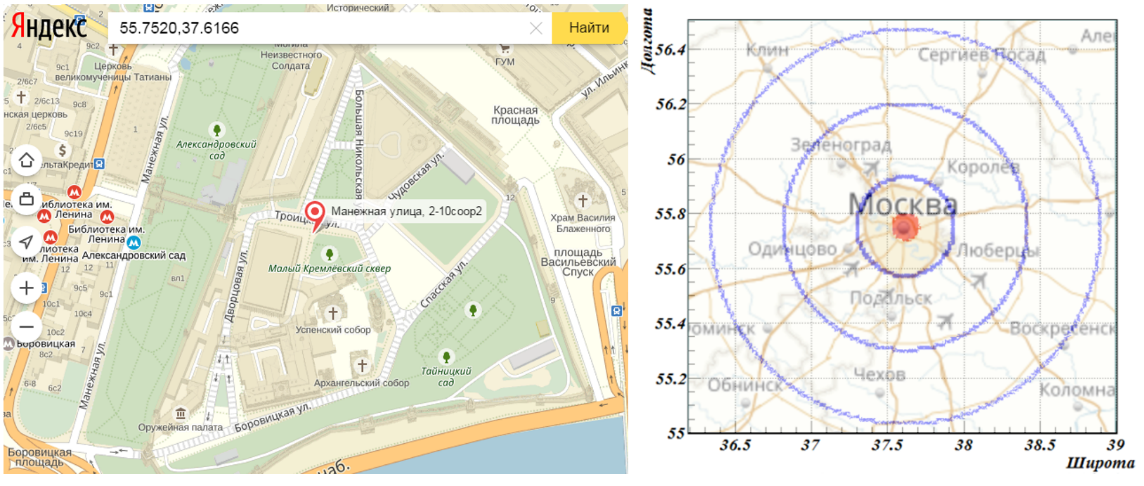
Thus, the routes of the basic sample evenly cover the region-centre radial roads within a radius of 80 km from Moscow. In doing so, we cover three main types of citizen who make short, medium and long commuting trips, in order to compare the performance of these three groups of commuters.
Data collection
Specially developed software is used to collect information (the method was developed by us, RFBR grants No. 11-06-00323 and No. 14-06-00249). For each person from the basic sample the home-work-home paths are reconstructed through Yandex.Maps API (Figure
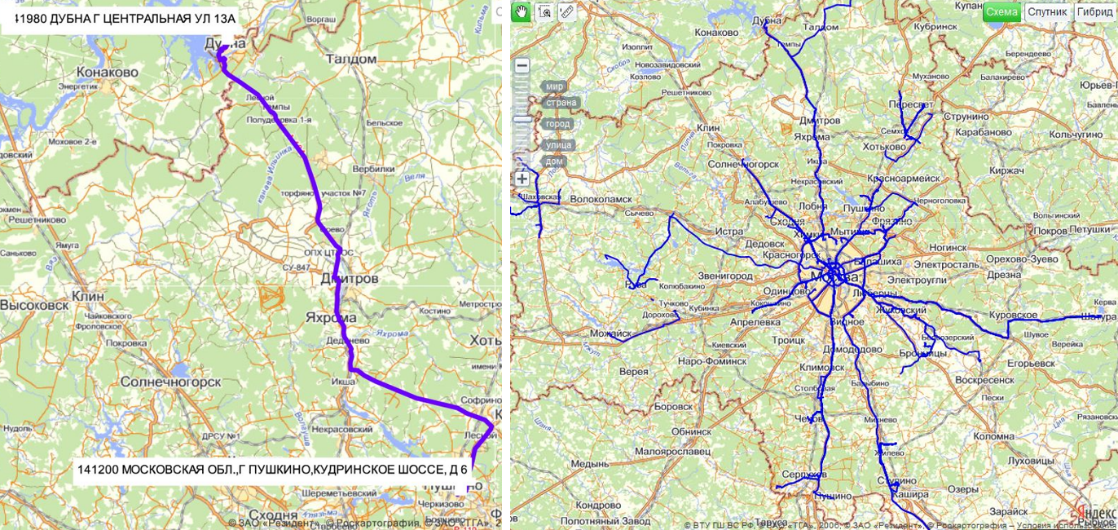
The database stores routing date and time, route length and travel times with and without traffic jams. The program is called hourly in automatic mode using standard operating system tools. More frequent calls can again be the reason for blocking. Collecting data on an hourly basis is a reasonable compromise, as it allows you to investigate the state of the roads with an accuracy of about an hour (24 points per day for assessing dynamics).
Indicators
The collected data allows the calculation of a variety of indicators. Here we use the simplest two - the specific
(1a)
(1b)
where and are times with and without traffic jams, respectively, and is the total length of the route. Dimensional indicator (typical unit is min/km) is used for quantitative estimates, while dimensionless indicator is convenient for visualization of time series.
Further, in a natural way, you can use aggregation, in particular, the average time loss over the sample at the j-th moment of time:
(2)
Since the base sample is fixed, the time series of indicator (2):
(3)
shows the temporal dynamics of the status of the transport network in the region covered by the routes of the base sample.
Finally, the basic sample of people can be studied not only as a whole, but also in the context of a number of variables:
(4)
where
The first results obtained during the development and implementation of the method described above are discussed below.
Findings
The accumulation of data according to the procedure described above was launched in September 2015, this work presents the results of processing the data accumulated up to February 2020 - more than 500 million records.
Commuting times and losses
Commuting times and losses for the three study groups of the base sample are presented in Figure
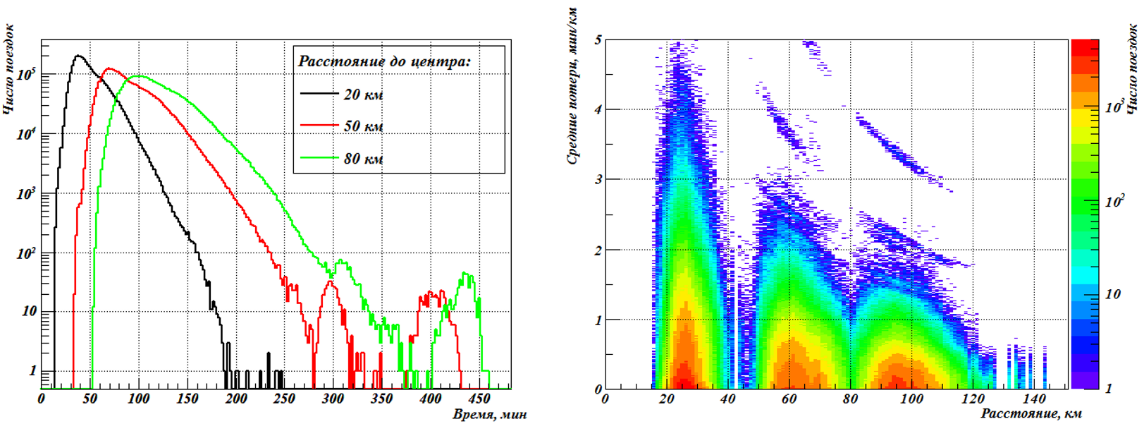
As can be seen from Figure
Traffic network loading patterns have a pronounced cyclical nature, and in two different time frames at once - within a day and a week. Further we show the results of the first group of commuters living 20 km from the centre. We have the longest time series for this group, and the analysis of the remaining groups is planned in the future.
Intraday cycle
The intraday transport network load cycle is shown in Figure 5a. The graph clearly shows peak loads at 6-10 hours in the direction from the region to Moscow. And return rush hours in the evening from 16-19 hours are in the opposite direction.
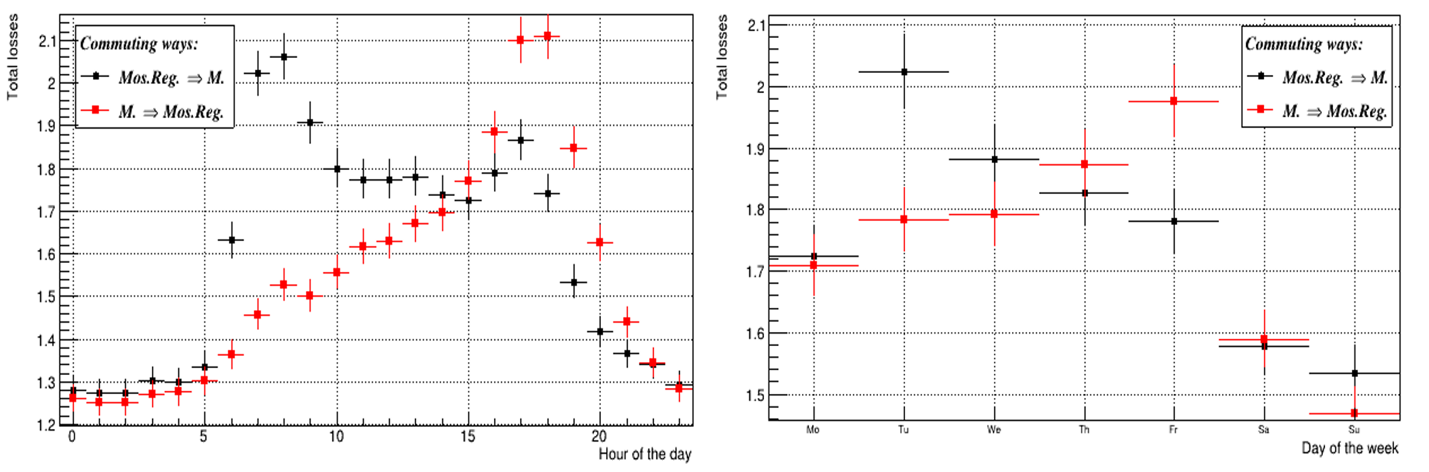
Intraweek cycle
Intraweek cycle is shown in Figure 5b, which demonstrates the classic picture of less traffic on the weekend. The increased load at the exit from Moscow on Friday and at the entrance to Moscow on Tuesday is associated with "dacha traffic".
Dynamics of commuting time losses
Average relative intraday commuting time losses due to traffic jams from December 2019 to August 2020 are shown in Figure
At the end of March, strict restrictions were announced in Moscow and the region due to coronavirus infection. And we see that during the month from the end of March to the end of April 2020, the loss of traffic was minimal - the loss of time was kept to a minimum.
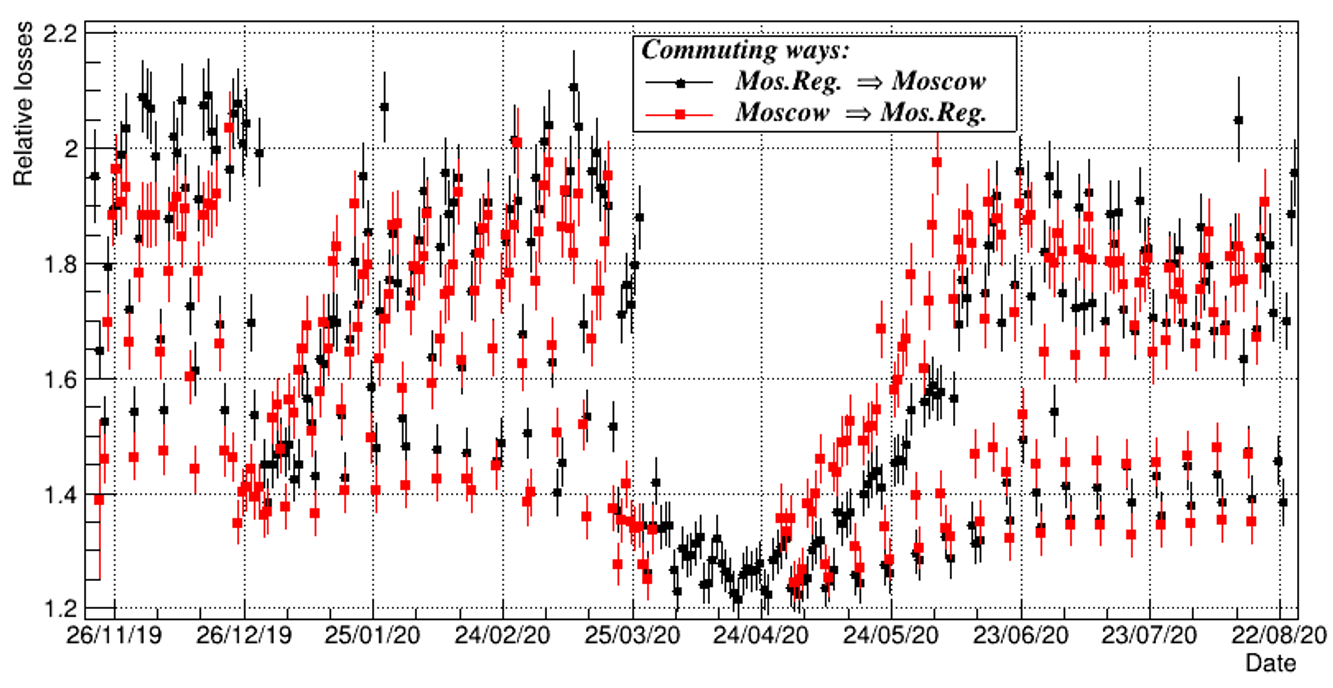
The recovery of traffic on the roads of the Moscow region took place throughout the May-June 2020, while during this period the difficulties in entering Moscow exceeded the load on leaving the centre. After the recovery of usual activity in Jule 2020, the situation has been returned to its previous picture: traffic jams at the exit from the centre overcome the difficulties in entering Moscow. Finally, there is a growing dynamic in the gap between travel on weekdays and weekends.
Conclusion
This paper presents the results of the original methodology of continuous GIS monitoring of the transport network of the Moscow agglomeration. The methodology for collecting, accumulating, storing and processing GIS information received from the online platforms Yandex.Maps and Yandex.Traffic is described, as well as the quantitative results of the analysis. A software package has been developed, with the help of which the transport network is automatically monitored in real time.
The technique is scalable, the value of the data grows as it accumulates. In the future, it is planned to use Big Data techniques for forecasting purposes. Besides, visualization and online monitoring and automatic publication of the results are planned.
In conclusion, we emphasize that GIS analysis of transport data is an actual modern trend in scientific research and commercial projects. With its unique data and methodology, this work is in trend, at the forefront of research in this scientific direction.
Acknowledgments
This work was supported by the Russian Foundation for Basic Research under Grant No. RFBR-19-010-00794.
References
- Arribas-Bel, D., & Michiel, G. (2012). Featured graphic. Monocentricity? Commuting flows visually Environment and Planning, А44, 2041-2042.
- Blind, I., Dahlberg, M., Engström, G., & Östhet, J. (2018). Construction of Register-based Commuting Measures. CESifo Economic Studies, 64, 292-326.
- Dalton, A. M., Jones, A. P., Panter, J., & Ogilvie, D. (2015). Are GIS-modelled routes a useful proxy for the actual routes followed by commuters? Journal of Transport & Health, 2, 219-229. DOI:
- Dauth, W., & Haller, P. (2016). The Valuation of Changes in Commuting Distances: An Analysis Using Georeferenced Data. IAB Discussion Paper, 43. http://doku.iab.de/discussionpapers/2016/dp4316.pdf
- Djurhuus, S., Hansen, H. S., Aadahl, M., & Glümer, C. (2016). Building a multimodal network and determining individual accessibility by public transportation. Environment and Planning B: Planning and Design, 43, 210–227. https://doi.org/10.1177%2F0265813515602594
- Frimmel, W., Halla, M., & Paetzold, J. (2017). The Intergenerational Causal Effect of Tax Evasion: Evidence from the Commuter Tax Allowance in Austria. Working Papers, 2017-01. https://www2.uibk.ac.at/downloads/c4041030/wpaper/2017-01.pdf
- Heuermann, D. F., Assmann, F., Berge, Ph., & Freund, F. (2017). The Distributional Effect of Commuting Subsidies - Evidence from Geo-Referenced Data and a Large-Scale Policy Reform. Regional Science and Urban Economics, 67, 11–24.
- Hulme, G. V. (2020, July 2). DDoS explained: How distributed denial of service attacks are evolving. https://www.csoonline.com/article/3222095/ddos-explained-how-denial-of-service-attacks-are-evolving.html
- Makhrova, A. G., Kirillov, P. L., & Bochkarev, A. N. (2016). Mayatnikovyye trudovyye migratsii naseleniya v Moskovskoy aglomeratsii: opyt otsenok potokov s ispol'zovaniyem dannykh sotovykh operatorov [Commuting of the Population in the Moscow Agglomeration: Experience in Estimating Flows Using Data from Cellular Operators]. Regional Studies, 3(53), 71-82.
- Obaco, M., Royuela, V., & Vítores, X. (2016). Computing functional urban areas using a hierarchical travel time approach. 56th Congress of the European Regional Science Association: "Cities & Regions: Smart, Sustainable, Inclusive?", 23-26. http://www-sre.wu.ac.at/ersa/ersaconfs/ersa16/Paper238_MoisesObaco.pdf
- Paetzold, J., & Winner, H. (2016). Taking the High Road? Compliance with Commuter Tax Allowances and the Role of Evasion Spillovers. Journal of Public Economics, 143, 1–14.
- Rehak, S., & Kacer, M. (2018). Estimating distance gradient in Bratislava with different types of distance measurements. European Real Estate Society (ERES). https://eres.architexturez.net/doc/oai-eres-id-eres2018-259.
- Scharenbroich, M., Iacono, M., & Levinson, D. M. (2009). How local is travel? SSRN Electronic Journal.
- Vaz, E. (2013). Spatial Business Landscape of India. Journal of Spatial and Organizational Dynamics, 1(4), 241-253. http://www.cieo.pt/journal/J_4/article2.pdf
- Wood, G. (2003). Modelling the ecological footprint of green travel plans using GIS and network analysis: from metaphor to management tool? Environment and Planning B: Planning and Design, 30, 523-540. https://doi.org/10.1068%2Fb12995
- Yandex Map Platform (2020, September 15). https://yandex.ru/maps
- Yandex Traffic Platform (2020, September 15). http://maps.yandex.ru/traffic
- Zhu, S., & Levinson, D. M. (2015). Do people use the shortest path? An empirical test of Wardrop's first principle. PLoS ONE, 10(8), e0134322.
Copyright information

This work is licensed under a Creative Commons Attribution-NonCommercial-NoDerivatives 4.0 International License.
About this article
Publication Date
16 April 2021
Article Doi
eBook ISBN
978-1-80296-104-1
Publisher
European Publisher
Volume
105
Print ISBN (optional)
-
Edition Number
1st Edition
Pages
1-1250
Subjects
Sustainable Development, Socio-Economic Systems, Competitiveness, Economy of Region, Human Development
Cite this article as:
Shitova, Y., Shitov, Y., Vlasov, D., Mitroshin, A., & Mitroshin, P. (2021). GIS-Monitoring of Regional Transport Network. In E. Popov, V. Barkhatov, V. D. Pham, & D. Pletnev (Eds.), Competitiveness and the Development of Socio-Economic Systems, vol 105. European Proceedings of Social and Behavioural Sciences (pp. 916-926). European Publisher. https://doi.org/10.15405/epsbs.2021.04.97