
Spatial Aspect In The Volume Of Marketable Food Products


Abstract
Food supplies meet the basic human needs for food. The system of their production and delivery to the places of consumption determines this need's degree of satisfaction. The study aims to assess the impact of wholesale trade development and identify spatial effects on the variability of marketable food products' volume. The analysis was performed using hierarchical spatial autoregressive models (HSAR). This method allows analysing indicators within several data aggregation (municipality, region) and highlighting spatial effects. The analysis is carried out in 2,319 municipalities included in 84 subjects of the Russian Federation in 2018. The results show that HSAR model describes processes better than the hierarchical linear model ignoring spatial interactions. Using the hierarchical linear modelling tools, the paper analyses the indicators aggregated at two territorial division (municipality, region). HSAR model amplifies the results obtained by evaluating spatial iterations by applying a spatial matrix at the regional level. As a result, the analysis takes into account both spatial heterogeneity and data nesting. The constructed model shows that the volume of income transfers to the population and taxable income, the wholesale turnover, as well as the development of neighboring areas, have a positive impact on the volume of marketable food products in municipalities. The proposed approach to analysis improves the quality of decisions when determining the location of enterprises, as well as allows for a better approach to the area development by state authorities.
Keywords: Food productshierarchical spatial autoregressive modelsspatial interactionswholesale trade
Introduction
The volume of marketable food products shows the volume of food products sold to end-users, including flour products, meat, vegetables, and fruits. Food products meet the essential need – the need for food. However, due to climatic conditions, it is not always possible to produce the necessary food products in places where people live. In the far North, it is costly to grow food products even in greenhouses. The problem of high production costs also arises in the processing industry, which is associated with the need to heat production facilities almost all year round. The mismatch between places of production and consumption occurs not only in areas with very low temperatures (for example, Russia, Canada, the Netherlands) and in hot countries (for example, Australia, Africa). Wholesale companies solve the problem of moving goods from producer regions to consumer regions. They deliver products produced in other territories to these areas for subsequent sale to retail enterprises at their own expense and risk. However, it is not only wholesale enterprises' functioning that is important for saturating the market with goods. A positive influence is provided by the proximity to territories that are more favorable for food production. The closer such territories are located, the more accessible products become to the population.
This work is of interest to wholesale and manufacturing companies seeking to expand their sales markets. Much research shows interest in determining such enterprises' optimal location (Ge et al., 2019; Ketokivi et al., 2017; Quynh et al., 2020). Scientists also note the role that policy plays in influencing location decisions (Holmes & Stevens, 2004; Zheng & Shi, 2018). Therefore, the study of the spatial aspect in the volume of marketable food products is essential not only for organizations but also for public authorities. This economic analysis can guide territorial development plans for enterprises, municipalities, and regions.
Problem Statement
In practice, quite often there are situations in which the place of residence does not coincide with producing goods that people buy for consumption. The mismatch between production and consumption is not only related to territorial gaps. There are gaps in time associated with the maturation of vegetables, fruits, and other plants used in food products production. In these conditions, the question arises of the most effective products from places of production to places of consumption (Etemadnia et al., 2015; Holl & Mariotti, 2017). Wholesale companies play an essential role in this. They direct the flow of goods to the final consumer, occupying an intermediate position between the manufacturing and retail sectors in the distribution channel. They impact the performance of producers (Cook et al., 2011) and the satisfaction of the population with goods (Sadigh et al., 2013). Scientists studied the issues of placing wholesale enterprises in different perspectives. Philbrick (2005) singled out wholesale as part of the idealized seven-fold nested areal hierarchy of economic functions. Tian and Zhang (2019) analyzed spatial correlations of the logistics industry. Di Berardino et al. (2017) investigate the relationship between distributive trade (wholesale and retail trade) and productivity growth. Other scientists have searched for optimal wholesalers and regional fresh production facilities regarding the production, import, and consumption of fresh products (Ge et al., 2018). The main drawback of these studies is that they attempt to assess wholesale trade's relationship with the results of producers and consumers of goods without taking into account the spatial interaction that occurs between wholesalers in the distribution channel or only spatial interactions. A natural obstacle for the generalized analysis until quite recently was a different data aggregation. If consumption can be estimated at the local level, then wholesale usually covers a group of areas, serving the flow of goods in the distribution channel between them. Thus, it was necessary to compare the regions and municipalities' data, which complicates the model quality assessment.
Hierarchical spatial autoregressive models (HSAR) allows assessing the relationship between the volume of food sales and the development of wholesale trade, with the allocation of spatial effects. However, this requires the data to be nested and have spatial dependencies (Cellmer et al., 2019). The hierarchical dependence of data describing the volume of marketable food products carried out at the level of municipalities and wholesale trade at the level of regions has been noted repeatedly. Some noted the multilevel process (Sadigh et al., 2013) and the hierarchy of supply chain (Kichikawa et al., 2019); others noted the hierarchy of functional areas (Philbrick, 2005). Thus, on the one hand, the hierarchical relationship is manifested in the wholesale-retail-consumer sequence, in which revenue determines retail sales, and retail sales depend on the goods delivered in bulk. On the other hand, there is a hierarchy of areas in which the consumption of food products in municipalities depends on the wholesale shipments delivered to the region they belong to. As for spatial relationships, they are manifested directly in the consumption, production, and distribution process (Fan & Liu, 2020; Hylton & Ross, 2017; Khushi et al., 2020; Ye & Wei, 2005). Scientists note that the high spatial autocorrelation of within-district gaps of food production and consumption observed in the province indicates that inequality is driven by location dynamics (Khushi et al., 2020).
Thus, HSARs allow analysing the volume of marketable food products in municipalities. However, data on wholesale trade turnover is aggregated at the level of the region in which municipalities are included and data on personal income at the municipalities' level in the regions. Wholesale trade aggregation at the regional level is since wholesale enterprises supply goods in large quantities for a group of municipalities, rather than for each of them. The proposed method also allows taking into account the proximity to other regions, including those located in more favorable climatic conditions suitable for the production of food products.
Research Questions
Several vital issues can be highlighted in this study. First, it is necessary to determine how much municipalities' variability in the volume of marketable food products is related to the municipal districts. Perhaps in this variation, it matters which region the municipality is located in (H1). The next question is related to assessing how much the volume of marketable food products depends on income transfers to the population and taxable income since they affect demand (H2). Further, the model can be used to estimate the impact of wholesale enterprises' activities on the volume of marketable food products in the region (H3). Finally, whether the development of neighboring territories has a positive effect on the volume of marketable food products (H4).
Purpose of the Study
This study aims to assess the impact of wholesale trade development and identify spatial effects on the variability of the volume of marketable food products.
Research Methods
Several models are built sequentially in this work. At the first step, a null hierarchical linear model (HLM) is built, which does not include independent variables and does not evaluate spatial effects. The within-group and between-group variations calculated during its construction allow estimating the intraclass correlation coefficient (ICC) (Raudenbush et al., 2011). This coefficient allows determining the region's share in the variability of the indicator at the municipal level. The null model is also used for comparison with subsequent models, making it possible to judge the significance of the factors involved. The full HSAR model includes predictors at the municipal (lower) and regional (upper) levels, and evaluates spatial interactions:
Level 1 (lower, municipalities):
(1)
Level 2 (upper, regions):
(2)
Spatial dependence:
(3)
where
– the volume of all marketable food products in retail trade per capita in the
– the volume of income transfers to the population and taxable income per capita in the
– regression coefficient associated with
– random error associated with the municipality
general intercept;
regression coefficient associated with
– indicator describing the volume of wholesale trade per capita in the
λ – parameters of spatial interactions;
– spatial weight matrix at the upper level (1 if neighbors are with a common boundary and 0 if another);
– vector of random effects for the absolute term;
– vector of random effects.
If λ=0, this will give the full HLM model without assessing spatial interactions. If , then the null HLM model is obtained.
The dependent variable in the model is the volume of all marketable food products in retail trade per capita in the i-th municipality of the j-th region of the Russian Federation (Figure
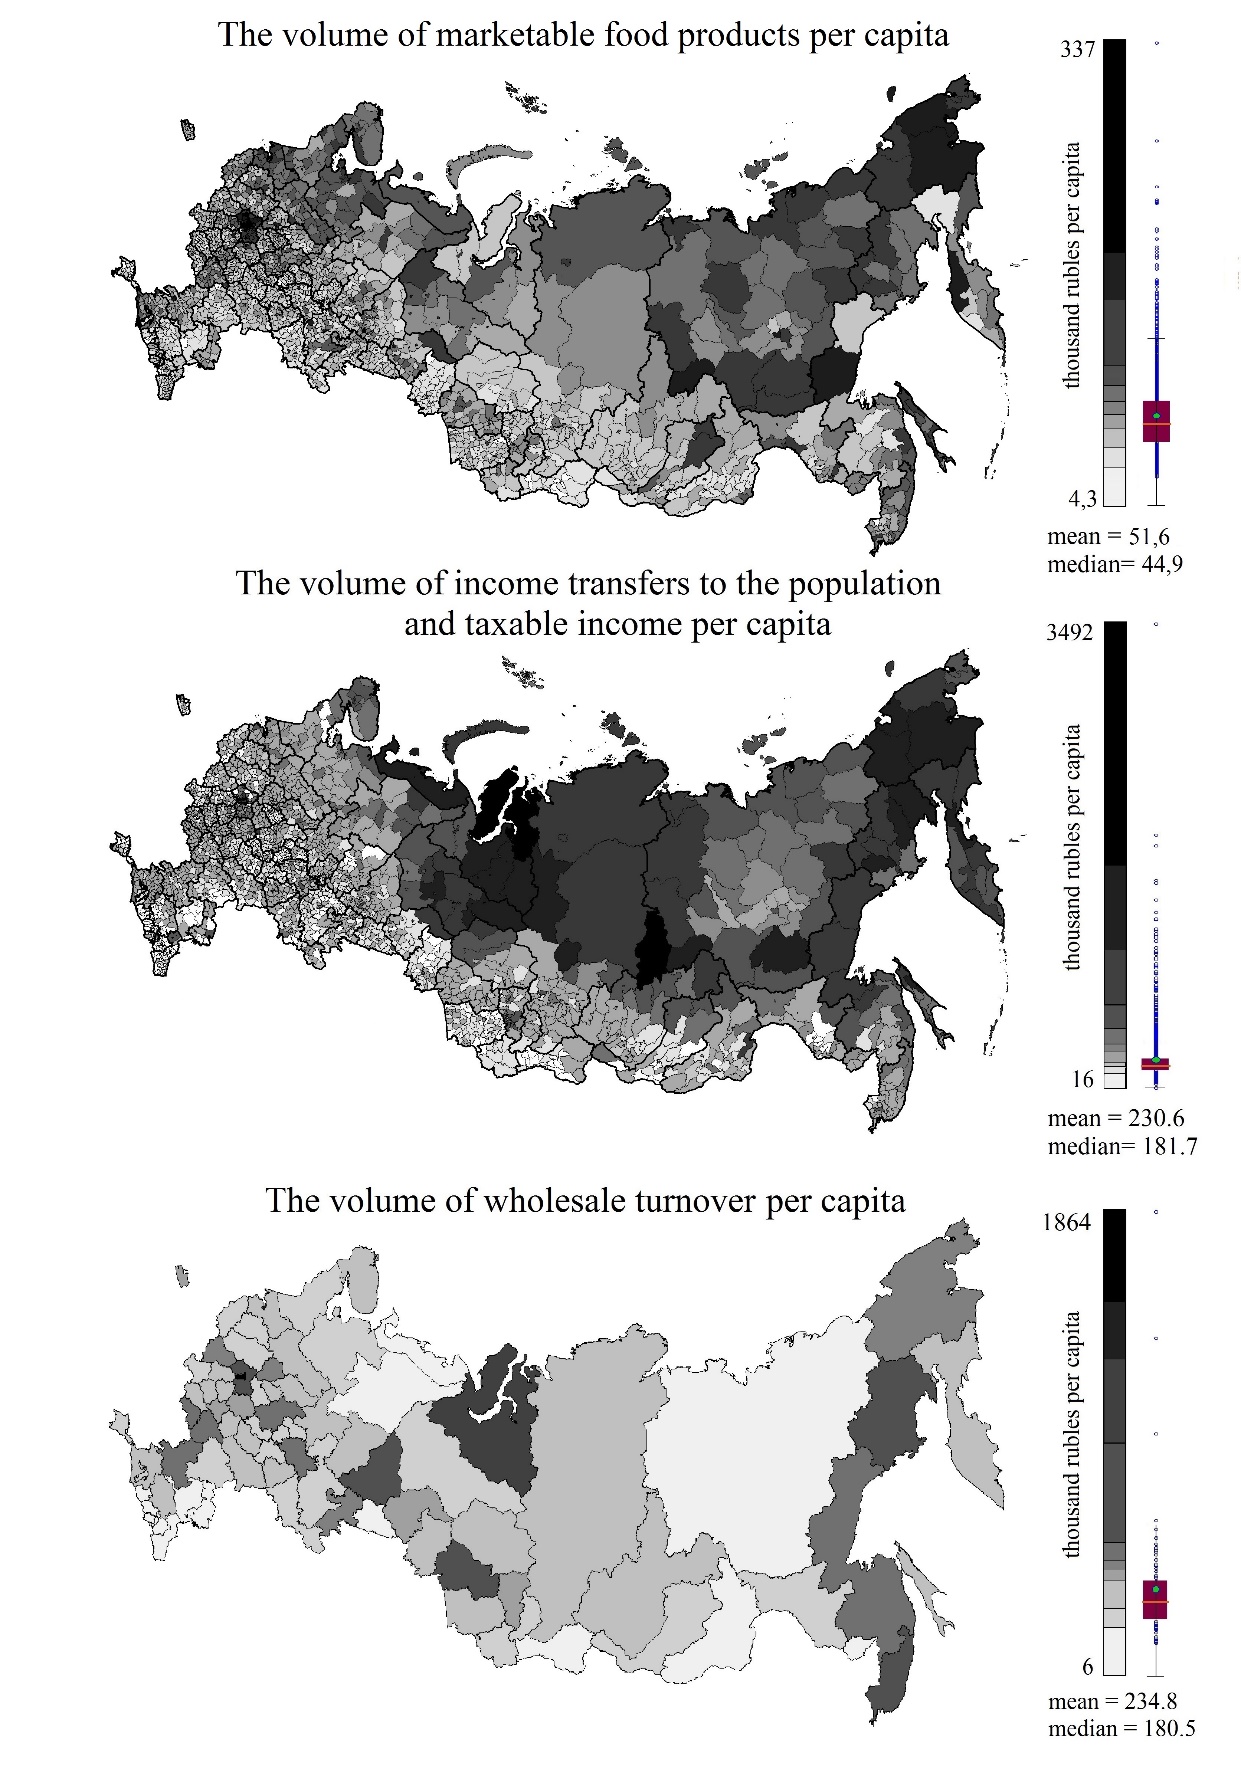
The volume of all marketable food products in retail trade is an indicator of the turnover of retail trade in food products, which is shown in the actual sales prices of such goods, including the marketing margin, value-added tax, and other mandatory payments. The formation of retail trade turnover in food products according to the methodology of the Federal State Statistics Service of the Russian Federation (Order 595 of October 7, 2016) is carried out using the computational method using data from current surveys on the forms of federal statistical observation and is determined as the result of the activities of trade entities located on the municipality.
The model includes a control variable at the lower level: the amount of income transfers to the population and taxable income in the i-th municipality included in the j-th region. It is a simplified analog of the macroeconomic indicator of personal monetary income and characterizes the amount of money received by the resident population within a municipal district (urban district), based on information contained in the accounting systems for population data generated by tax authorities (on the size of the tax base when calculating income tax for individuals and individual entrepreneurs), the Pension Fund of the Russian Federation (on the amount of pensions and benefits paid) and executive authorities of the subjects of the Russian Federation (on employment insurance paid, benefits paid when providing social support measures, and other types of targeted social assistance to the population). The inclusion of this variable as a reference at the lower level is determined by the significant impact of household income on demand and, consequently, the volume of marketable goods (Aganbegyan, 2017; Dai & Sulila, 2020).
At the top level, the model includes a predictor of wholesale trade turnover per capita. It shows the cost of shipped goods purchased earlier elsewhere for resale to legal entities and individual entrepreneurs for professional use (processing or further sale). It only shows the turnover of organizations having wholesale trade as the main economic activity. According to the methodology of the Federal State Statistics Service of the Russian Federation (Order 301 of June 24, 2016), it is shown in actual sales prices, including marketing margin, value-added tax, excise duty, export duty, customs duties, similar mandatory payments, and also includes the volume of activity not observed by direct statistical methods.
The model provides an estimate of the spatial error. Spatial effects can be determined by applying an adjacency matrix (W) that takes into account the proximity of first-order regions. When it was formed, the assumption was made that the Kaliningrad Region had a border with the city of Saint Petersburg and the Smolensk Region, with which it has sea and railway connections. This is done in order not to separate this territory from the central part of the country.
As a result, the model validates the assumption that the volume of marketable food products (FP) depends on a specific effect generated by the RF region, development of wholesale trade (D) in the region, personal income (I) in municipalities and the achieved values of indicators of neighboring regions.
Information sources: Federal State Statistics Service (https://www.gks.ru/dbscripts/munst/) and The Unified Interdepartmental Statistical Information System (https://www.fedstat.ru/). The analysis was based on data from 2,319 municipalities in 84 regions of the Russian Federation in 2018. Municipalities are defined as districts and cities in the Russian Federation.
Findings
The development of econometric tools allows taking into account the flows formed at different levels of administrative division and the spatial interactions of territories. This paper focuses on the interaction between producer regions and consumer regions through wholesale trade. The Russian Federation considered in this paper is characterized by various climatic conditions. There are identified areas of food production, mainly located in the South, in more favourable climatic conditions, where more land is suitable for growing vegetables, fruits, and livestock (Figure
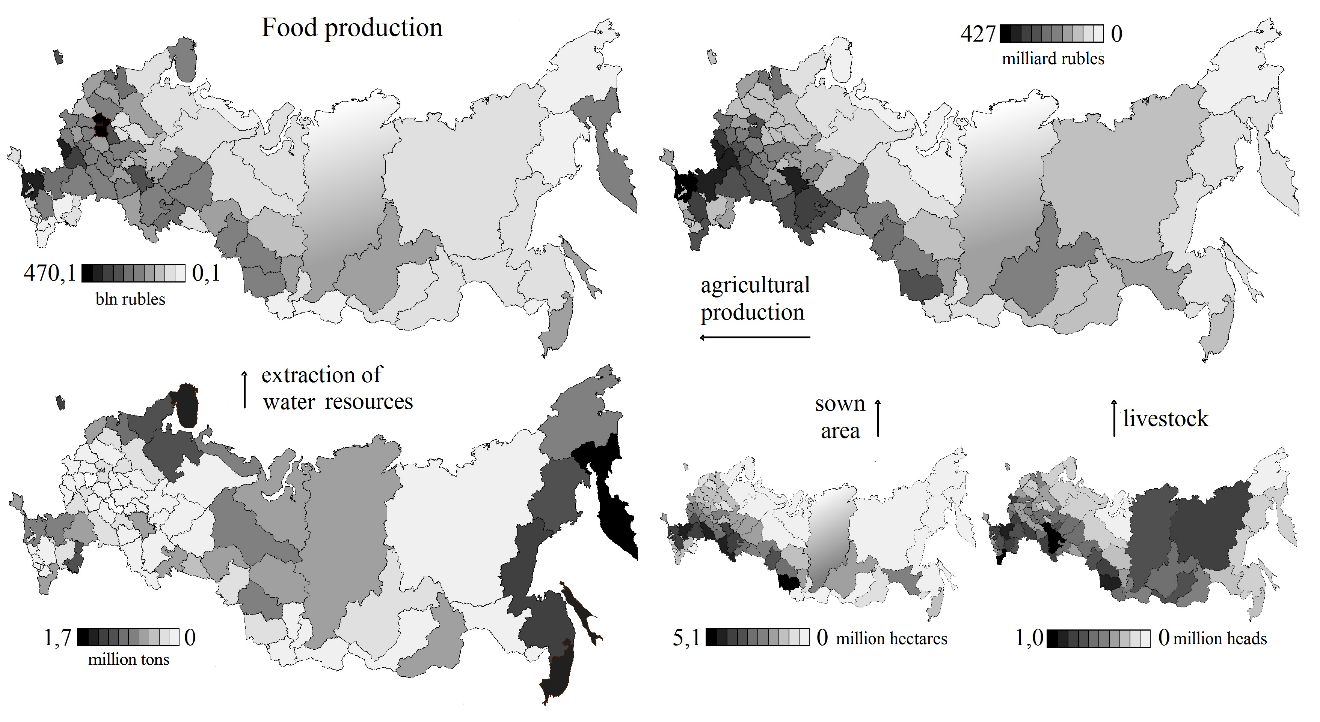
The function of delivering food products to the Northern territories is performed by wholesale trade. As can be seen in Figure
The constructed models allowed confirming the formulated hypotheses (Table
The calculation of the intraclass correlation coefficient (ICC) in the zero model showed that the upper level of the administrative division hierarchy significantly affected the values achieved by municipalities in the indicator "Volume of marketable food products per capita".
In the two-level model, the influence of the Russian Federation's subjects' level is 39%. That is, the variation in the value of the volume of marketable food products per capita is only 61% related to the characteristics of the municipalities, and the rest is determined by the region in which these municipalities are located. Thus, the H1 hypothesis is confirmed.
All factors included in the latter model and all intermediate models are significant. After factor variables were included, the ICC decreased to 22%, showing the unexplained part of the influence of the RF subjects. For further analysis, the values of the regression equation factors presented in Table
A positive value of the factors indicates a unidirectional change in the factors and the dependent variable, that is, with the growth of wholesaling and income sales of food products within the limits of municipal areas and city districts will increase. Thus, the H2 and H3 hypotheses are confirmed.
Including spatial interactions in the model allows assessing how neighboring territories' development affects the volume of marketable food products. A positive factor value indicates that the spatial environment has a positive effect (H4). The comparison test result showed that the latter model with a spatial component was better (χ2 statistic of 7.25, df = 1, p = 0.007).
Conclusion
This study allowed assessing the impact of wholesale trade development and identifying spatial effects in variations in marketable food products' volume. The constructed HSAM showed that the volume of social payments and personal income, the turnover of wholesale enterprises and distributors, as well as the development of neighboring areas, had a positive impact on the volume of marketable food products in municipalities. Consequently, with an increase in the level of personal income, food products' consumption will increase. The development of wholesale trade in wholesalers and distributors will contribute to markets' saturation with goods, contributing to higher demand satisfaction. At the same time, keeping the intercept value high enough indicates the presence of other essential factors not taken into account by the author. Highlighting the model error associated with spatial interactions indicates that there are factors determined by neighboring territories that affect the volume of marketable food products. Therefore, the subsequent analysis should also be directed to the study of these factors.
The advantage of the analysis is that the model simultaneously allows combining data aggregated at the municipalities' level and the region they belong to. Simultaneously, it allowed taking into account spatial effects, showing that changes do not occur separately. There are disadvantages of the study, which are determined by the peculiarities of data collection in Russia. The value of wholesale trade turnover includes data on both food and non-food products that are completely ready for consumption, and components, taking into account the results of work of both wholesalers and distributors, suppliers, and other organizations engaged in logistics management.
Despite the noted disadvantages, the model has many prospects for further application. It allows businesses and other stakeholders, including the state, to decide the location policy when forming a territory development plan.
Acknowledgments
The reported study was supported by the Ministry of Science and Higher Education of the Russian Federation (scientific code FZWU-2020-0027)
References
- Aganbegyan, A. G. (2017). Overcoming poverty and reducing the income and consumption inequalities in Russia. ECO Journal, 9(519), 66-84.
- Cellmer, R., Kobylińska, K., & Bełej, M. (2019). Application of Hierarchical Spatial Autoregressive Models to Develop Land Value Maps in Urbanized Areas. International Journal of Geo-Information, 8, 195.
- Cook, L. S., Heiser, D. R., & Sengupta, K. (2011). The moderating effect of supply chain role on the relationship between supply chain practices and performance. International Journal of Physical Distribution & Logistics Management, 41(2), 104-134. https://doi.org/10.1108/09600031111118521
- Dai, S. I. S., & Sulila, I. (2020). Purchase Power and Consumption Pattern Change of Society (Analysis of 34 Panel Data in Indonesia). Journal of Economics and Sustainable Developmen, 11(2). https://www.iiste.org/Journals/index.php/JEDS/article/view/51293/52993
- Di Berardino, C., D’Ingiullo, D., & Sarra, A. (2017). Distributive trade and regional productivity growth. The Service Industries Journal, 37(13-14), 833-857. https://doi.org/10.1080/02642069.2017.1359261
- Etemadnia, H., Goetz, S. J., Canning, P., & Tavallali, M. S. (2015). Optimal wholesale facilities location within the fruit and vegetables supply chain with bimodal transportation options: An LP-MIP heuristic approach. European Journal of Operational Research, 244(2), 648-661. https://doi.org/10.1016/j.ejor.2015.01.044
- Fan, X., & Liu, H. (2020). Global supply chain shifting: A macro sense of production relocation based on multi-regional input-output table. Economic Modelling. https://doi.org/10.1016/j.econmod.2020.02.009
- Ge, H., Canning, P., Goetz, S., Perez, A., & Li, J. (2019). Embedding Economies of Scale Concepts in the Model of Optimal Locations of Fresh Produce Aggregation Hubs. Agricultural and Resource Economics Review, 1-23. https://doi.org/10.1017/age.2019.10
- Ge, H., Goetz, S., Canning, P., & Perez, A. (2018). Optimal locations of fresh produce aggregation facilities in the United States with scale economies. International Journal of Production Economics, 197, 143-157. https://doi.org/10.1016/j.ijpe.2018.01.007
- Holl, A., & Mariotti, I. (2017). The Geography of Logistics Firm Location: The Role of Accessibility. Networks and Spatial Economics, 18(2), 337–361. https://doi.org/10.1007/s11067-017-9347-0
- Holmes, T. J., & Stevens, J. J. (2004). Spatial distribution of economic activities in North America. Cities and Geography, 63, 2797-2843. https://doi.org/10.1016/s1574-0080(04)80020-8
- Hylton, P. J., & Ross, C. L. (2017). Agglomeration economies influence on logistics clusters growth and competitiveness. Regional Studies, 52(3), 350-361. https://doi.org/10.1080/00343404.2017.1327708
- Ketokivi, M., Turkulainen, V., Seppälä, T., Rouvinen, P., & Ali-Yrkkö, J. (2017). Why locate manufacturing in a high-cost country? A case study of 35 production location decisions. Journal of Operations Management, 49-51, 20-30. https://doi.org/10.1016/j.jom.2016.12.005
- Khushi, S., Ahmad, S. R., Ashraf, A., & Imran, M. (2020). Spatially analyzing food consumption inequalities using GIS with disaggregated data from Punjab, Pakistan. Food Security, 0, 1-16. https://doi.org/10.1007/s12571-020-01057-4
- Kichikawa, Y., Iino, T., Iyetomi, H., & Inoue, H. (2019). Visualization of a directed network with focus on its hierarchy and circularity. Journal of Computational Social Science, 2, 15-23. https://doi.org/10.1007/s42001-019-00031-1
- Philbrick, A. K. (2005). Areal functional organization in regional geography. Papers in Regional Science, 3(1), 87-98.
- Quynh, M., Thu, T., Huong, Q., Van, A., Van, H., & Van, D. (2020). Distribution center location selection using a novel multi criteria decision-making approach under interval neutrosophic complex sets. Decision Science Letters , 9(3), 501-510.
- Raudenbush, S. W., Bryk, A. S., Cheong, Y. F., Congdon, R. T., & du Toit, M. (2011). HLM 7: Hierarchical linear and nonlinear modeling. Lincolnwood: Scientific Software International.
- Sadigh, N. A., Fallah, H., & Nahavandi, N. (2013). A multi-objective supply chain model integrated with location of distribution centers and supplier selection decisions. The International Journal of Advanced Manufacturing Technology, 69(1-4), 225-235.
- Tian, X., & Zhang, M. (2019). Research on Spatial Correlations and Influencing Factors of Logistics Industry Development Level. Sustainability, 11(5), 1356. https://doi.org/10.3390/su11051356
- Ye, X., & Wei, Y. (2005). Geospatial Analysis of Regional Development in China: The Case of Zhejiang Province and the Wenzhou Model. Eurasian Geography and Economics, 46(6), 445-464. https://doi.org/10.2747/1538-7216.46.6.445
- Zheng, D., & Shi, M. (2018). Industrial land policy, firm heterogeneity and firm location choice: Evidence from China. Land Use Policy, 76, 58–67. https://doi.org/10.1016/j.landusepol.2018.04.040
Copyright information

This work is licensed under a Creative Commons Attribution-NonCommercial-NoDerivatives 4.0 International License.
About this article
Publication Date
16 April 2021
Article Doi
eBook ISBN
978-1-80296-104-1
Publisher
European Publisher
Volume
105
Print ISBN (optional)
-
Edition Number
1st Edition
Pages
1-1250
Subjects
Sustainable Development, Socio-Economic Systems, Competitiveness, Economy of Region, Human Development
Cite this article as:
Timiryanova, V. (2021). Spatial Aspect In The Volume Of Marketable Food Products. In E. Popov, V. Barkhatov, V. D. Pham, & D. Pletnev (Eds.), Competitiveness and the Development of Socio-Economic Systems, vol 105. European Proceedings of Social and Behavioural Sciences (pp. 973-982). European Publisher. https://doi.org/10.15405/epsbs.2021.04.103