Sectoral Sustainability In Oil And Gas Production: Comparative Analysis Of Russian Regions
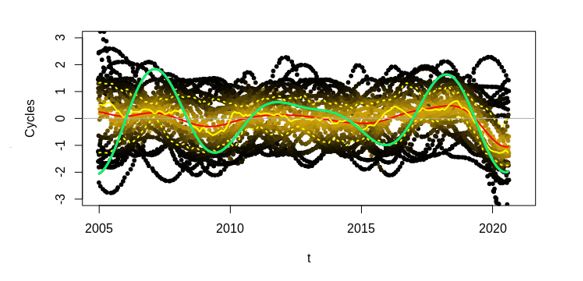
Figure 2: Comparison of cycles in the regions and the Russian Federation in general. Source: authors. Notes: The figure was compiled in the author's program in R. Green line - cycles in Russia as a whole. Red line - regional average. Light yellow - median by region. Yellow dotted line - quartiles by region. Points from black to yellow - all regions, the closer the point is to the middle, the brighter it is.
< Back to article

