
Sectoral Sustainability In Oil And Gas Production: Comparative Analysis Of Russian Regions


Abstract
The purpose of this paper is to assess the oil and gas production sectoral sustainability in the Russian Federation and to identify certain regions' contribution to the overall sustainability and dynamics direction. The authors selected an oil and gas production industry that experienced a price shock in 2020 as the most indicative cyclicity-wise. The median approach developed by the authors makes it possible to effectively assess the cyclical path and conduct a comparative analysis of different regions. The authors study the trends and cyclical dynamics of the oil and gas production volume growth rate in 28 major regions of the Russian Federation from January 2005 to August 2020. A comparative analysis of the cycle profile is performed. With the overall stable trend of oil and gas production in the country, the results show a high differentiation of industry dynamics cycles in Russian regions. The sectoral sustainability of oil and gas production is provided for by a small number of certain regions occupying leading positions in production. Regions with low oil and gas production are mostly in the downtrend, but their impact on overall sustainability is not crucial. The resulting model showed that, contrary to popular belief, the in-going wave of the Russian oil and gas production cycle began in the autumn of 2019, apparently in August 2020 the bottom of the cycle is formed, and if the trend continues from August 2020, an upward wave is in contemplation.
Keywords: Cycleevolutionary developmentindustry cycleoil and gas industryregional resilience
Introduction
The modern oil and gas industry has been characterized by increased imbalance in recent decades. Price volatility in the global market, price wars between countries, competition in production technologies, decarbonisation and, finally, a demand shock in the context of the 2020 pandemic are powerful factors of instability for the oil and gas industry. Hence, the issue of industry sustainability is particularly acute, as it is one of the factors of regional sustainability and, from this perspective, the key to understanding how regions develop growth paths (Boschma, 2015).
The concept of sustainability is widely discussed in the scientific literature and attracts more and more attention against the current economic crisis background, since it makes possible the assessment of regions' ability to recover from shocks, the thorough investigation of reasons for the speed and depth of shrinking and recovery, and the sources of balanced development.
However, there is no uniform understanding of the essence of this definition. The followers of the equilibrium approach proceed from a mechanistic view of the economic system return to its past equilibrium state and search for compensatory mechanisms of such a return. In the regional economy, there is a tendency to refute the equilibrium approach, scientists advocate an evolutionary approach to regional sustainability focusing on the long term (Boschma, 2015) and see the regions' ability to change the economy structure (Simmiea & Martin, 2010). Both approaches are important for industry analysis.
The equilibrium approach is indispensable for analyzing the ability of sectors to withstand economic shocks in respect to specific territories (Giannakis & Bruggeman, 2017), while the evolutionary approach helps detect factors of structural adjustment and long-term trend change. We do not contrapose these two approaches, but we believe that the equilibrium approach is important in the short term period, while the evolutionary approach provides better results in the long term implementation of systematic measures to improve the economy structure.
An important aspect of the research is the role of sustainable economic development of a country with a developed regional network in its balanced development (Semenychev et al., 2019). The balance of the country's economy as a socio-economic system is based on the structuring of individual elements (in our case, regional industries). Then sustainable and balanced development should be considered both as a structure state (industries in the region) with a certain ratio between the economic system components (for example, the sectors share in the economy), and as a dynamic process, reflecting the effect of the system's material properties (parameters) under certain influences on the regional socio-economic system.
Problem Statement
Ensuring sustainable positive dynamics of economic indicators is an important task for economists and managers. But its solution faces a number of challenges, one of which is the lack of knowledge of the real processes of cycles and the certain regions' contribution to the overall balance of economic sustainability. Sustainable development of the industry requires an understanding of cyclical processes at all levels (global, national and regional), since industry sustainability is formed by counter-impulses at all these levels. The combination of such impulses is ultimately an evolution of the industry's development. If the impact of global impulses is usually on the surface (for instance, a price shock in the global resource market), the sustainable economic development processes at the regional level often remain outside the scope of evaluation. However, understanding the nature and content of destructive and constructive impulses contributes to the balanced and sustainable development of the country. It facilitates more accurate management decisions in the field of national and regional economic policy.
Research Questions
Research questions are aimed at investigating the processes of cyclicity and sustainability at the regional level. The authors formulated the following research questions: what is the cyclicity dynamics and the current cycle stage in the Russian Federation as a whole? What is the cyclicity dynamics in Russian regions producing oil and gas? Which regions have a destructive (counter-cyclical) impact on the all-Russian cycle of oil and gas production? Which regions generate constructive (pro-cyclical) impulses for national oil and gas production? What groups of regions (with high, medium, and low volumes) drive the configuration of the all-Russian oil and gas production cycle?
Purpose of the Study
The industry cycles dynamics in a country with an extensive regional network provides important information for understanding the sustainable economy development. However, an adequate method must be used for it. We considered using a combination of different methods for evaluating cyclicity to be more effective in achieving successful results than focusing on one particular method. Thus, the purpose of the study is to conduct an adequate comparative analysis of trends and cyclical dynamics of oil and gas production in the regions of the Russian Federation, evaluate national and regional trends, and identify regions that make a positive and negative contribution to the overall sustainability balance. To achieve this, the authors developed existing methods for industry cycle models identification at the national and regional levels of research. In order to understand the particular contribution of certain regions to the overall sustainability balance, we classified regions by natural resource extraction volumes and identified pro -, counter -, and autocyclic regions. The impact of regions from different groups on the national oil and gas production dynamics trend was compared.
Research Methods
When studying the oil and gas production dynamics, each region's and all-Russian models are built independently of each other, and general trends are sought in the modeling results. Time series modeling involves identifying unobservable components: one or more trends, cyclical and seasonal fluctuations, and a stochastic component (model residuals). Two types of component interaction are usually considered: additive and multiplicative. However, the probability of a mixed structure is often overlooked, for example, with an additive cyclic component and a multiplicative seasonal one. In our study, the structure of each component is defined separately, providing four possible model structures in general.
Component models are identified in stages:
1. Preprocessing of the initial time series, removing outliers and replacing them with median smoothed values.
2. Determining the structure (additive or multiplicative) and detecting seasonal fluctuations using the STL function, which highlights the smoothed trend, seasonal fluctuations, and random residuals based on LOESS smoothing.
3. Deseasonalization (removing seasonal fluctuations from the initial series).
4. Determining the structure of cyclic fluctuations.
5. Plotting a linear trend without structural changes on the rectified data.
6. Detrending (removing a trend from a series).
7. Identification of cyclic fluctuations on the rectified data as the sum of several harmonic curves with non-proportional frequencies. The number of harmonic curves is selected separately for each series and usually ranges from 3 to 5.
8. Removal of cyclical fluctuations from the rectified data.
9. Plotting the median trend without structural changes. Currently, 11 trend models are used: linear, exponential, power trends, four cumulative logistic (S-shaped) and four impulse logistic (bellshaped) trends. Logistic trends are represented by symmetric models, models with fixed asymmetry, and models with free asymmetry. At each point in the time series, the median value is taken from all trend estimates.
10. Repeating steps 6-8 for the new trend estimates.
11. Plotting median trend with structural changes is performed similarly to step 9, but each trend is built both from the full data set and splitting the time series into subsamples at structural changes points. At this stage, up to 22 trend estimates are attained for each time point, from which the median is selected.
12. Repeating steps 6-8 for the new trend estimates.
Thus, mathematical models of trend, cyclical and seasonal fluctuations are built, that can be used both for forecasting and for analyzing existing dynamics. For instance, by superimposing normalized models of different regions' components on each other, their consistency with each other and with Russia in general can be evaluated.
Comparing the cyclical fluctuations levels between various regions of Russia and comparing them with the average values for all regions, three groups can be distinguished:
–pro-cyclical (up) regions where cyclical fluctuations positively correlate with the national average;
–countercyclical (down) regions that show a negative correlation with the average;
–autocyclical (neutral), where the correlation is close to zero.
Let us explain that the term "autocyclic" implies their autonomy, weak correspondence to cycles in other regions, i.e. in autocyclical regions, fluctuations depend more on internal factors, rather than on external factors common for the whole country. Countercyclical regions show the dynamics opposite to the average for the rest of the regions: when most regions are on the "high wave" of the cycle, their cycle is close to the bottom, and vice versa. The cycles of pro-cyclical regions coincide with fluctuations in the country in general. These regions can be characterized as "cycle-generating," and counter-cyclical – as the "cycle-compensating". The representative evaluation of regional meso-dynamic modeling and forecasting based on actual (official) data of Unified Interdepartmental Statistical Information System (UISIS, 2020).
Findings
A comparative analysis of Russian regions has shown that oil and gas production is characterized by a high concentration in certain regions and there is no uniform dynamics. It may be noted that contributions to the overall industry sustainability are different. Figure
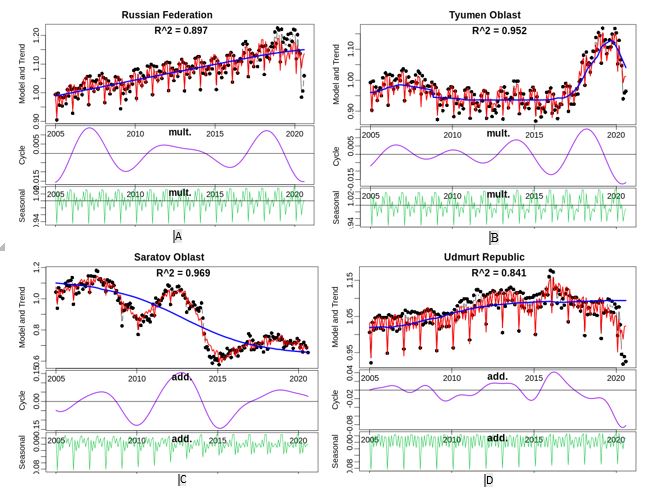
In general, the Russian Federation is facing a growing trend (Figure 1A), but in March the growth was replaced by a rapid drop in oil and gas production due to the implementation of the OPEC+ agreement to reduce production volumes. However, the cyclical factors analysis shows that the reduction in oil and gas production, contrary to widely held belief, began to show much earlier. Thus, the peak of the upward wave was observed at the end of 2018. After that, the downward wave formation took shape, which lasted all of 2019 (Figure
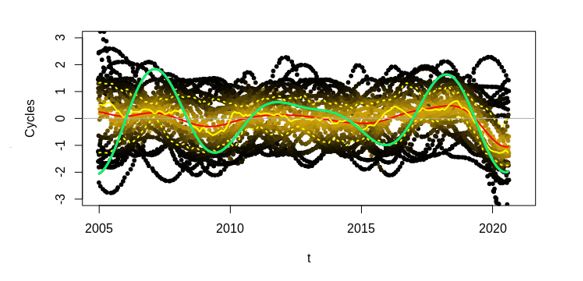
However, according to Figures 1A and 2, the Russian Federation is currently at the bottom of the consecutive cycle, which will be followed by a growth stage in 2021-23. Perhaps it will be similar to the growth of 2004-2006, if the economy recovers and there are no more lockdowns. During this period, the use of renewable sources, obviously, will not yet fully replace oil, and the increase in demand for gas (in particular, for condensed natural gas) will have a certain compensating effect. From Figure
Table
The leading regions, following the all-Russian trend of oil and gas production, show growth in 2005-2020 (Table
75% of regions in the second group show growing trends in oil and gas production (Irkutsk region, Krasnoyarsk territory, Perm region, Republic of Bashkortostan, Komi Republic, Samara region). Tomsk region is the only one showing a downward trend in oil and gas production. The third group of 15 regions contributes to the overall positive growth of oil and gas production, but the contribution of this group is not essential.
Conclusion
A comparative analysis of the industry cycles of oil and gas production leads to the following conclusions:
- in 2005-2020, while dynamics is unstable a positive trend in oil and gas production in the Russian Federation is observed.
- the downward wave of the oil and gas production cycle in Russia, contrary to widely held belief, began taking shape not in March 2020, but much earlier. The cycle peak was observed in November 2018, followed by the downward wave formation. The trend intersection and shift to the negative zone was recorded in July-August 2019.
- in August 2020, the bottom of the consecutive cycle was formed and, starting from the autumn of 2020, the Russian Federation may enter the upward stage in oil and gas production, provided that economic activity in the country and globally gradually restores.
- a sustainable trend in oil and gas production is supported by a positive balance of contribution of the leading regions and regions with average production volumes.
- regions with a small share in the total production of natural resources show mostly unstable dynamics and reduce their potential in oil and gas production.
Our study covers 28 Russian regions that supply 74% of all natural resources in the country and more than 90% of oil and gas production. This provides sufficient data to evaluate the industry sustainability of oil and gas production in the Russian Federation. Further research can be conducted to identify the economic development sustainability in other industries, the variability of cyclical fluctuations depending on the industry share in the structure of the economy, the labor resources availability, the level of taxes and other factors. The study findings highlight the importance of understanding the regional contribution to the overall sustainability and spatial balance of regional development. Moreover, these findings can be used for developing programs and plans for implementation of the Spatial Development Strategy of the Russian Federation for the period of up to 2025 (Order of the Government of the Russian Federation of 13.02.2019 N 207-r).
Acknowledgments
The reported study was funded by RFBR, project number 20-010-00549.
References
- Boschma, R. (2015). Towards an evolutionary perspective on regional resilience. Regional Studies, 49(5), 733-751. DOI:
- Giannakis, E., & Bruggeman, A. (2017). Economic crisis and regional resilience: Evidence from Greece. Papers in Regional Science, 96(3), 451-477. DOI:
- Order of the Government of the Russian Federation of 13.02.2019 N 207-r "On the Spatial Development Strategy of the Russian Federation for the period of up to 2025". http://government.ru/docs/35733/
- Semenychev, V. K., Khmeleva, G. A., Kozhukhova, V. N., & Korobetskaya, A. A. (2019). Spatial stochastic frontier analysis of Russian regions development from 2011 to 2016. European Proceedings of Social and Behavioural Sciences, 57, 1289-1301. DOI:
- Simmie, J., & Martin, R. (2010). The economic resilience of regions: Towards an evolutionary approach. Cambridge Journal of Regions, Economy and Society, 3(1), 27-43. DOI:
- UISIS (2020). Official statistical data. https://www.fedstat.ru/
Copyright information

This work is licensed under a Creative Commons Attribution-NonCommercial-NoDerivatives 4.0 International License.
About this article
Publication Date
30 April 2021
Article Doi
eBook ISBN
978-1-80296-105-8
Publisher
European Publisher
Volume
106
Print ISBN (optional)
-
Edition Number
1st Edition
Pages
1-1875
Subjects
Socio-economic development, digital economy, management, public administration
Cite this article as:
Semenychev, V. K., Khmeleva, G. A., & Korobetskaya, A. A. (2021). Sectoral Sustainability In Oil And Gas Production: Comparative Analysis Of Russian Regions. In S. I. Ashmarina, V. V. Mantulenko, M. I. Inozemtsev, & E. L. Sidorenko (Eds.), Global Challenges and Prospects of The Modern Economic Development, vol 106. European Proceedings of Social and Behavioural Sciences (pp. 1201-1208). European Publisher. https://doi.org/10.15405/epsbs.2021.04.02.142