
The Coronacrisis Consumer Demand Transformations And Price Dynamics: The Russian Case


Abstract
Coronavirus infection has rapidly taken the initiative in determining global trends. Over the past months of lockdown, there have been both sharp jumps in demand and negative trends associated with bankruptcies and savings in salary funds. However, the resulting transformations are largely determined not only by the effect of coronavirus infection, but also by the trends that have developed in the regions of Russia earlier. Therefore, it has become important to characterize the current trends in the socio-economic development and identify the factors most susceptible to crisis transformations. Fluctuations in supply and demand actively affected the price parameters of various segments of the market. The purpose of the work is to analyze the current trends in demand and assess their transformations during the crisis period, taking into account regional characteristics, to analyze price dynamics and reasoned possible directions of state policy aimed at smoothing the crisis phenomena. As a result, for five groups of regions, obtained on the basis of clustering, were determined product positions – benchmarks of socio-economic well-being. Among them: catering and leisure for more affluent regions and clothing, shoes and food for less affluent regions. There is also a group of regions where education costs play such a role. Price trends show that by the end of the year for all regions except clusters 3 and 4, we should expect an accelerated increase in prices for services, which were strenuously restrained during the acute phase of the pandemic.
Keywords: Clusteringconsumer demand transformationscoronacrisisprice trendsregions of Russia
Introduction
The crisis that broke out in 2020 is connected with the spread of a new coronavirus infection (COVID-19). It has already dramatically changed the living conditions that have become familiar over the past 10-15 years. A large flow of tourists, a developed network of catering and various leisure locations, and of course the concentration of the population in shopping centers and public transport-this is what distinguishes the modern metropolis and largely determines its comfort and benefits for people (Jackson, 2019). The mobility of the population has been sharply limited, both in the broad sense associated with free movement around the world, and in the narrow sense. The numerous lockdowns and needs for self-isolation has narrowed the habitat of the modern citizen to the yard and the nearest store. Personal protective equipment (masks and gloves), which were previously actively used only by medical staff, has been included in the number of essential goods everywhere. There are already significant changes in the way the urban life and economy. Hotels and tourist sites were closed for several months. At the same time, the profit and tax revenues from their activities make up a very significant part of the income of the population and budgets of such cities in Russia as St. Petersburg, Kazan, Krasnodar, Sochi, Simferopol. Closed cafes and restaurants, closed borders of European countries significantly change the way of life of residents of Russia's largest cities, primarily Moscow and St. Petersburg. The bankruptcy of a number of companies, the mode of saving on wages, in connection with the transition to a remote work schedule, led to significant changes in the level of income and well-being of citizens.
Problem Statement
The coronavirus infection has rapidly taken the initiative in determining global trends and has transformed the life of modern society. At the same time, the relative stabilization of the situation in society raises new questions and problems for the Russian economy. Undoubtedly, the changes caused by the coronacrisis affected the fluctuations in aggregate supply and demand, and after them on price parameters. Given the significant differentiation of both commodity markets and regions of Russia, it should be understood that the change will not be unidirectional and monotonous throughout the country. Moreover, it should be noted that the resulting transformations are not solely the result of shock effects associated with the spread of coronavirus. To a large extent, they are due to the proportions of socio-economic development that took shape at earlier stages. Here the author agrees with the position of Condon, who says that the issue of post-pandemic transformation of society should be considered from the point of view of the previous crisis of the neoliberal social model (Condon, 2020). That is why special attention should be paid to the study of transformation processes in the economic dynamics of Russian regions. The greatest research interest is the analysis of current trends in the dynamics of demand and prices in the regions of Russia and their transformation during the crisis period, in accordance with regional characteristics.
Research Questions
The research questions for this article were: how is it possible to divide the regions of Russia into more homogeneous groups in terms of the level of socio-economic development? What indicators are critical for assessing and describing the level of socio-economic development of the region? What was the dynamics of prices for the main product categories in the period 2000-2019 in the regions of Russia? What price transformations have taken place at the current stage (in 2020)? What factors demonstrate the greatest vulnerability to transformations associated with the spread of coronavirus infection (large-scale shutdown, restrictive measures, self-isolation, reduced income, etc.)? What are the main characteristics of income and consumption in certain groups of regions? What are the main vectors of transformation in the consumer sector due to shock changes in the economy? What are the possible measures of state to alleviate the severity of social problems that have arisen as a result of falling incomes?
Purpose of the Study
The main aim of the author is to expand and supplement the theory of regional economic development with the concept of non-equilibrium, taking into account the shock effects associated with the development of coronavirus infection on economic dynamics. A grouping of Russian regions by socio-economic development parameters was designed, which allowed identifying more homogeneous groups of regions. At the same time, different price dynamics in different sectors of the consumer market were revealed for different groups. Based on the empirical data of price dynamics in the regional markets, the current demand trends were identified and the directions of transformations during the crisis period were presented, taking into account regional characteristics. The article substantiates the factors of regional development is the most influenced by the crisis of transformation, including those associated with coronavirus. Based on the findings, it became possible to suggest directions for improving public policy in order to support positive socio-economic trends.
Research Methods
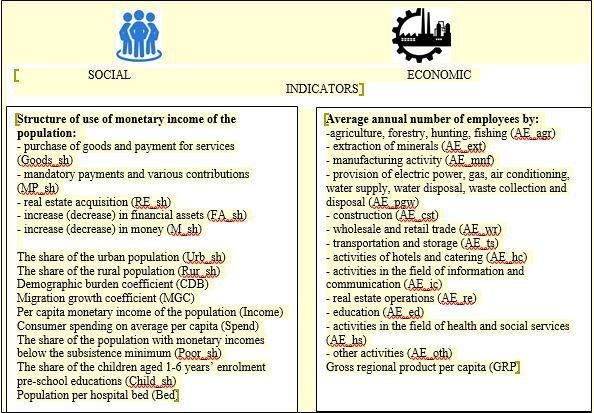
To answer these questions, it is necessary preliminarily to form groups of Russian regions that are more homogeneous in terms of socio-economic indicators. This is justified, firstly, by the huge space and significant differences in natural-climatic and resource conditions (what in the concept of Krugman refers to the factors of the "first" nature) (Krugman, 1993). Second, there is a clear difference in the factors of the "second" nature, including high population density and economic activity, which causes agglomeration effects and economies of scale; developed infrastructure, both transport and economic, and social, which reduce transaction costs, facilitating the formation of new economic and social relations (and a number of others, for more information, see (Zubarevich & Safronov, 2020). And, third, the practice of regional governance during the 1990s and 2000s, based on the position of regional competitiveness and the operating efficiency (at the expense of long-term resilience) led to an increase in regional disparities (Collins et al., 2020; Murua & Ferrero, 2019). In other words, we can say that in the regions with the collapse of the USSR, the complex of reproduction relations in the new market conditions has not yet been fully formed, but imperfect proportions have already begun to reproduce and consolidate. This process is emerged in the fact that several regions of Russia are very attractive to the population and business (Moscow and Moscow region, St. Petersburg, Sverdlovsk region), while all others face their intensive outflow. At the initial stage, indicators for clustering were selected. The main task here was to combine purely economic indicators that determine the direction, capacity and potential of the region's economy, and indicators that reflect the level of development of the social sphere (the distribution of indicators in two blocks is shown in Figure
The clustering technique is widely used in social and economic sciences. With regard to clustering of regions, the special value of this method is the ability to obtain benchmarks (reference estimates) of a certain type of region and assess the degree of approximation of real parameters to this central (reference estimate). Also, on this basis, it is possible to determine the directions of management actions which is necessary to enforce the development of the region. In particular, the work (Ketels & Protsiv, 2020) was aimed to analyze how the presence of strong clusters is systematically associated with the level of well-being of a location. This allowed authors to establish that cluster strength has an independent relationship with economic outcomes.
Also at this stage, the hypothesis of the factors correlation was tested. The rejection of this hypothesis allows us jointly consider the factors in the econometric models. To do this, a correlation matrix was estimated. The criterion for rejecting the collinearity hypothesis was the level of the correlation coefficient |r|, less than 0.7 for each pairs of factors. As a result, we obtained a system of independent factors for next stage of analysis. At the next stage, search clustering was performed using the Ward method in order to determine the number of clusters that most accurately represent the division of regions. Hypotheses about the presence of 4 and 5 clusters (groups) of regions were tested, more about it in (Roslyakova, 2020). It was found that clustering gives the most acceptable result for 5 groups of regions (clusters). The next stage of verification was the analysis of variance, which allowed us to check the significance of differences in the selected groups (clusters) relative to the level of parameters used in clustering (results of the analysis of variance present in the Table
From the results of ANOVA, you can see that all the parameters included in clustering are significant (at the level of 5%) for dividing regions into groups (clusters). Therefore, they can be used in the next step. The next stage was determined the regions composition (the K-means method) and, on this basis, was estimated the levels of consideration factors for each of the 5 clusters. Based on the selected groups of regions, further analysis was carried out and conclusions were drawn on the research questions raised.
Findings
The first thing to note is the significant difference between the obtained groups of regions and the uneven distribution of their groups. So small is the group of regions with a high level of GRP (cluster 4 (a typical region is the Yamalo-Nenets Autonomous district)) and the group of regions with a high standard of living and quality of social environment (cluster 2 (a typical region is the city of Saint Petersburg)). The group of regions with a very low GRP and a high level of poverty is represented by separate national republics and is also not numerous (cluster 3 (a typical region is the Karachay-Cherkess Republic)), which is probably due to the predominance traditional methods of activity (manual labor, processing of materials without means of mechanization and automation and so on). Next it is important to analyze two largest groups of regions: the first of them with a slightly lower standard of living (clusters 1 (a typical region is the Ulyanovsk region)) and the second of them with a slightly higher (cluster 5 (a typical region is the Voronezh region)) regarding Russian average (for more detailed data on clustering results, see Table
Group 4 of the regions are leaders in terms of GRP, income and wages (the mining industry is developed), but the distance from the central part of the country and severe climate conditions make the regions sparsely populated and provoke an outflow of population. The shift mode of work is widespread and therefore the accumulated money of wages turns into expenses already in other regions. In other words, the wages generated in the regions of the 4 group are spent outside of this group of regions. Industrial products (oil, natural gas) are mainly exported, so they are not included in the reproduction processes of the cluster 4 regions or other regions of the country.
The most numerous groups 1 and 5 with comparable levels of GRP, income and poverty demonstrate a fundamental difference in demographic trends. From the 1 cluster regions, there is a large flow of leaving people, so a small level of GRP ratios to a small population, and the level of per capita GRP becomes close to the national average. Group 5, by contrast, has an incoming flow of people. Since the level of income and expenses here is higher, you can see that people find a place in the labor market. Consequently, the economy of these regions has more potential. Thus, we can say that there is a tendency to change the place of permanent residence: from the regions of the cluster 1 to the regions of cluster 5. However, population of group 1 regions is typical that 80-90% of income is spent on goods and services, and changes in financial assets and money among the population are insignificant (they don't need to save for a long time to moving to another region). This distinguishes the group of regions 1 from the depressed group 3, where the share of income allocated for goods and services is about 64%, and the growth of financial assets and money among the population is higher at 25% (here people are accumulating hard to relocate). The most important price trend that has emerged due to the spread of coronavirus infection is a significant reduction in prices in the service segment. The change in price dynamics is shown in Table
In January-July, the opposite situation is observed in cluster 3 (depressed regions), where, on the one hand, due to low solvency, there are only services that can be classified as essential (for example, housing and utilities), and, on the other, due to rising costs, there may be an intensive outflow of service providers from the market, which increases demand and pushes the price level up. For non-food products, there are also multidirectional trends in price changes. For the regions of the Capital cluster (2), there was a slowdown in price growth until the summer, which is possible due to the scale of the market. So the mass transfer of students and employees to remote mode led to a surge in demand for computers and laptops. In Moscow, sales grew by 38% (compared to 2019) in quantitative terms and 46% in monetary terms. That is, there was a situation when, by providing a small discount, sellers provided sales of more modern, productive, high-quality equipment, which was much more expensive than analogues. However, since the second half of the summer, prices have been growing rapidly, which forms a common trend for all groups of regions. For regions of other clusters, where the severity of restrictive measures was significantly lower, and the scale of the market is not so significant, we expect an increase in prices. The leaders of negative trends are again the regions of clusters 3 (depressed regions) and 4 (resource regions), where price growth is due to costs, and the conservation of such parameters is due to the low level of development of the retail market and work in segments of only necessary goods. In other words, those market agents who are present there simply cannot leave and stop performing the social function of delivering the necessary non-food products. Lower rates of price growth are observed in cluster 5 (regions above-average) and cluster 1 (regions below-average). This dynamic is associated with a drop in demand. However, if in the cluster 5 is the vector to postpone demand and accumulate liquidity in a situation of uncertainty. The cluster 1 shows drop in demand for non-food products due to a very intense increase in food prices. That is, all the money is spent on food.
Conclusion
1. Cluster 2 (metropolitan regions) has an increased share of spending on cafes (4.7%) and leisure activities (10.9%), which characterizes the established lifestyle with a strong reliance on places of catering and recreation, which will undergo significant changes due to the pandemic;
2. In cluster 3 (depressed regions), the share of spending on clothing is 10.5% and household items is 6.9% due to low income levels. The population directs surplus money for these goods, that is, they expanded the level and quality of life. Accordingly, the savings also begin from them;
3. Cluster 4 (resource regions) has the lowest share of optional expenses among all clusters. This confirms the idea of a shift mode of work and the population's focus on the accumulation and export of financial assets and money, which will only increase with the pandemic;
4. Cluster 1 (the regions below the average) has increased share of spending on clothing and footwear, which indicates that this indicator can be considered as a critical indicator of well-being;
5. The remarkable level of expenditure on education in cluster 5 (the regions above the average). Given the spread of remote forms of work and educating, we can expect some growth in demand for educational services, which in the future can provide both higher-paid work in their region, and work in regions where wages are even higher (metropolitan and resource regions).
Taking into account the analysis of current trends, we can say that by the end of the year for all regions except clusters 3 and 4, we should expect an accelerated increase in prices for services, which were strenuously restrained during the acute phase of the pandemic, which will be designed to make up for the losses incurred. Signs of this trend have already appeared in cluster 5 regions.
Also, for clusters 5 and 1, the factor of price stabilization in the food market will be the development of a competitive and the emergence and activation of local food suppliers (not only in the form of stores, but also in the form of private trade, barter exchange, and collective purchase of long-term food at bases and farms). For the cluster 2 (metropolitan regions), where due to the scale of the market and developed competition, the issue of increasing prices for all categories of goods and services is least acute, further development will be associated with improving quality (in terms of achievement all safety requirements). The reason for raising prices will be the opportunity to buy goods or get services in a small store (salon), where there is no congestion of people, as well as to make a purchase online. In the cluster 4 (resource regions), where the population's ability to pay is present, but high prices due to increased delivery costs cause the formation of deferred demand. This creates prerequisites for further price growth.
The level of preservation of various services will be associated, on the one hand, with the ability to reduce the concentration of the population, and, on the other hand, with the dynamics of the population's income. In the case of a more intensive decline, there will be an intensive retirement from the market of service companies of various types. Low-income regions are characterized by a decrease in consumer activity and the concentration of all expenditures on the most basic (food, housing and utilities services, clothing). If the crisis continues, the state of the consumer market will largely depend on the state policy in the sphere of social payments and support for the population. For regions with a high birth rate (cluster 3), they will be associated primarily with child allowances and for regions with a significant proportion of the older population (cluster 1) with pension provision. Regions in the above-average group showed relative resilience during the pandemic. Therefore, they can become models for developing a new concept of settlement and organization of economic activities, taking into account the requirements of safety in a pandemic. On the one hand, they have a sufficiently strong economy, and, on the other hand, they have not yet accumulated the errors of agglomerations that are inherent in the regions of the metropolitan cluster.
References
- Collins, A., Florin, M-V., & Renn, O. (2020). COVID-19 risk governance: Drivers, responses and lessons to be learned. Journal of Risk Research, In Press. DOI:
- Condon, R. (2020). The coronavirus crisis and the legitimation crisis of neoliberalism. European Societies, In Press. DOI: 10.1080/14616696.2020.1839669.
- Jackson, M. O. (2019). The human network: How we’re connected and why it matters. Pantheon Books.
- Ketels, C., & Protsiv, S. (2020). Cluster presence and economic performance: A new look based on European data. Regional Studies, In Press. DOI:
- Krugman, P. R. (1993). First nature, second nature, and metropolitan location. Journal of Regional Science, 33(2), 129-144.
- Murua, J. R., & Ferrero, A. M. (2019). Talking about regional resilience: Evidence from two formerly rural Spanish regions. European Planning Studies, 27(11), 2312-2328.
- Roslyakova, N. (2020). The theory of economic nonequilibrium in application to the regional disparities problems: The impact of coronacrisis. In A. Tsvirkun (Ed.), Proceedings of 13th International Conference "Management of Large-Scale System Development" (pp. 1-5). IEEE.
- Zubarevich, N. V., & Safronov, S. G. (2020). Regions of Russia in the acute phase of the COVID crisis: Differences from previous economic crises of the 2000s. Regional Study, 2(68), 4-17.
Copyright information

This work is licensed under a Creative Commons Attribution-NonCommercial-NoDerivatives 4.0 International License.
About this article
Publication Date
30 April 2021
Article Doi
eBook ISBN
978-1-80296-105-8
Publisher
European Publisher
Volume
106
Print ISBN (optional)
-
Edition Number
1st Edition
Pages
1-1875
Subjects
Socio-economic development, digital economy, management, public administration
Cite this article as:
Roslyakova, N. A. (2021). The Coronacrisis Consumer Demand Transformations And Price Dynamics: The Russian Case. In S. I. Ashmarina, V. V. Mantulenko, M. I. Inozemtsev, & E. L. Sidorenko (Eds.), Global Challenges and Prospects of The Modern Economic Development, vol 106. European Proceedings of Social and Behavioural Sciences (pp. 1156-1164). European Publisher. https://doi.org/10.15405/epsbs.2021.04.02.137