
Economic Dynamics Of Territorial Development: Contribution To The Region’s Growth Potential


Abstract
This work explores the influence of factors - the resources of territories on the growth of their gross value added, which is considered as the cumulative result of the productive activities of all economic entities of industries and sectors of the economy. It is proposed to use, along with traditional factors - resources, those without which processes of qualitative changes in the economy are impossible, including the transition to its digitalization and intellectualization as a whole: the potential of human resources, a comfortable business environment that is susceptible to innovation and investment activity that ensures their implementation. In this work, we used the approach of determining gross value added, which is the basis for the implementation of the National Project “Labor Productivity and Employment Support”, which made it possible to come up with specific solutions to the problems of strategic development of individual territories and assess their contribution to the formation of the overall productive result. Resource factors are described meaningfully. The regional statistical base for the studied territories for 2010 - 2018 was used. Predictive calculations of gross value added have been performed within each factor - resource. The main contribution of the study is the possibility of interconnected planning of GVA at the territorial level, not only “top-down”, but also “bottom-up” based on the current state and prospects for qualitative changes in the main factors - resources that create the basis for economic growth.
Keywords: Labor productivitygross value addedfactorsquality resources of economic growth
Introduction
The development and diffusion of new technologies, their penetration into all spheres of human activity, leads to a change in the architecture of markets, the business environment and the situation of economic entities operating on them. The conditions are created for the growth of labor productivity and new qualities of development, providing from 60 to 80% of economic growth (Moskowitz, 2009).
For the regions of the region facing a complex of specific challenges, the inclusion of structural changes in the economy and social system in such processes is fundamental. Based on the imperative of increasing the growth rate of labor productivity, they become decisive, opening up the possibility of achieving high-quality results.
The labor productivity indicator determines not only the quantitative growth potential of any object, but the quality of this growth, incorporating all its innovative aspects of technical and technological improvement, expanding the capabilities of infrastructure, and the formation of human capital. The main measure of labor productivity is the gross value added calculated per capita or number of employees (The methodology for calculating labor productivity…, 2008). It is she who sets this quality of growth by the structural composition of her elements.
The advantage of this cost approach is the availability of statistical data, and from here the ability to analyze the entire chain of formation of gross value added from the enterprise to the subject, followed by the adoption of a whole range of management decisions on its qualitative filling and quantitative growth (McKinsey Consulting Company…, 2009; Sharpe et al., 2008).
In the proposed study, gross value added characterizes the productivity of the region, but is not statistically represented in the regional and municipal context.
The concentration of statistics at the regional level does not contribute to the proper organization of planning at the municipal level, there is no specificity in decision making, it is difficult to diagnose and evaluate the contribution of each territory to the overall result, to form reserves for its growth.
For quite a long time, discussions have been held on measuring gross value added at the level of individual regions of the region. The same applies to gross municipal product, as part of the gross regional product. Basically, they are focused on the search for some criterion that will allow to distribute the product created at the regional level, in separate territories.
So, there are known approaches to the distribution of gross regional product by territory through the ratio of labor and capital at the municipal and regional levels (Lopatin et al., 2005). A simplified method for calculating VMP based on gross value added has been developed (Chekavinsky & Gutnikova, 2012) and conditionally estimated VMP (Tatarkin et al., 2012).
A comparative analysis of them indicates the limited availability of statistical information and the different reliability of the obtained indicator.
We used the methodology of national accounts when the gross value added is calculated by sources of income and consists of the wages of employees, gross profit of industries and institutional sectors and net taxes on production and import (Methodological notes. System of National Accounts, 2020).
The statistics available at the territorial level allow us to propose the option of calculating the indicator by grouping such elements as the wage fund, consumption of fixed assets and intangible assets (depreciation), and profit. Using the approach in previous studies has shown its viability and high evidentiary power (Moskvina, 2014).
The table presents gross value added calculations by macro districts in 2018 with details on the southern territories of the region (table
Materials and methods
As already noted, gross value added as an indicator of productivity is systemically transformed under the influence of various factors, is the main factor in the differences in the level of economic and social well-being of the population and the driver of economic growth of territories. Assessing their impact on creating opportunities for the growth of value added of territories is the subject of this study. The shift of the research emphasis from the regional level to the municipal level and the task of identifying factors - resources that determine the quality of economic growth, allows us to characterize the dominant motives for their choice and areas of territorial development.
In modern conditions, various motives appear. The dominant within the framework of innovative development and the transition to a digital economy should be considered the growth of territorial productivity and the quality of life of the population due to the development of human potential, innovative business environment and investment attractiveness. Accordingly, the hypothesis of the dependence of gross value added and resource factors was determined, the proof of which is the production function of the power form:
(1)
HDI - human development index;
BEII- business environment innovation index;
IIA - investment activity index;
a 1, a 2, a 3- corresponding sensitivity coefficients for indicators of factors - resources.
Resource factors of territories have multifunctionality of use, uneven distribution, complete absence or low mobility, which affects their involvement in the processes of change. Their combined use creates a systemic effect that forms an attractive environment for business development and investment attraction, human development and, as a result, economic growth of territories.
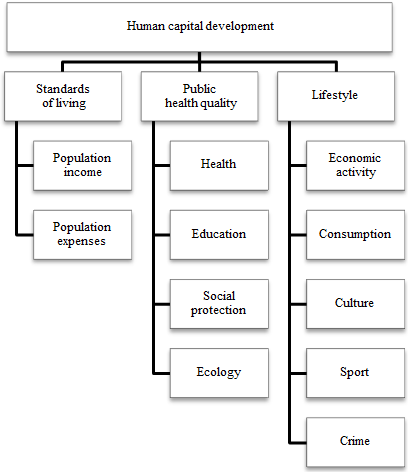
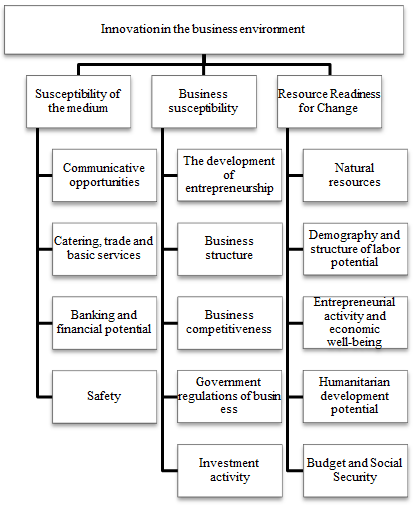
To assess the factors - resources of specific territories, an indicative approach is proposed, which allows, through data normalization, to move along the levels of structuring from individual indicators to complex indicators that characterize their substantive basis. The assessment was carried out on the entire list of territories of the region - 61 units. The research was based on statistical materials of the automated information system for monitoring municipalities in the Krasnoyarsk territory (Automated information system…, n.d.). The tables (fragments) and the figures show their informative and structural models (Figure
The investment activity of the territories was estimated by:
the volume of investments from all sources in fixed assets;
growth rates of investments in fixed assets;
by subjects of investments in fixed assets from all sources (small, medium, large business, budget);
by investment objects (types of economic activity).
Investment activity indicators are defined for business entities, budgets and the population, investment performance was also evaluated for all these levels, which allows us to solve a number of interrelated tasks:
determine the features of the investment activity of the territories;
establish the degree of dominance of the territory in the region by the effectiveness of investment activity;
use the information obtained to formulate strategies and programs for the development of territories.
The basis thus formed for a multilevel assessment of the level of development of human potential, innovativeness of the business environment, and the effectiveness of the investment activity of the territories allows not only to characterize their potential, but also to carry out monitoring, highlighting the problems that require appropriate management decisions aimed at creating conditions for economic growth as a whole.
Results
The results of the assessment of factors - resources by the proposed methodology are presented below and serve as the basis for modeling the productivity of territories for the future.
The assessment by the human capital development index made it possible to single out the leader among the studied territories of the Southern macrodistrict - Krasnoturansky district, which was included in the top ten in the region from fifth position in the rating (table
Differentiation of territories according to the innovativeness of the business environment indicates significant problems in the Shushensky district, when not only the current level of the business environment is low, but positive trends are not expected for the future (table
The absolute amount of investment in fixed assets in 2018 had a spread of 156.23 thousand rubles. In the city of Minusinsk until 2418, 02 thousand rubles. In the Krasnoturansky district. The average annual growth rate of the indicator mainly fell with the exception of the Ermakovsky and Krasnoturansky districts. The low volume of investments in the city of Minusinsk is explained by the large number of small enterprises (3175 units), which exceed their average number over the remaining territories by ten times.
As can be seen from the data presented, there are no territories with a high share of own sources of investment, more than 50% provision in the Karatuz and Shushensky regions with the support of budget investments. The remaining territories, investing small own funds, enjoy sufficient budget support (from 10 to 40%) - Ermakovsky and Idrinsky districts and the city of Minusinsk, and also accept smaller amounts of support (less than 10%) - Minusinsky and Kuraginsky districts (tables
Almost all territories (up to 60%), with the exception of Idrinsky districts, where a large share of investment falls on small businesses (table
Idrinsky (1.5 times), Kuraginsky districts (2.2 times) and the city of Minusinsk (3.6 times) stand out with high growth rates of investments in fixed assets. The remaining territories also conduct active, but cautious investment activities, the Krasnoturansky and Karatuzsky districts are close to a one-time growth, half are the Shushensky district, and in the region of 10-30% are the Ermakovsky and Minusinsky districts (table
The distribution of territories by the level of investment activity and its growth rate is presented. The leaders are the Karatuzsky district and the rest, except for the Idrinsky district, territories with a high level of investment activity and its growth rate. Idrinsky district has a tendency to decline in investment activity (table
To develop growth scenarios, the link functions were found (table
For the territory of the Southern macrodistrict, the equation has the form:
(2)
The resulting equation is characterized by the following parameters:
with Degree of reliability is quite high and it is 93.2%, which suggests the possibility of using the model for the forecast (table
the coefficient of elasticity by the factor "Development of human potential" indicates, , that an increase of 1% of the human development index leads to the growth index by 1.52%;
the coefficient of elasticity by the factor "Business Environment Innovation Index" shows, that a 1% increase in the index of innovativeness of the business environment leads to an increase of 1.225 %;
the coefficient of elasticity by the factor "Investment activity index" shows, that an increase of 1% in the index of investment activity leads to an increase in the indicator by 0.529%;
elasticity of total that, with the combined influence of strategic resource factors at 1%, GVA is growing at 1.807%.
Discussion
The development of growth scenarios for the territories is based on various possibilities for their influence on the increase in GVA. In the Southern Territory, according to a combination of factors - resources, they refer to territories with their average values. Four scenarios of GVA growth are considered: inertial, investment, infrastructural and social.
The inertial scenario is based on current trends from 2010 to 2018. The growth rates are shown in table
All the territories of the Southern macrodistrict were included in the cluster with a high level of investment activity and an average level of innovativeness of the business environment and human potential (table
Calculation of forecast values of GVA for the period from 2019-2022 are given in the table
The total amount of GVA by 2022 can reach 63,275.54 million rubles, which is less than the level of 2018 (table
The second of the considered scenarios is investment, which implies an increase in investment activity in these territories, where they were insignificant with the previous values of the other factors - resources (table
There is no territory for an absolute decrease in the volume of GVA according to the investment scenario for all factors - resources, on the contrary, they have increased their values (table
The third scenario focuses on the innovativeness of the business environment, the development of its infrastructure and institutional capabilities in those areas where there were problems (table
Calculation of forecast values of GVA for municipalities for the period 2019 - 2022. given in table
The total amount of GVA under this scenario by 2022 will amount to 79197.4 million rubles. This is 17.54% higher than in 2018. The largest increases in the indicator were shown by Ermakovsky district (340.3%) and Minusinsky (215.5%) - tourist centers of the region, for which the infrastructure factor is central. At the same time, the strengthening of the infrastructure factor in the Kuraginsky, Minusinsky, Shushensky districts and the city of Minusinsk led to a decrease in GVA in the Karatuzsky and Shushensky districts from 6 to 26%.
The fourth version of the scenario conditions is aimed at developing the human potential of the territories and is called “social” (table
Calculation of forecast values of GVA for municipalities for the period 2019 - 2022. given in table
In the space under study, the human development index is high and positive in most territories (Ermakovsky - 15.0; Krasnoturansky - 18.4; Minusinsky - 14.8%; Shushensky - 11.0%). In the Idrinsky (3.5) and Krasnoturansky (1.6) districts, also the positive productivity of the territories together leads to an increase in GVA by 8.56% in the amount of 73,151.7 million rubles. At the same time, there is a negative dynamic of its growth in the Karatuzinsky (-20.3%) and Shushensky (-10.6%) regions.
The generalized results of the GVA within the framework of the proposed scenarios will allow us to dwell on the infrastructure and investment options for the development of territories (table
Conclusions
The infrastructural option is preferable since the sensitivity of the GVA to this indicator is 2.3 times higher than for investment activity and 23 times higher than for human potential. The combination of innovative business environment with sufficient investment activity and stable quality of human potential can significantly increase the results of forecasts.
In general, the study will solve the following set of problems:
1. Clarify the concept of gross value added for a municipality as a territory that is part of a region. A formula is proposed and justified for calculating the GVA of the territories "lower - up", and not by distributing it in accordance with the specified criterion "top - down", which allows to specify strategies for their development based on the resource potential for growth.
2. To determine the composition of strategic factors - resources that affect the productive capacities of the territories to increase GVA.
3. To propose meaningful models of factors - resources, a system of indicators and a criterion for their measurements, which form the structural elements of the factor - resource basis of the productivity of territories.
4. On the basis of correlation - regression analysis, determine the priority of the influence of each of the factors - resources, on the productivity of territories for solving specific strategic development problems.
The results of the study can be used as tools for strategic planning of territorial development and monitoring its results.
Acknowledgements
The project №19-410-240007 «Metrics of factorial assessment of reserves of internal potential and the effects of growth in labor productivity in non-resource sectors of the economy to support the digitization of the integration processes of business entities in the region» was funded by RFBR, Government of Krasnoyarsk Region and Krasnoyarsk Regional Fund of Science.
References
- Automated information system for monitoring municipalities (AIS Region MO). (n.d.). http://aismmo.econ-krsk.ru
- Chekavinsky, A. N., & Gutnikova, E. A. (2012). Assessment of the gross product of the city and the direction of its increase. Problems of development of the territory, 2(58), 36-44.
- Lopatin, A. A., Nabiev, A. M., & Silintsev, V. S. (2005). Improving the system of indicators for the long-term forecast of the socio-economic development of the region. Economics, Finance, Market, 1. http://www.publications.csu.ru/form
- McKinsey Consulting Company. Effective Russia. Productivity as the foundation of growth. (2009). https://www.mckinsey.com/~/media/McKinsey/Featured%20Insights/Emerging%20Markets/Lean%20Russia%20sustaining%20economic%20growth/MGI_Lean_Russia_Sustaining_economic_growth_full_report.pdf
- Methodological notes, System of National Accounts. (2020). Rosstat. http://https://www.gks.ru/free_doc/new_site/vvp/metod.htm
- Moskowitz, S. L. (2009). The advanced materials revolution: technology and economic growth in the age of globalization. N.J.: John Wiley.
- Moskvina, A. V. (2014). The formation of economic value added in municipalities of the Krasnoyarsk Territory. Scientific results of the year: achievements, projects, hypotheses, 4. Novosibirsk: LLC Center for the Development of Scientific Cooperation, 167-173.
- Sharpe, A., Arsenault, J., & Harrison, P. (2008). The Relationship between Productivity and Real Wage Growth in Canada and OECD Countries. Centre for the study of living standards.
- Tatarkin, A. I., Kozlova, O. A., Timashev, S. A., & Bushinskaya, A. V. (2012). Study the dynamics of the structure of the gross municipal product safety. Critical infrastructures and so on ehnologiy, 1.
- The methodology for calculating labor productivity indicators of an enterprise, industry, subject of the Russian Federation. (2018, 28 December). Appendix, 1, to the order of the Ministry of Economic Development of Russia.
Copyright information

This work is licensed under a Creative Commons Attribution-NonCommercial-NoDerivatives 4.0 International License.
About this article
Publication Date
08 March 2021
Article Doi
eBook ISBN
978-1-80296-102-7
Publisher
European Publisher
Volume
103
Print ISBN (optional)
-
Edition Number
1st Edition
Pages
1-644
Subjects
Digital economy, cybersecurity, entrepreneurship, business models, organizational behavior, entrepreneurial behavior, behavioral finance, personnel competencies
Cite this article as:
Moskvina, A., Belyakova, G., Mikhaylova, S., Bagdasaryan, L., & Latynina, A. (2021). Economic Dynamics Of Territorial Development: Contribution To The Region’s Growth Potential. In N. Lomakin (Ed.), Finance, Entrepreneurship and Technologies in Digital Economy, vol 103. European Proceedings of Social and Behavioural Sciences (pp. 80-94). European Publisher. https://doi.org/10.15405/epsbs.2021.03.12