
It Is? It Is Not? Identifying Portulaca by Morphology and DNA Barcodes


Abstract
Amongst
Keywords: Portulaca speciesspecies identificationDNA barcodesITStrnL-Frbcla
Introduction
Morphological features have been the basis of species identification for the past 250 years (Hebert & Gregory, 2005), using features such as stems, fruits, and flowers (Waldchen et al., 2018). However, difficulties in species identification arise when different species share similar morphological characters (Jinbo et al., 2011), or members of the same species look different due to phenotypic plasticity (Sdouga et al., 2018).
Species misidentification has been reported among Portulaca species, for example, the 5th. Edition of the Sunset Western Garden Book (October 1988) mislabelled
There are limited studies on barcoding of this genus. Sdouga et al. (2018) worked mainly on
Problem Statement
Misidentification creates problems for conservationists, ecologists, and various types of agencies that deal with food safety, and invasive plants (Hebert & Gregory, 2005). DNA barcoding to supplement morphological identification is suggested (Thompson & Newmaster, 2014). Among the reasons for incorporating DNA based methods in species identification, is that molecular identification can be more efficient, as shown by a taxonomic survey where 202 species were identified using molecular data, but only 142 species were identified using morphology (Thompson & Newmaster, 2014). The molecular identification not only identified more species but was at the same time, 37% less expensive (Thompson & Newmaster, 2014). However, DNA barcoding sometimes fails in species identification (Percy et al., 2014; Stallman et al., 2019). Part of the reason for failure could be the influence of geographical locations of the sample. In
Research Questions
The question then is, will the DNA sequences of ITS1, ITS2,
Purpose of the Study
The study aimed to;
characterise three Portulaca species found in Malaysia using leaf and flower morphology
determine if the nuclear (ITS1, ITS2) and chloroplast (rbcl, trnL-F) loci can be amplified, sequenced, and analysed using the Basic Local Alignment Search Tool (BLAST) and maximum likelihood tree topology, to corroborate the identify or discriminate the morphologically delimited Portulaca species.
Research Methods
Morphological characterisation, followed by molecular characterisation and their comparison was carried out, as explained in the next sections.
Sample selection, morphological characterisation, and identification
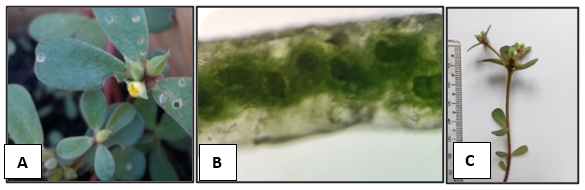
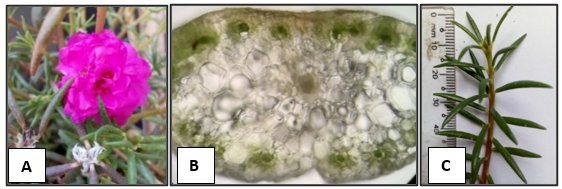
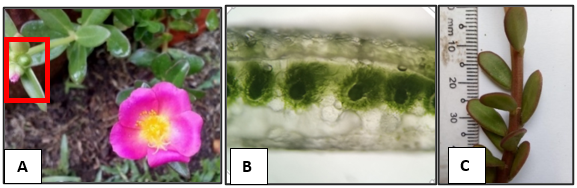
Nine samples were collected in Negeri Sembilan, three from each of the morphologically different Portulaca species. The samples were morphological characterised based on observations made by the naked eye and under a light microscope.
Molecular characterisation
DNA extraction, Amplification and Sequencing
DNA was extracted using the modified cetyltrimethylammonium bromide (CTAB) method (Doyle & Doyle, 1987). Polymerase Chain Reactions (PCR) using My Taq™ Mix (Bioline, USA) were performed according to manufacturer’s protocols using primers and thermocycling conditions reported for rbcl (Kress et al., 2009), trnL-F (Taberlet et al., 1991), ITS1(Cheng et al., 2015), and ITS2 (Chen et al., 2010). PCR products confirmed by agarose gel electrophoresis were purified and sequenced at MyTACG Bioscience Enterprise.
Sequence Analysis
The analysis used consensus sequences obtained using DNA Sequence Assembler version 5.15 (2018) or if unavailable, uni-directional reads. Fragment length and GC content obtained using the MEGA X Software (Kumar et al., 2018), if consistent with reported values indicate the authenticity of loci (Buckler & Holtsford, 1996). Authenticity is also indicated by a lack of stop codons in the reading frame of the coding locus rbcl and was determined using the Barcode of Life Database (BOLD) (Ratnasingham & Hebert, 2007). Sequence homogeneity in evolution and substitution saturation were determined using the Disparity Index (ID) in MEGA (Kumar & Gadagkar, 2001) and the Iss statistics, in the DAMBE Software (Xia & Xie, 2001).
To identify and differentiate species we used the BLASTN (Altschul et al., 1990) and created a maximum likelihood tree using MEGA X (Kumar et al., 2018). We assigned identities based on the highest score obtained when the sequences were queried using the BLAST (via (http://blast.ncbi.nlm.nih.gov/Blast.cgi). In the case of ITS2, the ITS2 database was used to assign species name based on a BLAST which uses structure and sequence (Merget et al., 2012).
The maximum likelihood tree was generated using sequences aligned with t-Coffee (Di Tommaso et al., 2011) according to the best-fit nucleotide substitution model selected based on the Akaike information criterion (AIC) calculated in MEGA X (Kumar et al., 2018). Sequences clustered in monophyletic clades in the tree enable species discrimination (Fazekas et al., 2008). Node support evaluated with bootstrapping (BS) (Felsenstein, 1985), was interpreted as giving relatively reliable support of the relationship when BS is between 70 and 85 and strong support when BS is more than 85 (Kress et al., 2002).
Findings
Provisional morphological identification
The plant samples were assigned to the Portulaca genus, diagnosed by the contracted head-like inflorescence and the fruit’s dehiscent top portion shed intact as a lid (Nyffeler & Eggli, 2010). Morphology provided temporary species assignments to
The temporary identification to
The second species was first inferred to be in the Pilosa clade, based on conspicuous leaf axillary hairs (Ocampo et al., 2013), and vascular bundles arranged in a peripheral ring with the water storage cells located in the central part (Figure
Molecular Identification
PCR and sequencing success rate
Barcoding depends on successful amplification and sequencing. This study found a 100% success in amplification, but sequencing was not always successful. Three
Detection possible source of noise by sequence characterisation
The length and percentage GC (Table
Species Identification
BLAST analysis of all loci supported the identification of
The species morphologically identified as
The species morphologically identified as
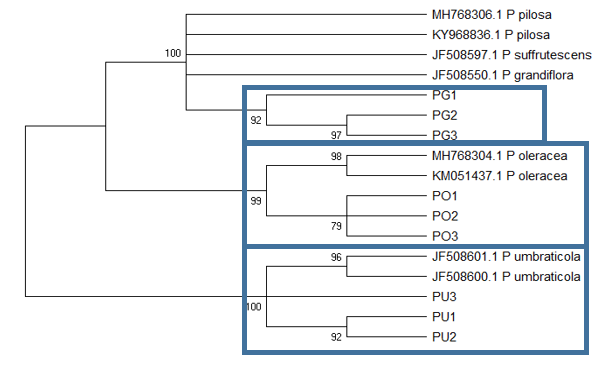
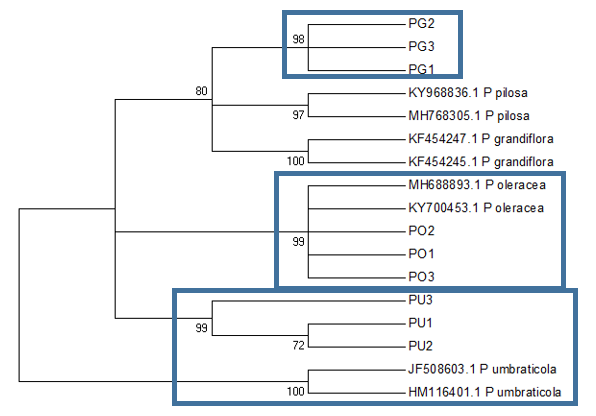
Inferences from tree topology, in general, coincide with the deductions from BLAST. There is confirmation that the
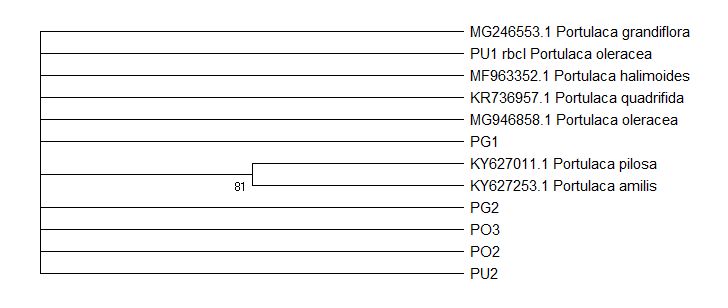
The
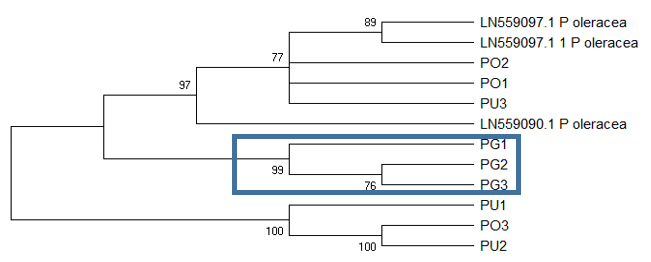
The ITS1 tree (Figure
The ITS2 based tree (Figure
Conclusion
All loci, using either BLAST or the tree topology, identified the genus correctly. Secondary structure-based BLAST analysis and tree topology of ITS2 confirmed the morphological identification of all Portulaca species. As the standard BLAST of the same sequences could not identify any of the species, the method of sequence analysis had a detectable influence on identification. Identification — Whether it is? Or it isn’t?, currently, cannot depend solely on DNA barcoding, and needs the support of morphology. Morphology based identification, however, can be simplified when DNA barcodes narrow the scope of search from among the estimated 369,000 species of flowering plants currently known, to say within the genus of a few hundred species. In the study, the lack of a complete database impacted the ability to identify species, and the database needs to be further populated to provide coverage of all species, and also reflect the within-species diversity. Also, because taxonomist cannot agree on characters to discriminate species, different names may be given to the same species such as
Acknowledgments
INTI International University funded this study but had no role in study design, data collection, analysis, or preparation of the manuscript.
References
- Abraham, V., & Desai, B. M. (1977). Induced tetraploidy in a perennial Portulaca mutant. Indian Journal of Horticulture, 34(3), 301–305.
- Altschul, S. F., Gish, W., Miller, W., Myers, E. W., & Lipman, D. J. (1990). Basic local alignment search tool. Journal of Molecular Biology, 215(3), 403–410.
- Armstrong, K. F., & Ball, S. L. (2005). DNA barcodes for biosecurity: invasive species identification. Philosophical transactions of the Royal Society of London. Series B, Biological sciences, 360(1462), 1813-1823. https://doi.org/10.1098/rstb.2005.1713
- Buckler, E. S., & Holtsford, T. P. (1996). Zea systematics: Ribosomal ITS evidence. Molecular Biology and Evolution, 13(4), 612–622.
- CBOL Plant Working Group (2009). A DNA barcode for land plants. Proceedings of the National Academy of Sciences of the United States of America, 106(31), 127941–2797. https://doi.org/10.1073/pnas.0905845106
- Chen, M. Y., Liang, D., & Zhang, P. (2017). Phylogenomic resolution of the phylogeny of Laurasiatherian mammals: Exploring phylogenetic signals within coding and noncoding sequences. Genome Biology and Evolution, 9(8), 1998–2012. https://doi.org/10.1093/gbe/evx147
- Chen, S., Yao, H., Han, J., Liu, C., Song, J., & Leon, C. (2010). Validation of the ITS2 region as a novel DNA barcode for identifying medicinal plant species. PLoS One, 5(1), e8613. https://doi.org/10.1371/journal.pone.0008613
- Cheng, T., Xu, C., Lei, L., & Zhou, S. (2015). Barcoding the kingdom plantae: New PCR primers for ITS regions of plants with improved universality and specificity Molecular Ecology Resources 16(1),138–149. https://doi.org/10.1111/1755-0998.12438.
- Choi, K. S., & Park, S. J. (2013). Direct submission. Submitted (11-DEC-2013). College of Life Science, Yeungnam University, Daedong, Gyoungsan-si, Gyoungsangbuk-do 712–749, Korea (GenBank: KF954535.1). https://www.ncbi.nlm.nih.gov/nuccore/KF954535.1
- Coleman, A. W. (2009). Is there a molecular key to the level of “biological species” in eukaryotes? A DNA guide. Molecular Phylogenetics Evolution, 50(1), 197-203. https://doi.org/10.1016/j.ympev.2008.10.008
- Cudney, D. W., Elmore, C. L., Davis, U. C., & Molinar, R. H. (2017). Common Purslane. http://ipm.ucanr.edu/PMG/PESTNOTES/pn7461.html
- Danin, A., Baker, I., & Baker, H. G. (1978). Cytogeography and taxonomy of the Portulaca oleracea L. complex. Israel Journal of Botany, 27, 177–211.
- Di Tommaso, P., Moretti, S., Xenarios, I., Orobitg, M., Montanyola, A., Chang, J. M., Taly, J. F., Notredame, C. (2011). T-Coffee: a web server for the multiple sequence alignment of protein and RNA sequences using structural information and homology extension. Nucleic Acids Research, 39(2), W13–W17. http://doi.org/10.1093/nar/gkr245
- DNA Sequence Assembler v4. (2013), Heracle BioSoft, www.DnaBaser.com
- Doyle, J. J., & Doyle, J. L. (1987). A rapid DNA isolation procedure for small quantities of fresh leaf tissue. Phytochemical Bulletin, 19, 11–15.
- El-Bakatoushi, I. R. (2015). Intra-specific genetic differentiation shaping three Portulaca oleracea L. micro-species. Pakistan Journal of Botany, 47(6), 2309–2320.
- Eriksson, T., Hibbs, M. S., Yoder, A. D., Delwiche, C. F., & Donoghue, M. J. (2003). The phylogeny of Rosoideae (Rosaceae) based on sequences of the internal transcribed spacers (ITS) of nuclear ribosomal DNA and the trnL-F region of chloroplast DNA. International Journal of Plant Science, 164(2), 197–211.
- Fazekas, A. J., Burgess, K. S., Kesanakurti, P. R., Graham, S. W., Newmaster, S. G., Husband, B. C., Percy, D. M., Hajibabaei, M., & Barrett, S. C. (2008). Multiple multilocus DNA barcodes from the plastid genome discriminate plant species equally well. PLoS ONE, 3(7), e2802. https://doi.org/10.1371/journal.pone.0002802
- Felsenstein, J. (1985). Confidence limits on phylogenies: An approach using the bootstrap. Evolution, 39,783–791.
- Friedheim, S. (2016). Comparison of species identification methods DNA barcoding versus morphological taxonomy. Mānoa Horizons, 1, 74–86.
- Ghahramanzadeh, R., Esselink, G., Kodde, L. P., Duistermaat, H., Van Valkenburg, J. L., Marashi, S. H., Smulders, M. J., & van de Wiel, C. C. (2013). Efficient distinction of invasive aquatic plant species from non-invasive related species using DNA barcoding. Molecular Ecology Resource, 13, 21–31.
- Ghorbani, A., Saeedi, Y., & de Boer, H. J. (2017). Unidentifiable by morphology: DNA barcoding of plant material in local markets in Iran. PLoS ONE, 12(4), e0175722 http://doi.org/10.1371/journal.pone.0175722
- Hasegawa, M., Kishino, H., & Yano, T. (1985). Dating the human-ape split by a molecular clock of mitochondrial DNA. Journal of Molecular Evolution, 22,160–174.
- Hebert, P. D. N., Cywinska, A., Ball, S. L., & deWaard, J. R. (2003). Biological identifications through DNA barcodes. Proceedings of Biological Sciences, 270(1512), 313–321. http://doi.org/10.1098/rspb.2002.2218
- Hebert, P., & Gregory, T. R. (2005). The promise of DNA Barcoding for taxonomy. Systematic Biology, 54(5), 852–859.
- Hollingsworth, P. M., Graham, S. W., & Little, D. P. (2011). Choosing and using a plant DNA barcode. PLoS ONE, 6(5): e19254. https://doi.org/10.1371/journal.pone.0019254
- Jinbo, U., Kato, T., & Ito, M. (2011). Current progress in DNA barcoding and future implications for entomology. Entomological Science, 14, 107–124. https://doi.org/10.1111/j.1479-8298.2011.00449.x
- Jukes, T. H., & Cantor, C. R. (1969). Evolution of protein molecules. In Munro H. N., editor, Mammalian Protein Metabolism, Academic Press, New York, NY. 21–132.
- Keller, A., Förster, F., Müller, T., Dandekar, T., Schultz, J., & Wolf, M. (2010). Including RNA secondary structures improves accuracy and robustness in reconstruction of phylogenetic trees. Biology Direct, 5(1), 4, 1–12.
- Kokubugata, G., Kato, H., Iamonico, D., Umemoto, H., Ito, T., Nakamura, K., Murakami, N., & Yokota, M. (2015). Taxonomic reexamination of Portulaca boninensis (Portulacaceae) in the Bonin (Ogasawara) Islands of Japan using molecular and morphological data. Phytotaxa, 217(3), 279–287.
- Kress, W. J., Erickson, D. L., Jones, F. A., Swenson, N. G., Perez, R., Sanjur, O., & Bermingham, E. (2009). Plant DNA barcodes and a community phylogeny of a tropical forest dynamics plots in Panama. Proceedings of the National Academy of Sciences of the United States of America, 106(44), 18621–18626. https://doi.org/10.1073/pnas.0909820106
- Kress, W. J., Prince, L. M., & Williams, K. J. (2002). The phylogeny and a new classification of the gingers (Zingiberaceae): Evidence from molecular data. American Journal of Botany, 89, 1682–1696.
- Kress, W. J., Wurdack, K. J., Zimmer, E. A., Weigt, L. A., & Janzen, D. H. (2005). Use of DNA barcodes to identify flowering plants. Proceedings of the National Academy of Sciences of the United States of America, 102(23), 8369–8374. https://doi.org/10.1073/pnas.0503123102
- Kumar, S., & Gadagkar, S. R. (2001). Disparity Index: A simple statistic to measure and test the homogeneity of substitution patterns between molecular sequences. Genetics, 158, 1321–1327.
- Kumar, S., Stecher, G., Li, M., Knyaz, C., & Tamura, K. (2018). MEGA X: Molecular Evolutionary Genetics Analysis across computing platforms. Molecular Biology and Evolution, 35, 1547–1549.
- Legrand, C. D. (1962). Las especies Americanas de Portulaca. Anales del Museo de Historia Natural de Montevideo, 7, 1–47.
- Mabberley, D. J. (2017). Mabberley’s Plant-Book A Portable Dictionary of Plants, their Classification and Uses (4th ed.), Cambridge University Press.
- Machate, F. H. Bezeng, S., & van der Bank, M. (n.d.). https://dnabarcodes2017.org/wp-content/uploads/2018/01/ibol2017.08201e9.NORMAL.pdf
- Menkins, I. (2013), January 25. P. pilosa seed under 20X and 40X magnification. https://australianportulaca.blogspot.com/2013/01/
- Merget, B., Koetschan, C., Hackl, T., Förster, F., Dandekar, T., Müller, T., Schultz, J., & Wolf, M. (2012). The ITS2 database. Journal of Visualized Experiments: JoVE, 61, e3806. https://doi.org/10.3791/3806
- Müller, T., Philippi, N., Dandekar, T., Schultz, J., & Wolf, M. (2007). Distinguishing species. RNA, 13(9), 1469–1472.
- Newmaster, S. G., Fazekas, A. J., Steeves, R. A., & Janovec, J. (2008). Testing candidate plant barcode regions in the Myristicaceae. Molecular Ecology Resources, 8, 480–490. https://doi.org/10.1111/j.1471-8286.2007.02002.x
- Nyffeler, R. (2007). The closest relatives of cacti: Insights from phylogenetic analyses of chloroplast and mitochondrial sequences with special emphasis on relationships in the tribe Anacampseroteae. American Journal of Botany, 94(1), 89–101. https://doi.org/10.3732/ajb.94.1.89
- Nyffeler, R., & Eggli, U. (2010). Disintegrating Portulacaceae: A new familial classification of the suborder Portulacineae (Caryophyllales) based on molecular and morphological data. Taxon, 59(1), 227–240.
- Ocampo, G., & Columbus, J. T. (2012). Molecular phylogenetics, historical biogeography, and chromosome number evolution in Portulaca (Portulacaceae). Molecular Phylogenetics and Evolution, 63, 97–112.
- Ocampo, G., Koteyeva, N. K., Voznesenskaya, E. V., Edwards, G. E., Sage, T. L., Sage, R. F., & Columbus, J. T. (2013). Evolution of leaf anatomy and photosynthetic pathways in Portulacaceae. American Journal of Botany, 100(12), 2388–2492.
- Packer, L., Gibbs, J., Sheffield, C., & Hanner, R. (2009). Barcoding methodology and applications: DNA barcoding and the mediocrity of morphology. Molecular Ecology Resources, 9(Supplement 1), 42–50. https://doi.org/10.1111/j.1755-0998.2009.02631.x
- Pečnikar, Z. F., & Buzan, E. V. (2013). 20 years since the introduction of DNA barcoding: from theory to application. Journal of Applied Genetics, 55(1), 43–52. https://doi.org/10.1007/s13353-013-0180-y 2013
- Percy, D. M., Argus, G. W., Cronk, Q. C., Fazekas, A. J., Kesanakurti, P. R., Burgess, K. S., Husband, B. C., Newmaster, S. G., Barrett S. C. H., & Graham S. W. (2014). Understanding the spectacular failure of DNA barcoding in willows (Salix): does this result from a trans-specific selective sweep? Molecular Ecology, 23, 4737–4756.
- Ratnasingham, S., & Hebert, P. D. N. (2007). BOLD: The barcode of life data system (http://www.barcodinglife.org). Molecular Ecology Notes, 7(3), 355–364. http://doi.org/10.1111/j.1471-8286.2007.01678.x
- Sandionigi, A., Galimberti, A., Labra, M., Ferri, E., Panunzi, E., De Mattia, F., & Casiraghi, M. (2012). Analytical approaches for DNA barcoding data: how to find a way for plants? Plant Biosystems, 146(4), 805–813. https://doi.org/10.1080/11263504.2012.740084
- Schori, M., & Showalter, A. M. (2011). DNA barcoding as a means for identifying medicinal plants of Pakistan. Pakistan Journal of Botany, 43, 1–4.
- Sdouga, D., Kabtni, S., Hakim, L., Branca, F., Trifi-Farah, N., & Marghali, S. (2018). Integrated analysis for identifying Portulaca oleracea and its subspecies based on chloroplastic and nuclear DNA barcoding. Plant Biosystems - An International Journal Dealing with All Aspects of Plant Biology, 153(1), 25–31. https://doi.org/10.1080/11263504.2018.1435575
- Sivarajan, V. V. (1981). Taxonomic notes of the genus Portulaca Linn. from India. Journal of Bombay Natural History Society, 78, 256–260.
- Spies, J. J., & Spies, P. (2018). Assessing Clivia taxonomy using the core DNA barcode regions, matK and rbcLa. Bothalia, 48(1), 1-8. a2025. https://doi.org/10.4102/abc.v48i1.2025
- Stallman, J. K., Funk, V. A., Price, J. P., & Knope, M. L. (2019). DNA barcodes fail to accurately differentiate species in Hawaiian plant lineages. Botanical Journal of the Linnean Society, 190(4), 374–388. https://doi.org/10.1093/botlinnean/boz024
- Suesatpanit, T., Osathanunkul, K., Madesis, P., & Osathanunkul, M. (2017). Should DNA sequence be incorporated with other taxonomical data for routine identifying of plant species? BMC Complementary and Alternative Medicine, 17, 437. https://doi.org/10.1186/s12906-017-1937-3
- Sun, L., Park, W-G., Kwon, O-W., & Hong, S-K. (2010). Ribosomal DNA internal transcribed spacer 1 and internal transcribed spacer 2 regions as targets for molecular identification of medically important Zanthoxylum schinifolium. African Journal of Biotechnology 9(30), 4661–4673. Retrieved from http://www.academicjournals.org/AJB
- Taberlet, P., Gielly, L., Pautou, G., & Bouvet, J. (1991). Universal primers for amplification of three non-coding regions of chloroplast DNA. Plant Molecular Biology, 17(5), 1105–1109.
- Tamura, K. (1992). Estimation of the number of nucleotide substitutions when there are strong transition-transversion and G + C content biases. Molecular Biology and Evolution, 9, 678–687.
- The Plant List. (2013). Version 1.1. Retrieved from http://www.theplantlist.org/
- Thompson, K. A., & Newmaster, S. G. (2014). Molecular taxonomic tools provide more accurate estimates of species richness at less cost than traditional morphology-based taxonomic practices in a vegetation survey. Biodiversity Conservation, 23, 1411–1424.
- Uddin, M. K., Juraimi, A. S., Hossain, M. S., Nahar, M. A. U., Ali, M. E., & Rahman, M. M. (2014). Purslane weed (Portulaca oleracea): A prospective plant source of nutrition, Omega-3 fatty acid, and antioxidant attributes. The Scientific World Journal, 2014, 951019. http://doi.org/10.1155/2014/951019
- Voznesenskaya, E. V., Koteyeva, N. K., Edwards, G. E., & Ocampo, G. (2010). Revealing diversity in structural and biochemical forms of C4 photosynthesis and a C3-C4 intermediate in genus Portulaca L. (Portulacaceae). Journal of Experimental Botany, 6, 3647–3662.
- Waldchen, J., Rzanny, M., Seeland, M., & Mader, P. (2018). Automated plant species identification —Trends and future directions. PLoS Computational Biology, 14(4), 1–19. e1005993. https://doi.org/ 10.1371/journal.pcbi.1005993
- Wang, X., Liu, C., Huang, L., Bengtsson‐Palme, J., Chen, H., Zhang, J., Cai, D., & Li, J. (2015). ITS1: A DNA barcode better than ITS2 in eukaryotes? Molecular Ecology Resources, 15, 573–586. https://doi.org/10.1111/1755-0998.12325
- Wongpiyasatid, A., & Hormchan, P. (2000). New mutants of perennial Portulaca grandiflora through gamma radiation. Kasetsart Journal (Natural Science), 34, 408–416.
- Wu, Z. Y., Raven, P. H., & Hong, D. Y. (Eds.) (2003). Flora of China, volume 5 (Ulmaceae through Basellaceae). Science Press, Beijing, and Missouri Botanical Garden Press, St. Louis. http://www.efloras.org/florataxon.aspx?flora_id=2&taxon_id=10724 downloaded 18th November 2019
- Xia, X., Xie, Z., Salemi, M., Chen, L., & Wang, Y. (2003). An index of substitution saturation and its application. Molecular Phylogenetics and Evolution, 26, 1–7.
- Xia, X., & Xie, Z. (2001). DAMBE: Software package for data analysis in molecular biology and evolution, Journal of Heredity, 92(4), 371–37. https://doi.org/10.1093/jhered/92.4.371
- Yang, J., Zhang, X., Zhang, W., Sun, J., Xie, Y., Zhang, Y., Burton, G. A., Jr, & Yu, H. (2017). Indigenous species barcode database improves the identification of zooplankton. PLoS ONE, 12(10), 1–15. e0185697. https://doi.org/10.1371/journal.pone.0185697
- Zhang, J-Q., Meng, S-Y., Wen, J., & Rao, G-Y. (2015). DNA Barcoding of Rhodiola (Crassulaceae): A case study on a group of recently diversified medicinal plants from the Qinghai-Tibetan Plateau. PLoS ONE, 10(3), 1–15. e0119921. https://doi.org/10.1371/journal. pone.0119921
- Zhang, A. B., He, L. J., Crozier, R. H., Muster, C., & Zhu, C. D. (2010). Estimating sample sizes for DNA barcoding. Molecular Phylogenetics and Evolution, 54, 1035–1039.
- Zhou, Y.-X., Xin, H.-L., Rahman, K., Wang, S.-J., Peng, C., & Zhang, H. (2015). Portulaca oleracea L. A review of phytochemistry and pharmacological effects. BioMed Research International, 2015, 1–11, 925631. http://doi.org/10.1155/2015/925631
Copyright information

This work is licensed under a Creative Commons Attribution-NonCommercial-NoDerivatives 4.0 International License.
About this article
Publication Date
12 October 2020
Article Doi
eBook ISBN
978-1-80296-088-4
Publisher
European Publisher
Volume
89
Print ISBN (optional)
-
Edition Number
1st Edition
Pages
1-796
Subjects
Business, innovation, sustainability, environment, green business, environmental issues, urban planning, municipal planning, disasters, social impact of disasters
Cite this article as:
Yee, F. J., Ping, Y. H., Fathimath, S., & Selvarajah, G. (2020). It Is? It Is Not? Identifying Portulaca by Morphology and DNA Barcodes. In N. Samat, J. Sulong, M. Pourya Asl, P. Keikhosrokiani, Y. Azam, & S. T. K. Leng (Eds.), Innovation and Transformation in Humanities for a Sustainable Tomorrow, vol 89. European Proceedings of Social and Behavioural Sciences (pp. 339-352). European Publisher. https://doi.org/10.15405/epsbs.2020.10.02.31