It Is? It Is Not? Identifying Portulaca by Morphology and DNA Barcodes
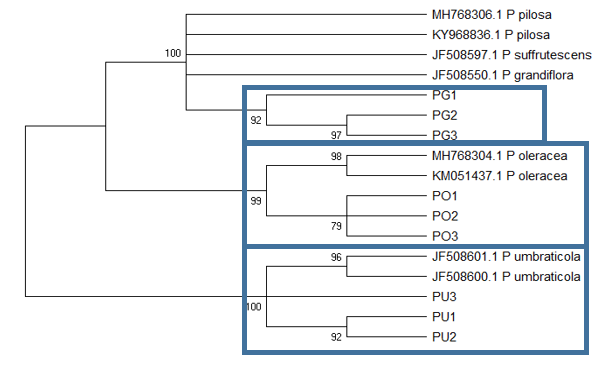
Figure 6: The Maximum likelihood tree based on ITS1 sequences inferred using the Tamura 3-parameter model (Tamura, 1992) with discrete Gamma distribution and some invariable sites. Bootstrap support is shown next to the branches. PO, PG, and PU represent P. oleracea, P. grandiflora, and P. umbraticola