It Is? It Is Not? Identifying Portulaca by Morphology and DNA Barcodes
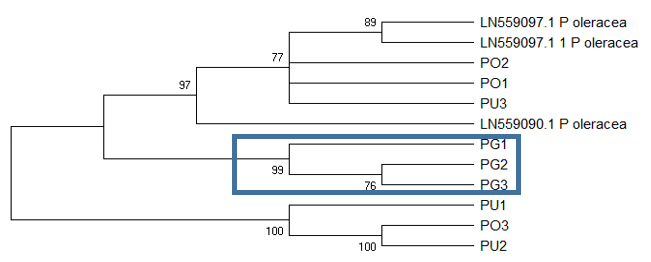
Figure 5: Maximum likelihood tree generated using trnL-F sequences inferred by using the Tamura 3-parameter model (Tamura, 1992), with a discrete Gamma distribution. Bootstrap values are shown next to the branches. PO, PG and PU represent P. oleracea, P. grandiflora, and P. umbraticola, respectively