
Comparison Of Stratified And Random Iterative Sampling In Evaluation Of Pls-Da Model

Abstract
Model evaluation is used to derive model performance index that indicates practical values of prediction model. In practice, it occurs in the last step of the statistical modelling pipeline; and various types of model evaluation methods or strategies have been proposed in the literature. Iterative resampling strategy is believed to be more reliable than sampling approach like Kennard-stone algorithm because it produces more than one test set to ensure better representativeness. Most of the iterative resampling methods available in commercial statistical software implement random resampling by default. This would produce biased estimator if the studied dataset is imbalanced,
Keywords: ATR-FTIR spectrumpartial least squares-discriminant analysis (PLS-DA)model validationforensic science
Introduction
Model evaluation is an important aspect along the statistical modelling pipeline, especially in the context of chemometrics. This is because it enables researchers to gain more insight about the potential of the prediction model in real-world settings. In fact, a wealth of model evaluation methods have been described in the literature ( Colins et al., 2014). Each is characterized by unique merits and pitfalls. Internal validation methods including
Recently, Lee, Liong, and Jemain ( 2018a) demonstrated the limitation of Kennard-stone sampling algorithm against the iterative random resampling approaches to derive model performance index via external testing method. On the other hand, Molinaro, Simon, and Pfeiffer ( 2005) reported comparative performances between different resampling methods, including
Problem Statement
In practice, resampling strategies can be implemented randomly or systematically. The former allows the same sample to be resampled without restriction. It allows more possible number of combinations than the latter because systematic resampling ensures each sample only assigned as test set once. Random resampling is easy to run but could produce biased estimate if the dataset is imbalanced,
Research Questions
This work aims to find answer for two different but related research questions:
What is the difference between stratified random iterative sampling (RIS) and stratified iterative sampling (SIS) in external testing method?
Does the relative difference between stratified and random resampling strategies affected by the number of iterations and PLS components?
Purpose of the Study
The purpose of this work is to examine merits and pitfalls of stratified (SIS) and random (RIS) resampling in external testing method. The PLS-DA technique and ATR-FTIR spectrum were used to construct the prediction models.
Research Methods
All statistical analysis was performed using the R environment for statistical computing and graphics, version 3.5.0 ( R Core Team 2018). PLS-DA was performed with ‘caret’ package ( Kuhn, 2019) and AsLS via ‘baseline’ package ( Liland & Mevik, 2015).
ATR-FTIR Spectral Dataset
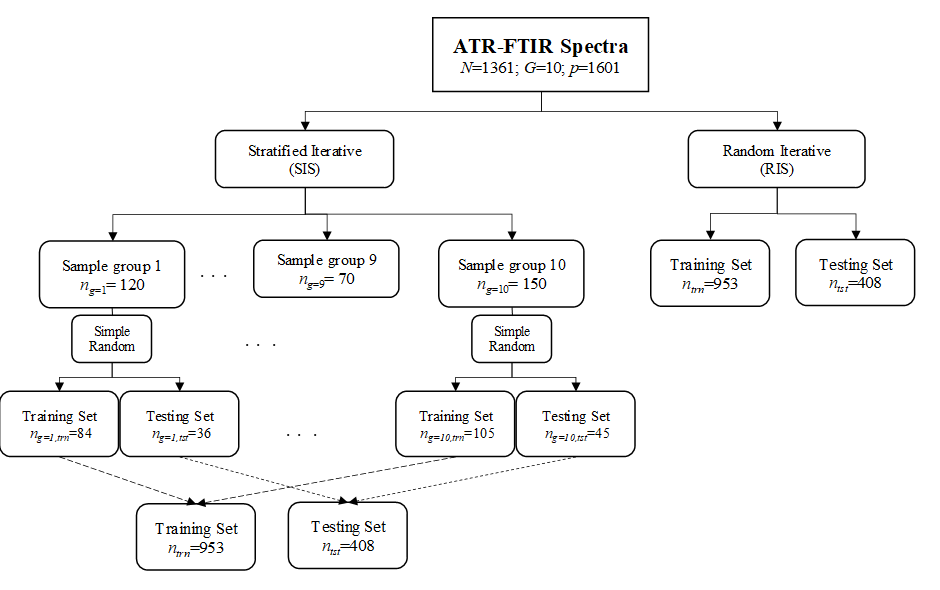
The primary spectral dataset consisting of 1361 samples and 5401 variables has been studied and reported elsewhere (Lee, Liong, & Jemain, 2018b, 2018c, 2019a, 2019b). The practical purpose of classification model is to predict brand of unknown pen inks using based on ATR-FTIR spectrum of the ink entry. Table
Partial Least Squares-Discriminant Analysis (PLS-DA) Method
The dataset was split into 7:3 training and test sets using stratified (SIS) and random (RIS) iterative sampling strategies. Both strategies were repeated for
where
Model Validation
The dataset was split into 7:3 training and test sets using stratified (SIS) and random (RIS) iterative sampling strategies. Both strategies were repeated for
where
Comparison Analysis
The two resampling strategies were compared using descriptive and inferential statistics as well as exploratory tool, i.e. principal component analysis (PCA). The list of accuracy rates were used to compute mean
where
Findings
The performances of RIS and SIS were compared sequentially
In addition, the respective CV values reduce as the model includes more number of PLS components. It can be clearly seen from Table
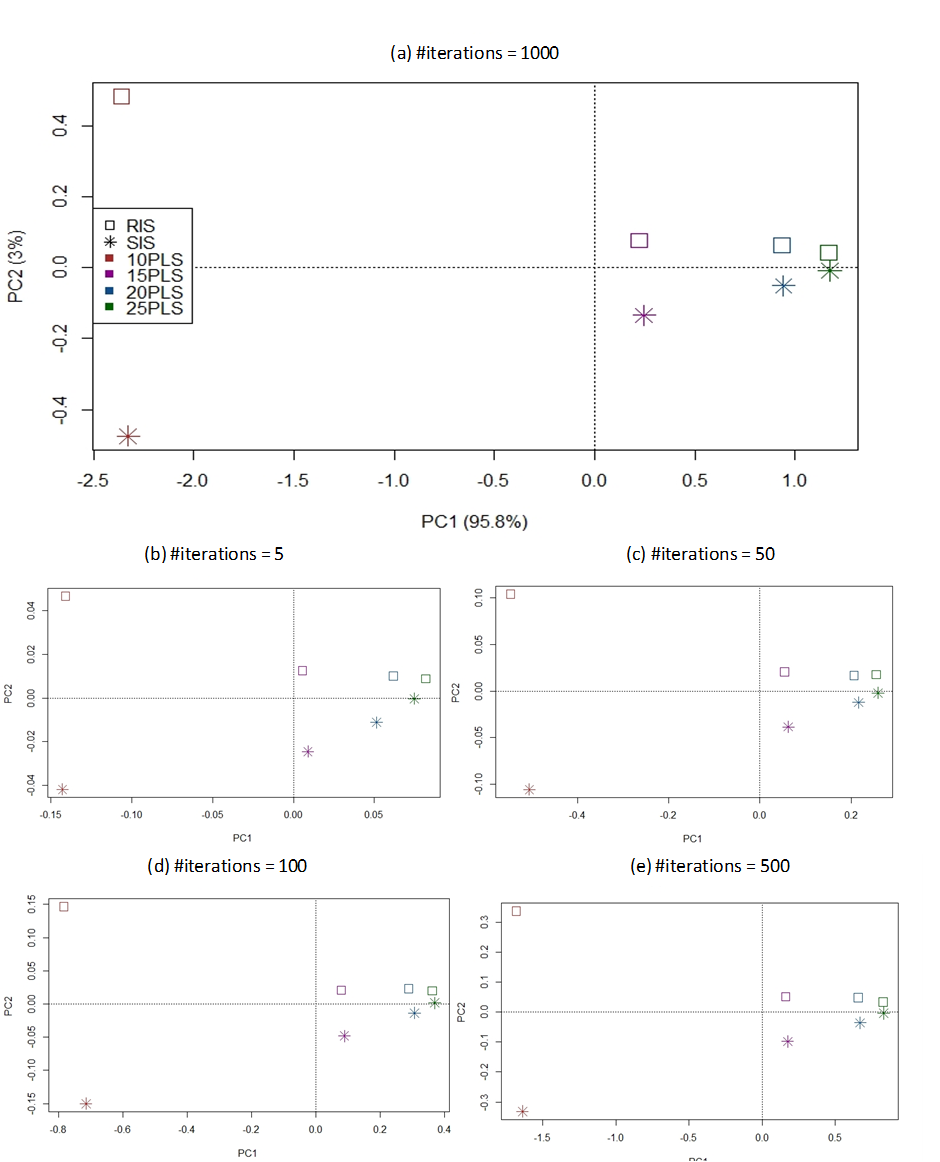
Figure
In other words, this indicates both RIS and SIS are quite similar in performances. This provides evidence to state that stratification is not necessary in validating a colossal, multi-class and imbalanced spectral dataset. However, this is not in line with previous work stated stratified sampling shall be preferred in imbalanced dataset ( Kohavi, 1995). Such discrepancy can be partly explained by the fact that the studied dataset is of colossal size; and each group has been represented by rather large sample size. As a result, the relative class proportions show less deviations between the different drawn even simple random techniques has been adopted.
Conclusion
This work has compared empirical performances between random (RIS) and stratified (SIS) iterative sampling methods in PLS-DA model. It is concluded that simple random resampling can be as reliable as stratified resampling in deriving model performance using imbalanced dataset if the dataset is of colossal size.
Acknowledgments
This work was supported by the CRIM, UKM (GUP-2017-043).
References
- Bro, R., & Smilde, A.K. (2014). Principal component analysis. Analytical Methods, 6, 2812-2831.
- Colins, G. S., de Groot, J. A., Dutton, S., Omar, O., Shanyide, M., Tajar, A. … & Altman, D.G. (2014). External validation of multivariate prediction models: a systematic review of methodological conduct and reporting. BMC Medical Research Methodology, 14, 40.
- Consonni, V., Ballabio, D., & Todeschini, R. (2010). Evaluation of model predictive ability by external validation techniques. Journal of Chemometrics, 24, 194-201.
- Eilers, P. H. C., & Boelens, H. F. M. (2005). Baseline correction with Asymmetric Least Squares Smoothing. Leiden University Medical Centre.
- Hawkins, D. M. (2004). The problem of overfitting. Journal of Chemical Information and Computer Sciences, 44, 1-12.
- Kohavi, R. (1995). A study of Cross-validation and Bootstrap for Accuracy Estimation and Model Selection. In International Joint Conderence on Artificial Intelligence (IJCAI). Retrieved from https://www.researchgate.net/profile/Ron_Kohavi/publication/2352264_A_Study_of_Cross-Validation_and_Bootstrap_for_Accuracy_Estimation_and_Model_Selection/links/02e7e51bcc14c5e91c000000.pdf
- Kuhn, M. (2019). Classification and Regression Training. Package ‘caret’. Version 6.0-83.
- Lee, L. C., Liong, C. Y., & Jemain, A. A. (2018a). Iterative random vs. Kennard-stone sampling for IR spectrum-based classification task using PLS2-DA. AIP Conference Proceedings, 1940, 020116-1-020116-5.
- Lee, L. C., Liong, C. Y., & Jemain, A. A. (2018b). Validity of the best practice in splitting data for hold-out validation strategy as performed on the ink strokes in the context of forensic science. Microchemical Journal, 139, 125-133.
- Lee, L. C., Liong, C. Y., & Jemain, A. A. (2018c). Effects of data pre-processing methods on classification of ATR-FTI spectra of pen inks using partial least squares-discriminant analysis (PLS-DA. Chemometrics and Intelligent Laboratory Systems, 182, 90-100.
- Lee, L. C., Liong, C. Y., & Jemain, A. A. (2019a). Statistical comparison of decision rules in PLS2-DA prediction model for classification of blue gel pen inks according to pen brand and pen model. Chemometrics and Intelligent Laboratory Systems, 184, 94-101.
- Lee, L. C., Liong, C. Y., & Jemain, A. A. (2019b). Predictive modelling of colossal ATR-FTIR spectral data using PLS-DA: Empirical differences between PLS1-DA and PLS2-DA algorithms. Analyst, 144, 2670-2678.
- Liland, K. H., & Mevik, B-H. (2015). Baseline Correction of Spectra. Version 1.2-1. Retrieved from http://cran.r-project.org/package=baseline
- Molinaro, A. M., Simon, R., & Pfeiffer, R. M. (2005). Prediction error estimation: a comparison of resampling methods. Bioinformatics, 21, 3301-3307.
- R Core Team (2018). R: A language and environment for statistical computing. R Foundation for Statistical Computing, Vienna, Austria. Retrieved from https://www.R-project.org/
- Refaeilzadeh, P., Tang, L., & Liu, H. (2009). Cross-validation. In Encyclopedia of Database Systems (pp. 532-538). Berlin Heidelberg: Springer.
Copyright information

This work is licensed under a Creative Commons Attribution-NonCommercial-NoDerivatives 4.0 International License.
About this article
Publication Date
30 March 2020
Article Doi
eBook ISBN
978-1-80296-080-8
Publisher
European Publisher
Volume
81
Print ISBN (optional)
-
Edition Number
1st Edition
Pages
1-839
Subjects
Business, innovation, sustainability, development studies
Cite this article as:
Lee, L. C. (2020). Comparison Of Stratified And Random Iterative Sampling In Evaluation Of Pls-Da Model. In N. Baba Rahim (Ed.), Multidisciplinary Research as Agent of Change for Industrial Revolution 4.0, vol 81. European Proceedings of Social and Behavioural Sciences (pp. 648-656). European Publisher. https://doi.org/10.15405/epsbs.2020.03.03.75