
Methods Of Statistical Analysis In The Management Of Smart Cities

Abstract
The article deals with the correlation and regression analysis as a tool of digital technology. The emphasis is on the development of smart cities. During the study, an extensive literature review was conducted and the main indicators defining smart cities were highlighted. It was found that the indicators characterizing the quality of life of the population should be considered as key indicators. Correlation analysis of the processing of statistical data on the influence of some indicators of cities on others has been carried out. According to the results of the analysis, indicators with varying degrees of influence are highlighted. The indicators gave a preliminary idea of which direction the city should take when developing a smart city strategy. The result of the study of 16 cities of the Russian Federation on the analysis of the level of development of the “Smart City” technologies became indicators characterizing the development of 7 key areas of the smart city. The analysis of the relationship between smart city indicators and indicators that, in our opinion, can influence the creation of favorable conditions for the implementation of Smart City projects was also conducted. The study found dependencies and tendencies, as well as the ability to classify them.
Keywords: Digital technologiesregression analysissmart city
Introduction
“Smart City” is a systematic approach to the use of information technology based on real-time data analysis for the provision of natural, energy and urban resource management services that promote sustainable economic development and ensure high living standards.
We determined that in the implementation of strategic planning for the development of municipal entities of territorial units at the local level, the indicators that should be used to assess the quality of life should be considered key. Based on this, the goal-setting of the “Smart City” project is to focus on the needs and competencies of human capital; the use of technological approaches to the organization and management of urban infrastructure; increasing the values of qualitative and quantitative indicators characterizing the efficiency of the city resource management process; organization of a comfortable and safe environment for living; increasing the estimated indicators of the state and development level of the urban environment and its ability to meet the needs and wishes of residents at the level of norms and living standards generally accepted during the period under consideration, that is, to ensure an adequate quality of life for the population (Trindade, Hinning, & da Costa, 2017; Stroyev, 2017; Purnomo, 2016; Argunova, 2016).
As a result, it can be stated that the indicators for predicting the socio-economic development of cities, in the context of ensuring sustainable socio-economic development, should be formed in such a way as to allow improvements in the achievement of indicators characterizing the quality of life.
Problem Statement
The concept of a smart city is widely interpreted, but with each approach, information and telecommunication technologies play a key role, helping to effectively support the current processes of urban life and solve emerging problems through the participation of citizens, enterprises and government agencies.
Let us analyze the conceptual apparatus of the “smart city” used by domestic and foreign authors (Table
For our study, we define “smart city” as a system of information and communication technologies aimed at improving the quality of urban life through the digitalization of basic urban services.
Research Questions
Currently, elements of a “smart city” are being introduced in different cities. But how to understand in what directions administrations need to put the greatest efforts? How to measure the current state of “cleverness” of the city? To answer these questions, we will use indicators that assess the current state of the urban economy and show how technology can improve indicators.
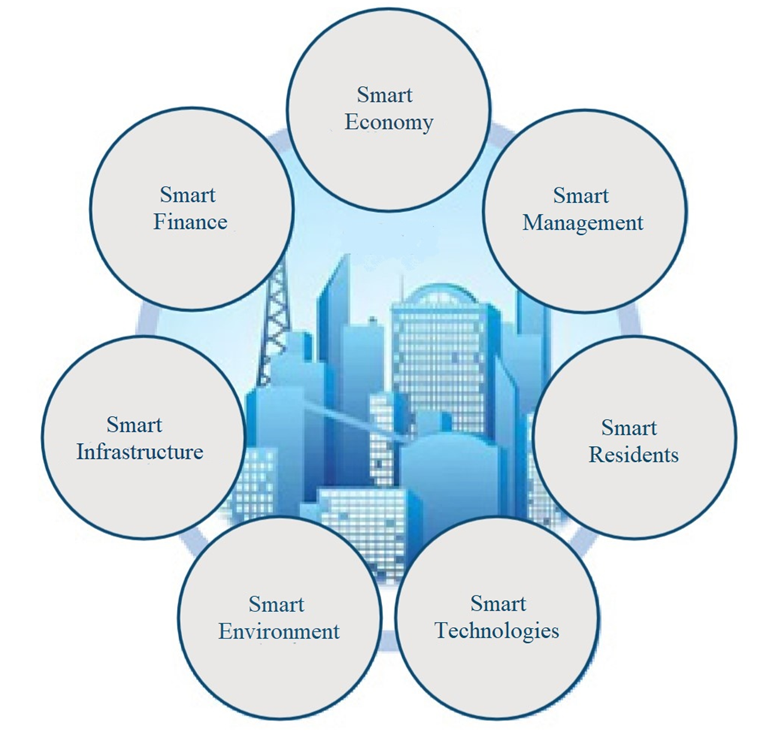
The starting point of this study was the report on the results of the research work “Indicators of smart cities NIITS 2017”, conducted by the National Research Institute of Technology and Communications (Website of the National Research Institute of Technology and Communications, n. d.), during which indicators were developed that can be used to identify the level of development of technologies of the “smart city” in Russian cities. The indicators gave a preliminary idea of which direction the city should take when developing a smart city strategy (Website of the Ministry of Construction of Russia, n. d.). The result of the study of 16 cities of the Russian Federation on the analysis of the level of development of the “Smart City” technologies became indicators characterizing the development of 7 key areas of the smart city (Figure
The characteristics of the cities studied according to the city budget in 2017 per capita and the quality of development are presented in the graph (Figure
So, we see that the leaders in the development of smart city technologies are Moscow and St. Petersburg. They are followed by the effectively developing cities of Kazan and Yekaterinburg, and Samara and Volgograd, as analysis has shown, have just begun to actively implement IT technologies.
As noted above, the quality of life is an important strategic indicator of a “smart city”, which is fundamental in developing a strategy for the development of various territorial entities – these are municipalities, regions, and the whole country. In accordance with the regulatory documents considered by us, the Strategies for the development of various entities, the achievement of this main strategic goal is possible only based on the effective use of the natural and resource potential, transport and geographical location, as well as socio-demographic potential. To develop a science-based scenario of socio-economic development, the ways, and mechanisms for achieving the goal, it is necessary to have a large amount of reliable, relevant, constantly changing information.
Purpose of the Study
The aim of our study is to evaluate the advantages of statistical analysis methods, in particular, correlation and regression analysis, for the purposes of socio-economic development of cities.
Research Methods
Based on the available information characterizing the indicators of the development of territories using information technologies, it is possible to develop a mathematical model to calculate the integral (composite) indicator of a smart city.
The construction of a mathematical model for calculating the integral index of the “Smart City” for the subsequent filling of databases (DB) and knowledge (KB) of the city’s decision-making information support system begins with an analysis of the correlations between variables characterizing the object of study (Website of the Ministry of Construction of Russia, n. d.). Consider the implementation of the correlation analysis of statistical data processing on the influence of some indicators of cities on others. To determine the relationship between the criteria, the pair correlation coefficient was used:
where M is the expectation operator; mx, my, σx, σy -, respectively, the expectation and standard deviations of random variables X and Y.
The coefficient of pair correlation between two variables indicates the strength of the connection and can take values between -1 and +1, and if the value is closer to 1, this means the presence of a strong bond, and if closer to 0, then weak.
If the correlation coefficient is negative, it means that there is an opposite relationship: the higher the value of one variable, the lower the value of the other. The strength of the connection is also characterized by the absolute value of the correlation coefficient.
For a verbal description of the magnitude of the correlation coefficient, the following gradations are used (see Table
To assess the impact of the developed key indicators on the integral indicator of the development of the “Smart City”, descriptive statistics were calculated (see Table
According to the results of the calculations, we note that there is:
high impact (0.7 <= r <0.9) on the integral indicator from the following indicators: Indicator “Smart Residents” (r = 0.726); Smart Finance indicator (r = 0.722);
average impact (0.5 <= r <0.7) is noted for the indicators: Smart Management indicator (r = 0.631); Smart Infrastructure indicator (r = 0.592); Smart Technologies indicator (r = 0.590); Smart Economy Indicator (r = 0.566),
weak influence (0.2 <= r <0.5) is marked for the indicator “Smart Environment” (r = 0.356).
All indicators excluding the indicator “Smart Environment” (p = 0.173) are significant (p <0.05).
Findings
Let’s define the concept of “quality of life”. “Quality of life” is a category that characterizes the price of a certain set of conditions and indicators of life of the population, which is based, as a rule, on its own satisfaction with the conditions and indicators mentioned above that ensure a proper acceptable standard of living. This concept is much broader than the standard of living provided by material goods, and in its composition it has, in particular, both objective and subjective components, which include: the presence and level of health, life expectancy, climatic conditions, external environment, convenience in everyday life, social environment, ensuring a sufficient level of satisfaction of cultural and spiritual needs and the like.
We conducted a correlation-regression analysis of indicators of socio-economic development of the largest and most developed cities in Russia: Moscow, St. Petersburg, Kazan, Yekaterinburg, Krasnoyarsk, Novosibirsk, Ufa, Sochi, Perm, Rostov-on-Don, Voronezh, Chelyabinsk, Nizhny Novgorod, Omsk, Volgograd, Samara, Krasnodar, Saratov, Tyumen, Makhachkala, Tolyatti, Barnaul, Izhevsk, Ulyanovsk, Irkutsk, Yaroslavl, Naberezhnye Chelny, Belgorod, Surgut, Nizhnevartovsk, Veliky Novgorod. Of these, the first 16 cities are included in the “Smart Cities of Russia” rating compiled by NIITS (Tihov, 2016).
For these cities, a comparison was made on 50 indicators of the socio-economic development of cities obtained on the website of the Federal State Statistics Service (Website of the Federal State Statistics Service, n. d.).
First, we analyzed the relationship between smart city indicators and indicators that, in our opinion, can influence the creation of favorable conditions for the implementation of Smart City projects. As such indicators were selected data presented in Table
While the calculations, the following dependencies were identified:
1. The indicator “Budget investments to increase the value of fixed assets” showed the greatest degree of correlation with the values of rating indicators: the final indicator (Pearson correlation - 0.642), the indicator “Smart management” (Pearson correlation - 0.653), the indicator “Smart technologies” (Pearson correlation - 0.624), “Smart Infrastructure” indicator (Pearson correlation – 0.572), “Smart Economy” Indicator (Pearson correlation – 0.614), “Smart Finance” indicator (Pearson correlation - 0.628), “Smart Residence” indicator (Pearson correlation – 0.602) Indicator “Smart Environment”(Pearson correlation - 0.574).
2. The indicator “Investments in fixed assets carried out by organizations located on the territory of the municipality (without small businesses) (average – 2015-2017)” ranks second in terms of interrelation: the final indicator (Pearson correlation is 0.527), “Smart management” indicator (Pearson correlation - 0.728), “Smart Technologies” indicator (Pearson correlation – 0.566), “Smart Infrastructure” indicator (Pearson correlation - 0.626).
3. In the third place in terms of the degree of interconnection is the indicator “Average annual population”: the final indicator (Pearson correlation – 0.544), the indicator “Smart management” (Pearson correlation – 0.732), the indicator “Smart technologies” (Pearson correlation – 0.584), Indicator “Smart Infrastructure” (Pearson correlation - 0.636).
4. A rather close correlation is observed in the indicator “Average monthly nominal accrued wages of employees of large, medium-sized enterprises and non-profit organizations of the urban district” and the indicator “Smart management” (Pearson correlation – 0.445).
Next, we carried out calculations on indicators of the socio-economic development of cities, which are related to the indicators used to assess the effectiveness of the activities of local governments of urban districts and municipal districts. These data, in our opinion, can characterize the degree or indicate the level of application of technologies in the city attributable to the Smart City models. These indicators included more than forty indicators, for example, the average annual growth rate of the permanent population; revenues of the local budget, actually executed, 2017; the growth rate of local budget revenues actually executed (average annual) presented; the number of small and medium-sized businesses per 10 thousand people of the population and other indicators characterizing the socio-economic development of cities.
Our calculations showed the presence of correlations between indicators of socio-economic development and indicators of smart cities NIITS, but at a low level (Pearson correlation is less than 0.4) revealed by the following indicators.
1. The indicator “The share of the average number of employees (without external part-time workers) of small and medium-sized entrepreneurs in the average number of workers (without external part-time workers) of all enterprises and organizations”. The interrelation with the NIITS indicators was revealed: the final indicator, the indicators “Smart Technologies”, “Smart Economy”, “Smart Finance”, “Smart Residents” and “Smart Environment”.
2. The indicators “Number of hospital beds” and “Number of doctors of all specialties” show the relationship with the total indicator, as well as with the indicators “Smart management”, “Smart technologies”, “Smart infrastructure”.
3. The indicator “Caught and neutralized pollutants as a percentage of the total amount of pollutants from stationary sources” shows the relationship with the indicator “Smart Environment”.
4. The indicator “The average duration of the period from the date of filing an application for a building permit to the date of obtaining a building permit shows the relationship with the Smart Environment indicator.
5. The indicators “Average monthly nominal accrued wages of employees of municipal kindergartens” and “Average monthly nominal accrued wages of employees of municipal general education institutions” show the correlation with the indicator “Smart management”.
6. The indicator “The proportion of children aged 1-6 years receiving pre-school educational services and (or) services for their maintenance in municipal educational institutions, in the total number of children aged 1-6 years,” shows the relationship with the indicators of “Smart Environment”, “Smart Finance”, “Smart Infrastructure”.
7. The indicator “The number of municipal services provided by local governments and municipal institutions” shows the relationship with the indicators “Smart Management” and “Smart Technologies”.
8. The indicators “Specific value of electric energy consumption in apartment buildings per resident”, “Specific value of natural gas consumption in apartment buildings per resident” and “Specific value of hot water consumption by municipal budget institutions per person of the population” show the relationship with the indicator “Smart management”.
After that, we compared the values of average values in terms of socio-economic development of cities that were included in the rating of smart cities by NIITS and other cities.
Conclusion
A test of the average values of socio-economic development indicators for two groups of cities demonstrates the presence of significant differences for all analyzed averages except for two indicators: 1) Budget investments for increasing the value of fixed assets (p = 0.02), hypothesis according to Leuven’s tetra of equality of variances accepted as p = 0.01 and 2) The proportion of children aged 1-6 years who receive pre-school educational services and (or) services for their maintenance in municipal educational institutions in the total number children aged 1-6 years (p = 0.029), despite the fact that the hypothesis according to the Teton Levene about equality of dispersions is not accepted, since p = 0.682,
For all other variables, the differences are significant (p <0.05), which indicates the difference in parameters for smart cities and the rest.
A comparison of average values of indicators shows that for 30 indicators (out of 50), the best values are observed for cities that are in the “Indicators of smart cities” rating.
Thus, the results obtained during the analysis, allow us to divide the analyzed indicators into two groups:
1) Resource – indicators evaluating conditions and opportunities conducive to the implementation of Smart City projects: “Budget investments to increase the value of fixed assets”, “Average annual population of the city”, “Investments in fixed capital carried out by organizations located in the municipality”. According to these indicators, there is a clear trend – the higher the indicator, the more opportunities for the successful implementation of Smart City projects.
2) The result – indicators, the value of which increases with increasing values of the indicator (s) rating “Smart City”. For example, an increase in the “Smart Environment” indicator leads to an increase in the indicator “Pollutants caught and neutralized as a percentage of total pollutants from stationary sources”, while the indicators “Smart Management” and “Smart Technologies” have a direct relationship with the indicators “Number hospital beds and the number of doctors of all specialties. Some indicators of this group can be attributed to the indicators of quality of life: “Average monthly nominal accrued wages ...”, “Percentage of children aged 1-6 years who receive pre-school educational services and (or) services for their maintenance in municipal educational institutions, in general, the number of children aged 1-6 years”, “The number of municipal services provided by local governments, municipal institutions”, etc.
The presence of the above dependencies and trends, as well as the ability to classify them into the above groups, in the long term, while improving the method of calculating the Smart City rating indicators, the appearance of these indicators over several years may allow building economic and mathematical models for assessing the economic and social effectiveness of the implementation of Smart City projects.
So, using the planning values of resource indicators, one can predict the potential values of the indicators of the Smart City rating, and using the obtained forecast values of the indicators, one can predict the values of performance indicators (including quality of life indicators) and assess the effectiveness of such projects on this basis.
Indicators allow you to see the strengths and weaknesses of the city’s infrastructure and form priority directions for the development of smart cities and achieve the main goal - improving the quality of life of the population.
Acknowledgments
The article was prepared with the financial support of the Russian Foundation for Basic Research (project No. 18-410-860009).
References
- Argunova, M. V. (2016). Model of a “smart city” as a manifestation of a new technological structure. Science and School, 3, 14-23.
- Bosch, P., & Neumann, H. M. (2017). CITYkeys indicators for smart city projects and smart cities. Technical Report, 2, 22-29.
- Drozhzhinov, V. I. (2017). Smart Cities: Models, Tools, Rankings and Standards. International Journal of Open Information Technologies, 5(3), 19-48.
- Ekman, U. (2018). Smart City Planning. International Journal of E-Planning Research, 7(3), 1-21.
- Purnomo, F. (2016). Smart City Indicators: A Systematic Literature Review. Emerging Technologies in Communication and Computer Engineering for Smart City Applications, 8(3), 161-164.
- Soldatov, S. (2015). Smart City – the city of the future. Rational Enterprise Management, 5-6, 46-51.
- Stroyev, P. V. (2017). “Smart city” as a new stage of urban development. Economics in industry, 10(3), 103-214.
- Tai-hoon, K., Ramos, C., & Mohammed, S. (2017). Smart City and IoT. Future generation computer systems. Elsevier Science, 76, 159-162.
- Tihov, A. A. (2016). Analysis of the SmartCity model adapted to the Russian conditions of urban planning on the basis of the SMART. City Kazan project, 7-2(21), 70-83.
- Trindade, E. P., Hinning, M. P., & da Costa, E. M. (2017). Sustainable development of smart cities: a systematic review of the literature. Journal of Open Innovation: Technology, Market, and Complexity, 3, 11.
- Website of the Federal State Statistics Service. (n. d.). Retrieved from http://www.gks.ru/wps/ wcm/connect/rosstat_main/rosstat/ru/statistics/munStat/
- Website of the Ministry of Construction of Russia. (n. d.). Retrieved from http://gorodsreda.ru/ meropriyatiya/forumy/pasport-proekta-umnyy-gorod-podderzhan-rabochey-gruppoy-minstroya-rossi
- Website of the National Research Institute of Technology and Communications. (n. d.). Retrieved from http://niitc.ru/publications/
Copyright information

This work is licensed under a Creative Commons Attribution-NonCommercial-NoDerivatives 4.0 International License.
About this article
Publication Date
31 December 2019
Article Doi
eBook ISBN
978-1-80296-076-1
Publisher
Future Academy
Volume
77
Print ISBN (optional)
-
Edition Number
1st Edition
Pages
1-1056
Subjects
Industry, industrial studies, project management, sustainability, business, innovation
Cite this article as:
Shutro*, E., Zavedeev, E., & Zubareva, L. (2019). Methods Of Statistical Analysis In The Management Of Smart Cities. In I. O. Petrovna (Ed.), Project Management in the Regions of Russia, vol 77. European Proceedings of Social and Behavioural Sciences (pp. 227-236). Future Academy. https://doi.org/10.15405/epsbs.2019.12.05.27