
Composite Indices Of Life Quality For Monitoring Of Sustainable Development Goals

Abstract
To facilitate the implementation of the Sustainable Development Goals, it is necessary to establish mechanisms for monitoring progress in the implementation of these Goals. For this, first of all, it is necessary to ensure the collection of high-quality, affordable and relevant data and develop a tool for analyzing a large data pool. International and national groups of experts on indicators of achievement of the Sustainable Development Goals so far only form indicator systems for monitoring the implementation of these goals at the global and national levels. Success in achieving the Sustainable Development Goals can be assessed based on statistics using an objective composite index. The tool for constructing such a composite index is the principal component analysis, which determines the weights of indicators as a characteristic of the structure of the system according to a series of observations. This method takes into account the presence of fatal errors in the data. The priority for sustainable development in Russia today is to improve the quality of life of the population. The definition of quality of life as a composite index uses many parameters that measure the solution of tasks set by the social Goals of sustainable development. The proposed index of the quality of life of the population provides objective results of monitoring changes in the quality of life of the population of the subjects of the Russian Federation. Improving the quality of life and reducing inequalities within the country indicate the country's progress towards the Sustainable Development Goals.
Keywords: Composite indexdata errorslife quality of the populationprincipal component analysissustainable development goals
Introduction
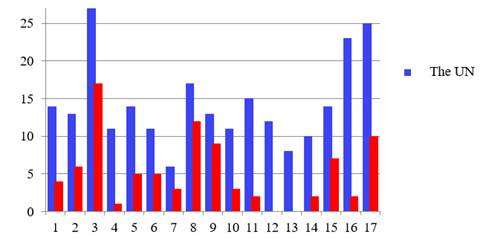
Today, the concept of sustainable development is understood as achieving a sustainable balance between the economic, environmental and social dimensions of human development. It is this interpretation of the concept of sustainable development that served as the ideological basis for the adoption in 2015 of the “Agenda for Sustainable Development”. This document was developed under the auspices of the UN and was adopted on September 25, 2015 by 193 states (resolution of the UN General Assembly - A/70/L.1). The document names 17 Sustainable Development Goals for the period from 2015 to 2030, which specify 169 goals and 244 indicators.
The stated goals and objectives are comprehensive and should ensure the balance of sustainable development components. They must be achieved within 15 years. Of the 17 goals listed, 11 can be attributed to social development, 3 to economic development and 3 to environmental one. Social goals include the “universal elimination of poverty”, improving nutrition, ensuring a healthy lifestyle and quality education, ensuring security and a solid infrastructure in human settlements, decent work for all and promoting well-being. A separate line spelled out the goal – “Reducing inequality within and between countries”.
Sustainable Development Goals (SDGs) are not legally binding on governments of signatory countries. However, it is supposed that governments will establish national mechanisms to help achieve the stated goals and monitor progress towards the goals. In June 2017, by order of the Government of the Russian Federation, Federal State Statistics Service (Rosstat) was entrusted with the task of coordinating the activities of subjects of official statistics on the generation and submission to international organizations of official statistical information on indicators of achievement of the Sustainable Development Goals of the Russian Federation in accordance with accepted international standards for the exchange of statistical data. As of 2019, on the Rosstat Web portal, in the section “On Sustainable Development Goals”, out of 244 global indicators, 19 are under development (7%), 156 are not being developed (64%), 69 are being developed (28%), i.e. today, more than half of global indicators for achieving goals and objectives in the field of sustainable development are not considered by Rosstat.
The Sustainable Development Goals (SDGs) and related challenges are global in nature, but at the same time they take into account different national circumstances and respect national priorities. The system of global indicators for achieving the goals and objectives in the field of sustainable development should be supplemented by indicators of regional and national levels. Rosstat proposed 364 indicators to the national set of indicators for the Sustainable Development Goals, in which the emphasis is made on 12 areas from the Decree of the President of the Russian Federation of May 7, 2018 “On national goals and strategic objectives of the development of the Russian Federation for the period until 2024”. The section on the Rosstat Web portal “On Sustainable Development Goals” is also under development and invites all interested parties to discuss the draft list of national SDG indicators.
Problem Statement
The concept of sustainable development in its current form is largely a reflection of the complexity of the functioning of the human community of society as a whole. Therefore, the dynamics of sustainable development is difficult to unambiguously translate into specific numerical values. However, there are various composite indicators that allow measuring complex social phenomena. When solving the problems of managing social systems, composite indices characterizing the quality of managed systems are widely used.
According to UN data, 290 composite indices for ranking or a comprehensive assessment of countries according to various parameters existed by 2011 (Bandura, 2011). The Organization for Economic Co-operation and Development (OECD), the European Union, the World Economic Forum, the International Monetary Fund and other international organizations are constructing composite indicators in various fields (Bandura, 2011; Nardo, Saisana, Saltelli, & Tarantola, 2005). The main goal of most of the indicators used is the ranking and comparative analysis of objects for some aggregate measure (Bandura, 2011; Foa & Tanner, 2012; Saltelli, 2007; Sharpe, 2004). For example, the Human Development Index (HDI), until 2013 the “Human Potential Development Index” (HPDI), is an integral indicator calculated annually to compare and measure the standard of living, literacy, education and longevity in different countries as the main characteristics of the human potential of the territory under study. The Human Development Index is a standard tool when comparing the living standards of different countries and regions.
The creators of composite indices believe that the integral characteristic adequately describes reality, and this characteristic is extremely useful for attracting the interest of the public, the media and the attention of governing structures. From the point of view of opponents of integral characteristics, to assess a complex phenomenon, it is enough to form a set of suitable indicators. The main argument of opponents of composite indices is the arbitrariness of the choice of determining weights when calculating a composite indicator, with the help of them the variables being combined into a single characteristic. A discussion of different points of view is given in works (Nardo, Saisana, Saltelli, Tarantola, Hoffmann, & Giovannini, 2008; Foa & Tanner, 2012).
The use of composite indices using objective (formal) methods to track the dynamics of processes taking place in society will give fairly objective assessments of success or failure in achieving the Sustainable Development Goals. While a pool of indicators that describe the solution of the tasks defined by the Sustainable Development Goals is being formed at the international and national levels, sustainable development can be measured using available data and tools.
Research Questions
Figure
The quality of life as the target criterion for the socio-economic development of Russia was first identified by the President of the Russian Federation in 2004 in his Address to the Federal Assembly. In subsequent years, senior officials of the state in their speeches repeatedly emphasized the importance of orienting socio-economic policies towards improving the quality of life of the population. The Decree of the President of the Russian Federation of May 7, 2018 “On National Goals and Strategic Tasks of the Development of the Russian Federation for the Period until 2024” is a decisive breakthrough plan to improve the living standards of the Russian population. In his subsequent speeches, the President of Russia repeatedly emphasized that improving the quality of life of the Russian population, reducing the number of people living below the poverty line, is Russia's national interest. It can be stated that after the “May Decrees” of the President of the Russian Federation Vladimir Putin, the problem of measuring and assessing the quality of life of the population of Russia moved into the plane of practical tasks. It can be stated that after the “May Decrees” of the President of the Russian Federation Vladimir Putin, the problem of measuring and assessing the quality of life of the population of Russia moved into the plane of practical tasks. Consequently, the need to obtain objective results of monitoring changes in the quality of life becomes more urgent.
The definition of quality of life as a composite index uses many parameters that measure the solution of the tasks set by the Sustainable Development Goals. Consequently, an increase in the quality of life will indicate a country's progress towards the Sustainable Development Goals.
Purpose of the Study
The data for calculating the composite index of life quality are statistics. But any measurement, including statistical, is determined by the accuracy of the measuring device, so the measurement result always contains an inevitable error.
It is impossible to obtain an accurate numerical characteristic of an object by a single measurement, which inevitably contains an error. However, in the presence of a series of measurements containing errors, the calculation of the unknown characteristics of the object is possible. Assuming the inevitable presence of errors in the data used, the construction of the integral characteristic of the system can be considered as the problem of extracting a useful signal against the noise background from a series of observations.
The aim of the work is to build an objective assessment of changes in the quality of life of the population of the constituent entities of the Russian Federation from a series of observations to monitor progress in the implementation of the Sustainable Development Goals.
Research Methods
Let us consider the construction of an integral estimate of a system consisting of
(1)
or for object
(2)
where
is the vector of composite indicators for observation
The data are pre-converted: the values of the variables are given on the interval [0, 1] according to the principle: “the more, the better” as follows. If the initial indicator
, (3)
where the value
If within the range of the indicator there is a value
. (4)
For each object it is required to give a motivated assessment over the entire observation interval, i.e. determine the integral characteristic of a change in system quality. This requires finding the weights of the indicators for every moment in time.
Despite the simplicity of determining weight indicators using expert estimates, this method is far from objective. In 2008, the Organization for Economic Co-operation and Development (OECD), together with the Joint Research Center (Joint Research Centre European Commission), prepared a handbook (Handbook, 2008), which was the result of many years of research in this field (Nardo, Saisana, Saltelli, & Tarantola, 2005; Nicoletti, Scarpetta, & Boylaud, 2000; Saltelli, 2007; Tarantola, Saisana, & Saltelli, 2002). In this case, the linear convolution weights of the indicators are constructed using multivariate analysis.
Tools for multivariate analysis (factor analysis and principal component analysis) were used to combine indicators into a single index in the works (Hightower, 1978; McKenzie, 2005; Vyas & Kumaranayake, 2006; Somarriba & Pena, 2009; Ajvazjan, 2003). But the correlation matrices change over time, and the weights coefficients determined by the PCA and the structure of the main factors determined by factor analysis are different for different observations. Therefore, the results obtained for various observations using PCA and factor analysis are not comparable (Mazziotta & Pareto, 2016). It should be noted that this conclusion was made when constructing a composite index for one observation.
The author (Zhgun, 2017a; Zhgun, 2017b) proposed an algorithm that modifies the principal component analysis for a number of observations. The determined weights must reflect the
Findings
According to the proposed algorithm, complex indicators of changes in the quality of life of the subjects of the population of the Russian Federation for 2010-2017 were calculated. Variables were used from the study (Isakin, 2006). All variable values are taken from Rosstat open directories. Among the variables listed, variables 1, 2, 5, 7, 9, 10, 12, 21, 22, 23 are associated with the calculated characteristic by monotonously increasing dependence, when the optimal value of the variable is the maximum. For other indicators, except variable 27, the optimal index value is minimal. For variable 27 “net migration” the optimal value of xjopt is equal to the average value of the sample variable. The indicators used and the resulting vector of weights are presented in Table
Results are given in Table
The change in the quality of life of the population of some constituent entities of the Russian Federation is shown in Figure
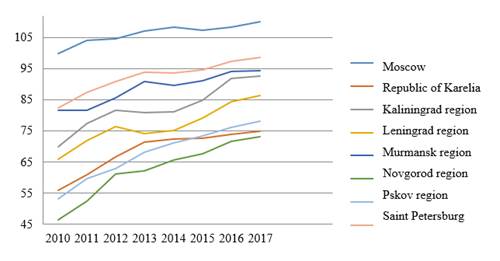
The highest composite indicators of quality of life for the entire observation period are demonstrated by Moscow, the Moscow region, St. Petersburg, oil producing regions (Khanty-Mansiysk and Yamalo-Nenets districts), as well as subjects of the North Caucasus Federal District. Of the 37 indicators in the calculation of complex indicators of quality of life, 20 reflect the physiological well-being of a person. It is this circumstance (as well as the peculiarities of national statistics) that explains the high indicators of the quality of life of the population of the republics of the North Caucasus Federal District. In North Ossetia, Ingushetia, Chechnya, Dagestan, the likelihood of getting sick, dying and experiencing criminal violence is much lower than in the whole country. For example, life expectancy in Ingushetia is the highest in Russia and exceeds this parameter for the Novgorod region by 10 years.
For each of the subjects of Russia, the quality of life is growing. The average value of this indicator for the country in 2010 was 60.9, and in 2017 – 81.3. The gap in the quality of life of the regions with leaders remains significant, however, this difference is noticeably narrowing and we can talk about a decrease in inequality within the country.
Conclusion
The priority for sustainable development in Russia today is to improve the quality of life of the population. The calculated index of the quality of life of the population of the constituent entities of the Russian Federation provides objective results of monitoring changes in the quality of life of the population of Russia. The definition of quality of life as a composite index uses many parameters that measure the solution of tasks set by the social Goals of sustainable development. Consequently, improving the quality of life and reducing inequality within the country testifies to the country's progress towards the Sustainable Development Goals.
References
- Ajvazjan, S. A. (2003). Empirical analysis of synthetic categories of life quality of the population. Economics and mathematical methods, 3(39), 19-53.
- Bandura, R. (2011). Composite indicators and rankings: Inventory 2011. Technical report, Office of Development Studies, United Nations Development Programme (UNDP). New York.
- Becker, W., Paruolo, P., Saisana, M., & Saltelli, A. (2017). Weightsand Importancein Composite Indicators: Mind theGap. Handbook of Uncertainty Quantification, Chapter: 4, 1-30. DOI:
- Becker, W., Saisana, M., Paruolo, P., & Vandecasteele, I. (2017). Weightsand Importancein Composite Indicators: Closingthe Gap. Ecological Indicators, 80, 12–22. DOI:
- Foa, R., & Tanner, J. C. (2012). Methodology of the Indices of Social Development (ISD Working Paper Series from International Institute ofSocial Studies of Erasmus University Rotterdam (ISS). The Hague, 4, 1-66.
- Hightower, W. L. (1978). Development of an index of health utilizing factor analysis. Medical Care, 16, 245-55.
- Isakin, M. A. (2006). Modification of a Method to k-Means with Unknown Number of Classes. Applied Econometrics, 4, 62-70.
- Mazziotta, M., & Pareto, A. (2016). On The Construction Of Composite Indices By Principal Components Analysis.Rivista Italiana di Economia Demografia e Statistica, Gennaio-Marzo, LXX(1),103-109.
- McKenzie, D. J. (2005). Measuring Inequality with Asset Indicators. Journal of Pop. Economics, 18(2), 229-260.
- Nardo, M., Saisana, M., Saltelli, A., & Tarantola, S. (2005). Tools for composite indicators building. Italy, Ispra: Joint Research Centre.
- Nardo, M., Saisana, M., Saltelli, A., Tarantola, S., Hoffmann, A., & Giovannini, E. (2008). Handbook on Constructing Composite Indicators: Methodology and User Guide. Paris: OECD Publication.
- Nicoletti, G., Scarpetta, S., & Boylaud, O. (2000). Summary indicators of product market regulation with an extension to employment protection legislation. Economics department working papers ECO/WKP, 18(99), 226.
- Saltelli, A. (2007). Composite indicators between analysis and advocacy Social Indicators Research, 81(1), 65-77.
- Sharpe, A. (2004). Literature Review of Frameworks for Macro-indicators.Canada, Ottawa: Centre for the Study of Living Standards.
- Somarriba, N., & Pena, B. (2009). Synthetic Indicators of Quality of Life in Europe. Social Indicators Research, 94(1), 115-133.
- Tarantola, S., Saisana, M., & Saltelli, A. (2002). A Internal Market Index 2002: Technical details of the methodology. Italy, Ispra (VA): JRC European Commission.
- Vyas, S., & Kumaranayake, L. (2006). Constructing socio-economic status indices: how to use principal components analysis. London: Oxford University Press.
- Zhgun, T. V. (2017a). An algorithm for constructing integral quality indicator of complex systems for a sequence of observations. Bul. of the South Ural St. University, 1(6), 5-25.
- Zhgun, T. V. (2017b). Building an integral measure of the quality of life of constituent entities of the Russian Federation using the principal component analysis. Economic and Social Changes: Facts, Trends, Forecast, 10(2), 214-235.
Copyright information

This work is licensed under a Creative Commons Attribution-NonCommercial-NoDerivatives 4.0 International License.
About this article
Publication Date
31 December 2019
Article Doi
eBook ISBN
978-1-80296-076-1
Publisher
Future Academy
Volume
77
Print ISBN (optional)
-
Edition Number
1st Edition
Pages
1-1056
Subjects
Industry, industrial studies, project management, sustainability, business, innovation
Cite this article as:
Zhgun*, T. V. (2019). Composite Indices Of Life Quality For Monitoring Of Sustainable Development Goals. In I. O. Petrovna (Ed.), Project Management in the Regions of Russia, vol 77. European Proceedings of Social and Behavioural Sciences (pp. 1038-1048). Future Academy. https://doi.org/10.15405/epsbs.2019.12.05.127