
Financial Analysis Of Corporate Reporting To Assess The Companys Potential

Abstract
The article is devoted to the financial analysis of the corporate reporting of the companies of the chemical industry of the Stavropol Territory. The authors have analyzed the role of companies in the regional economy and assessed their place in the Russian chemical industry. The analysis is based on the data of the unified interdepartmental information and statistics service, information of the Federal State Statistics Service, reports of joint stock companies. The authors identified two stages of the research, one of which was chosen for the method of comparative analysis and statistical methods, and the second - the author's methodological development based on a combination of financial analysis and matrix analysis. According to the results, the authors highlighted the peculiarities of development and the financial strategy of chemical industry companies in the region, where these companies provide more than half of the economic results of all business entities. The position of the regional leaders in the Russian market was assessed, and the analysis of changes in their financial position over the years was carried out. The approach proposed by the authors to the comparative analysis of chemical production companies is based on the principles of comparative analysis, the method of financial coefficients and matrix method. The coefficients selected by the authors, which formed the information basis for the analysis, are presented, in particular, in the official statistical information of Rosstat, allowing the analysis from the point of view of the company and of the regional economy.
Keywords: Chemical industryfinancial analysisregional economycorporate reporting
Introduction
Financial analysis is one of the key issues in assessing the performance of companies. In fact, it integrates the results of the facilities' operation in monetary terms and demonstrates the efficiency of management of all aspects of the company's operations (Malakhov & Pilnik, 2013, Berzon & Volodin, 2010).
Methodical toolkit of financial analysis is characterized by diversity and versatility. The multiplicity of methods used leads to the possibility of combining them for the most complete characterization of the object and object of research (Pochitaev & Akhmetov, 2016; Dorofeev, 2009; Vorobiev & Oliunin, 2011; Tatarov, 2004).
In our work, we propose to assess the financial condition of companies in the chemical industry of the Stavropol Territory on the basis of statistical methods and a combination of methods of financial ratios and matrix analysis.
Below is an example of the table and figure design. If you don't have pictures and tables, just delete these examples.
Problem Statement
Most of the methods of assessing the financial condition of companies are focused on the assessment of their performance against the standard criteria adopted in financial practice. Only ROAs, asset turnover rates and other individual performance criteria are assessed by financiers against average industry, regional and national levels (Titova, Pervuhin, & Baturin, 2017; Boyko, 2005).
Our analysis of early works (Berezhnaya, Berezhnaya, Solovyova, Karapetyan, & Berezhnoy, 2018) shows that the financial condition of Russian companies does not meet the established requirements and criteria. In such a situation, an objective assessment of the financial condition on the basis of financial stability, liquidity, etc., on the basis of criteria accepted in financial practice loses its meaning.
From our point of view, it seems more objective to assess the financial condition in comparison with the leading companies and with the average industry and regional values of the criteria. The combination of this approach with the traditional one will allow not only to directly assess the financial condition, but also to characterize the position of the company in the industry in comparison with the closest competitors, among peers and in the economy of the region.
Research Questions
The study focuses on financial analysis and matrix methods, as well as on the problems of assessing the position and role of chemical companies in the regional and national economies.
Purpose of the Study
The purpose of the work is to develop methodological tools that allow to evaluate the activity of companies not only from the point of view of the objects of evaluation, but also from the point of view of their role in the economy of the region by means of a combination of methods of financial analysis and matrix methods.
Research Methods
Description of the methods used to perform the study.
The study is to be conducted in two stages.
The first step is to identify the industry leaders in the region (Chen & Chen, 2002) using a comparative analysis method, including comparison indicators and structure.
In the second stage, the study is expected to continue in two directions:
- assessment of the position of regional leaders of chemical production in the industry, in the regional industrial complex;
-assessment of the position of the studied objects in comparison with their analogues.
At the second stage, the comparative method continues to be used, which includes comparison of the level of financial coefficients and matrix analysis using the matrices proposed by the authors.
The source information is public data:
-financial status of organizations by region and type of activity (EMISS, 2019);
-on the activities of individual companies (Interfax, 2019).
Findings
The first stage includes the identification of industry leaders in the region. The object of research are the companies of the chemical complex of the Stavropol Territory. Analysis of statistics shows that the financial results of the chemical industry of the Stavropol Territory are formed to a greater extent due to the activities of the three industry leaders in the region: JSC Arnest, Nevinnomysskiy JSC Azot and Stavrolen LLC. Over the past three years, these three companies have been consistently ranked among the top twenty companies in all the ratings built in terms of revenue, asset value and pre-tax profit in the aggregate of organizations of the Stavropol Territory (all types of activities) and the chemical industry (in Russia and in the Stavropol Territory).
During the analyzed period, three companies retain more than 90% of the revenue of the chemical complex of the region, but there is a steady decline in their share in the value of property, which is explained by the development and growth of small and medium-sized businesses in the industry. Nevinnomysskiy JSC Azot, the largest city-forming company in the region (Zamyatina & Pilasov, 2016), accounts for the bulk of the region's revenues in the chemical industry. The second place belongs to OOO Stavrolen, one of the industry leaders, a subsidiary of PJSC Lukoil. JSC Arnest, which has a significant number of competitors in its field of activity, acts as a lagging company.
The analysis carried out on the basis of data from the chemical industry sub-sectors in the Stavropol Territory shows that three companies account for almost 100% of the total financial performance of the chemical industry: "Manufacture of Perfumery and Cosmetics" - JSC Arnest, "Manufacture of Plastics and Synthetic Resins in Primary Forms" - Stavrolen LLC, "Manufacture of Fertilizers and Nitrogen Compounds" - JSC Nevinnomysskiy Nitrogen.
At the national level, at the beginning of 2018, the analyzed companies ranked the following among the companies of the respective sub-sectors in terms of indicators:
1) JSC Arnest by the volume of revenue - 4th place, by the value of property - 3rd place;
2) Stavrolen LLC is ranked third in terms of revenue and fifth in terms of property value;
3) JSC Nevinnomysskiy Nitrogen by revenue volume - 8th place, by property value - 13th place.
Thus, the leading companies almost completely form the financial indicators of the chemical complex at the regional level and are among the top ten leaders in their respective fields of activity.
The second stage of the study involves an assessment:
- positions of regional leaders of chemical production in the industry, in the regional industrial complex;
- the position of regional leaders in comparison with similar facilities.
If the volumetric indicators clearly characterize the leading positions of the surveyed companies in the region, the analysis of relative characteristics does not allow to draw such an unambiguous conclusion.
The main criteria for comparison are the financial ratios available in Rosstat's public data: the autonomy ratio, the current liquidity ratio, the equity ratio and the return on assets.
The analysis was carried out in comparison with the average sectoral and regional indicators in the dynamics for 13 years.
The following conclusions can be drawn from the analysis:
-The financial performance of the chemical industry at the regional level is based on the activities of three regional leading companies: Arnest, Stavrolen and Nevinnomysskiy Nitrogen;
-the level of financial indicators in the region during the analysis period 2006 - 2018 and in terms of activities is higher than at the national level;
-the response of a number of financial indicators of the industry to the 2014 crisis and sanctions is determined by the significant role of chemical companies in the foreign economic activity of the region: in the period from 2014 to 2016, almost 60% of the export of the Stavropol Territory was accounted for by chemical products, the production of the chemical industry is focused on foreign trade;
-the best values of financial indicators are typical for JSC Arnest and JSC Nevinnomysskiy Nitrogen.
Thus, we have compared the activities of the chemical industry companies of the Stavropol Territory with the average Russian level.
The next direction of the research is the assessment of the activity of chemical companies of the region with the activity of the enterprises of the same sub-sectors closest in terms of volume indicators. In our survey, we chose the main criterion for the level of companies' revenues for 2017, which is related to the stable ratings of companies in the chemical industry in terms of this indicator and the value of assets, as well as the determining role of sales results in determining market share.
For comparative analysis of chemical production companies, we offer the following approach based on a combination of the following:
-comparative analysis principles - comparison of companies with the same type of activity and production volumes by available data on the companies' activity, for the evaluation of which there are corresponding average industry indicators for a long period of time in the open data;
-a method of financial ratios that comprehensively and concisely characterizes the financial condition of companies; indicators that can be compared with the industry average are selected for the study;
-matrix method, which makes it possible to combine diverse financial coefficients without leveling their economic nature into an integral index.
For the analysis we will use those financial coefficients, the data on which is regularly published by Rosstat in the context of regions and activities:
-the autonomy and current liquidity ratios to characterize the structure of assets and sources of their formation;
-return on assets and profitability of goods and services, characterizing efficiency in terms of resource and cost concepts.
For each pair of indicators, a matrix of the following kind is built (fig.1, fig.2).
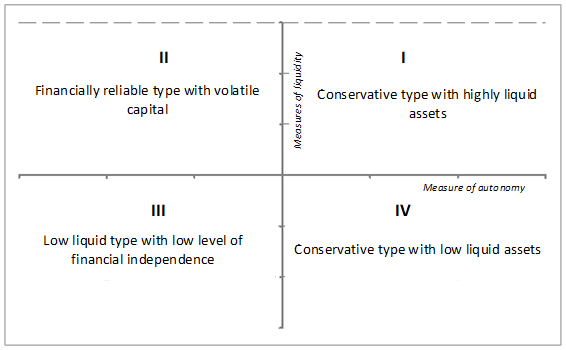
Characteristics of the company's property, sources of its formation and ratio of structural parts is given through the autonomy coefficient and current liquidity ratio. Coordinate axes intersect at points corresponding to the average industry coefficient values. The position of the company in each of the quadrants is interpreted as follows:
-1st quadrant: a conservative type with a highly liquid balance sheet (++), includes companies that have a higher autonomy coefficient than the industry average and a relatively more conservative, heavy and inefficient ROE structure of funding sources; and a higher coverage ratio at the industry average, which indicates a relatively higher solvency; all in all, it indicates a high quality of assets and liabilities from a financial and stable cash flow point of view;
-2d quadrant: the type of solvent companies with mobile capital (++++); it is characterized by a relatively higher solvency, but lower than the average level of financial independence of the industry; such companies are characterized by a high value of the leverage effect, while the coverage of short-term liabilities by mobile assets is quite high and levels the impact of risks associated with low value of the autonomy coefficient;
-3d quadrant: a type of low-liquid companies with a low level of financial independence (-); the worst situation in which the company is characterized by a illiquid asset structure and the company is more dependent on borrowed funds compared to the average industry level;
-4th quadrant: a conservative type with a low-liquid balance sheet characterized by a high degree of financial reliability and independence and an inability to provide a sufficient level of solvency due to the relatively heavier asset structure.
The proposed typology should be supplemented with the characteristics of stability and liquidity of the companies of the studied type of activity in the average country:
-if in the Equity ratio ≥ 50%, Cash ratio ≥ 200% - the industry is extremely stable and highly liquid, characterized by a conservative financial policy;
-if in the Equity ratio ≥ 50%, Cash ratio < 200% - the industry is financially stable, but has a "heavy" property structure;
-if the Equity ratio is < 50%, Cash ratio ≥ 200% - the industry actively uses borrowed capital to finance the activities of companies; pursues a cautious policy in the field of short-term settlements;
-if the Equity ratio is < 50%, Cash ratio < 200 % - the companies of the industry are characterized by low financial stability, high level of financial leverage, and have a careless policy in the field of short-term settlements.
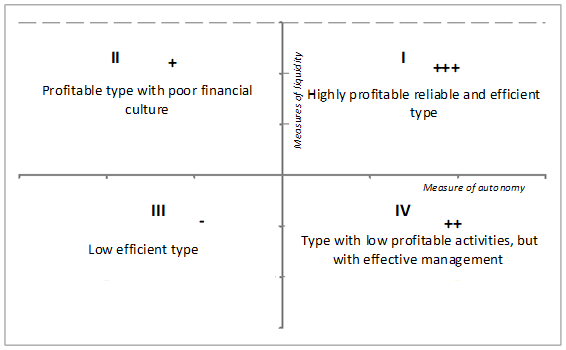
Efficiency of companies' activity is characterized by return on assets and profitability of sold goods, products, works and services. Similar to the previous matrix, the coordinate axes intersect at the points corresponding to the industry average, and the position of companies in the quadrants is interpreted as follows:
-1st quadrant: a highly profitable and efficient type, characterized by high efficiency of the property complex and cost efficiency in the main type of activity; these companies are in a better position in the industry than their counterparts;
-2d quadrant: highly profitable type with low efficiency of resource management; companies have highly profitable core business, but due to a number of factors the company's work has a yield below market;
-3d quadrant: low efficiency type; even if positive profitability values are maintained, companies are significantly behind most peers and lose competitiveness;
-4th quadrant: a type of company with low efficiency of its core business and efficient financial and property management, which makes the efficiency of asset use higher than the market one, and the profitability of the goods sold lags behind the average sectorial one; perhaps, modernization of production is expedient for such a company.
An integral assessment is possible based on the following Table
Within the scope of the article below, we will consider in detail the position of JSC Arnest:
(a) in dynamics;
b) in relation to similar companies.
A similar analysis is conducted for two other companies.
The position of JSC Arnest in the dynamics is shown in Table
The industry is witnessing an increase in the average value of the autonomy coefficient: from 36.89% in 2008 to 70% in 2018. At the same time, the dynamics of the current liquidity ratio shows a decline in 2009 and 2014 and an increase to 186% by 2018. As of the end of the analysis period, the industry is financially stable, but has a "heavy" property structure. This conclusion confirms the low (less than 10%) value of the own working capital ratio.
The financial position of JSC Arnest is characterized by a relatively low level of profitability and high financial stability and liquidity (exception - 2014) - the company's financial policy allows to maintain financial stability and high return on assets, however, JSC Arnest lags behind the average industry level of profitability of products characterizing its core business.
Table
-JSC Faberlik
-NTS Gradient LLC.
-JSC Nevskaya Cosmetics
-JSC Arnest (2018)
-Unicosmetic LLC.
-First Solution LLC.
-JSC Sibiar
The companies-analogues closest to JSC Arnest are notable for a rather high level of current liquidity, however, the level of equity capital fluctuates significantly.
In terms of return on assets and profitability of sold goods, products, works and services, the position of JSC Arnest is one of the worst. It is obvious that JSC Arnest is in an intermediate position relative to its nearest counterparts.
Conclusion
The conducted research allowed to develop an approach to assessment of chemical industry companies' position in the industry and in the region on the basis of financial coefficients. The proposed approach was tested on the basis of the corporate reporting data of the chemical industry companies of the Stavropol Region.
References
- Berezhnaya, O. V. Berezhnaya, E. V., Solovyova, N. V., Karapetyan, E. A., & Berezhnoy, V. I. (2018). Dynamics, peculiarities and financial factors for the industrial development of the South of Russia. European Research Studies Journal, 21(4), 533–544.
- Berzon, N. I., & Volodin, S. N. (2010). Valuation of financial assets on the basis of the "risk-return" criterion, taking into account the duration of the investment. Economic Journal of the Higher School of Economics, 14(3), 311–325.
- Boyko, I. P. (2005). Processes of concentration of production in the industry of the Russian Federation: assessment of level and dynamics. Bulletin of St. Petersburg University. Economics, 4, 95–108.
- Chen, H. E., & Chen, G. (2002). An Evaluating Model and Case Study on the competence of Regional Industry. China Soft Science, 1, 99–104.
- Dorofeev, M. L. (2009). Peculiarities of applying the matrix of financial strategies of Franchon and Romanet in the strategic financial analysis of the company. Finance and Credit, 23, 51–56.
- EMISS (2019). Integrated Interagency Information and Statistical Service. Retrieved from: https://fedstat.ru
- Interfax (2019). Corporate Information Disclosure. Retrieved from: http://e-disclosure.ru/
- Malakhov, D. I., & Pilnik, N. P. (2013), Methods of performance indicator estimation in the models of stochastic production border. Economic Journal of the Higher School of Economics, 17(4), 660–686.
- Pochitaev, A. Y., & Akhmetov, R. R. (2016). Comparative analysis of matrix models of financial strategies. Retrieved from: https://cyberleninka.ru/article/n/sravnitelnyy-analiz-matrichnyh-modeley-finansovyh-strategiy
- Tatarov, S. V. (2004). Financial stability of the firm as the basis of its development strategy. Retrieved from: https://cyberleninka.ru/article/n/finansovaya-ustoychivost-firmy-kak-osnova-strategii-ee-razvitiy
- Titova, N. Y., Pervuhin, M. A., & Baturin, G. G. (2017). Identification of Regional Clusters in the Russian Far East. European Research Studies, 20(4A), 339–359.
- Vorobiev, A. V., & Oliunin, V. I. (2011). Analysis of modern foreign matrix models of choice of financial strategy. Retrieved from: http://www.uecs.ru/uecs-29-292011/item/486-2011-06-03-07-23-06
- Zamyatina, N., & Pilasov, A. (2016). Mono-profile cities of Russia: blockages and drivers of innovative search. Forsyth, 10(3), 53–64.
Copyright information

This work is licensed under a Creative Commons Attribution-NonCommercial-NoDerivatives 4.0 International License.
About this article
Publication Date
28 December 2019
Article Doi
eBook ISBN
978-1-80296-075-4
Publisher
Future Academy
Volume
76
Print ISBN (optional)
-
Edition Number
1st Edition
Pages
1-3763
Subjects
Sociolinguistics, linguistics, semantics, discourse analysis, science, technology, society
Cite this article as:
Moiseev, V., Kozlov, P., Berezhnaya, E., Glaz, V., & Berezhnaya*, O. (2019). Financial Analysis Of Corporate Reporting To Assess The Companys Potential. In D. Karim-Sultanovich Bataev, S. Aidievich Gapurov, A. Dogievich Osmaev, V. Khumaidovich Akaev, L. Musaevna Idigova, M. Rukmanovich Ovhadov, A. Ruslanovich Salgiriev, & M. Muslamovna Betilmerzaeva (Eds.), Social and Cultural Transformations in the Context of Modern Globalism, vol 76. European Proceedings of Social and Behavioural Sciences (pp. 362-371). Future Academy. https://doi.org/10.15405/epsbs.2019.12.04.50