
The Strategic View of Port Investment Decisions

Abstract
Maritime transport is most preferred transportation mode in global trade and ports are strategy model points along global supply chains due to their integral part role in maritime transportation. Efficiency and effectiveness in the port industry can create a competitive advantage to port operators and supply chains they are in part as well. In order to ensure the sustainability of ports, environmental, economic and social components of port investments must be taken into account. Thus, investment decisions have strategic importance to gain and sustain a competitive advantage, which requires an analysis of port performance indicators. Investment decisions also necessary to respond to the requirements of the industry at a level above the average, while the wrong prediction can be caused idle capacity, loosed capital and missed opportunity costs. This study aimed to create an effective decision-making process. According to this aim, SWOT, AHP and Stepwise Regression analyses are combined. Firstly, investment decision criteria were determined by SWOT analysis, and AHP technique is used for weighting the criteria. Findings of these two steps used as the inputs of investment decision. Finally, a statistical model developed to help decision makers to decide which type of investment must be made by stepwise regression analysis.
Keywords: Container portinvestment decisionquantitative decision makingsustainabilityquality management
Introduction
In today’s global business environment transportation is a must for the movement of goods. Transportation management provides physical movement of goods from production units to the customers, adds time and place value to goods (Acar, 2010). Particularly, due to the availability of high volume cargo transportation and less expensive transport providing, maritime transportation is the most preferred mode in global trade. According to UNCTAD, 10.7 billion tons of global merchandise trade was transported by seaborne trade in 2017 (UNCTAD, 2018). As Robinson (2002) claims, due to the services they provide, ports are an integral part of maritime transportation and one of the important component of international trade and supply chain. Today's global business environment, ports and maritime transport play an important role (Mangan & Lalwani, 2008), for that reason port’s efficiency should provide significant value to country’s international competition (Cullinane, Song, & Gray, 2002), as well. The competitiveness of the container port industry (like other industries) is much higher nowadays (Cullinane & Song, 2006). So for gaining competitive advantage, it is needed to improve the port’s performance and efficiency (Lee, Kuo, & Chou, 2005). This will also provide a positive impact on domestic port industry’s competitiveness and the country’s economy (Simkins & Stewart, 2015; Song & Mi, 2016), as well. The failures occurred in the operations at ports can be caused too much negative effect like delays in product delivery, damages in products, supply chain performance decreases, and customer dissatisfaction. For these reasons, to gain and sustain competitive advantage it requires well analysis of port performance indicators, and it is also necessary to respond to the requirements of the industry at a level above the average. According to literature main key performance indicators in container ports are: (1) the distribution of handled container types, (2) delays in operations, (3) crane efficiency, (4) vessel sizes that berthed to ports, (5) container amounts that loaded and unloaded per ships (Tongzon, 1995). Moreover, terminal area, quay length and depth, amount of equipment, port’s hinterland, and operation costs (Tongzon & Heng, 2005; Hoshino, 2010; Chu, Fwa, & Nishijima, 2013; Wu, Li, Shi, & Yang, 2016) have the positive effect on ports efficiency to gain competitive advantage. Due to the performance measurement defines organizations' (whether they performed in production or service industry) current state and also it's future, this evaluation plays an essential role (Cullinane & Wang, 2007). Testing the port’s infrastructure and equipment usage efficiently may help to evaluate capacity adequacy of port’s forecasted throughput. If forecasted throughput is bigger than port capacity, additional investment decision takes the place as a major managerial activity. Ports and their infrastructure are important parts for the container transport industry and the huge amount of investments made in ports support the growth of that industry (Cullinane, Fei, & Cullinane, 2004). Investment decision which made with the wrong prediction can be caused idle capacity, loosed capital and missed opportunity costs. These decisions have strategic importance because of high costs, inflexibility, and also, belated investment decisions can cause customer losses, equipment attritions, handling beyond to port capacity, and insufficient to meet the projected growth. It is not appropriate to examine the port investments from an economic perspective only in order to ensure sustainability. As mentioned in the literature, environmental, social and economic performance should be considered together for sustainable supply chains (Carter & Rogers, 2008; Elkington, 1998). Generally, investments in ports are mainly done based on intuitions, but due to the high cost involved, rational calculations are also needed (Alattar, Karkare, & Rajhans, 2006). In previous studies focused on port investment, while rational calculations have been done, there is not any study seen that rational calculations with come together with experts’ opinions on investment. In this aspect, this study has a novelty according to the industry. In this context, this study is aimed to create an effective decision-making process for port investment to gain a competitive advantage in the port industry. In order reach this aim, SWOT, AHP and Stepwise Regression analysis combined to create an effective decision-making process which can take advantages of each analysis tool. First of all, investment decision criteria were determined by SWOT (“strength”, “weakness”, “opportunities”, “threats”) analysis. Then, the AHP (“Analytic Hierarchy Process”) technique is used for weighting criteria that defined in SWOT analysis and findings of these two consecutive steps inputs of decision invest or not. Finally, a statistical model developed for which type of investment must be made according to the chosen alternative by using stepwise regression analysis. In this developed investment decision-making process, rational calculations come together with experts’ opinions, and statistical model helps to which type of investment must be made according to investment decision for port investment to gain the competitive advantage in regard of port industry and country’s economy, as well.
Methodology
In this study, SWOT, AHP and Stepwise Regression analyses used in an integrated process to create effective decision making in order to take advantages of each analysis tool. Initially, SWOT analysis is used for decision making because of this analysis can compare the environment (internal-external) in a systematic approach (Wheelan & Hunger, 1995; Hill & Westbrook, 1997; Kangas, Pesonen, Kurttila, & Kajanus, 2001). After that, the AHP technique is used for weighting criteria defined in SWOT analysis. AHP is a technique that developed for multi-criteria decision-making problems (Saaty, 1980), and it provides opportunities to use in many areas (Vaidya & Kumar, 2006). This technique determines relative priorities by comparing multilevel hierarchical structures of objective, criteria and alternatives (Saaty & Vargas, 1996; Görener, Toker, & Uluçay, 2012). AHP can be used for SWOT analysis to execute more analytically by analyzing SWOT groups and factors through the eigen value technique (Kangas et al., 2001). Pairwise comparisons are used to calculate the means of importance by Saaty's 1- 9 scale (Table
After that, consistency indicator (CI) determined according to the random consistency index (Table
Finally, a statistical model developed according to the chosen alternative by using stepwise regression analysis which is used for explaining the relationship with a statistical model between independent and dependent variables (Hair, Black, Babin, Anderson, & Tatham, 2006), and especially if a large number of variables are involved, this regression analysis helps to select related variables into a model (Wang & Jain, 2003).
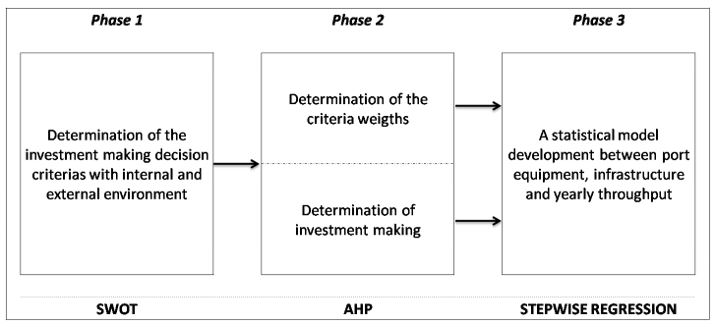
The proposed methodology consists of three different steps and each step becomes the input of the next step. The step-wise methodology of the study is expressed in Figure
Case Study
Phase 1: SWOT Analysis
In this paper, SWOT analysis is performed by two academicians who have related academic studies and experiences in maritime and transport industry. During the SWOT process sector analysis with expert meeting discussions is made, and the literature is evaluated by using relevant key terms, and according to these studies, observations are inserted into the SWOT analysis. Sustainability criteria, which is necessary for investment decisions, also added to SWOT analysis. Sustainability has three main components: economic component is one of the focused issue used for managers and stakeholders, and international institutions and government also promoted environmental component, but social aspects are ignored in SWOT analysis due to the problems in measurement. Most important internal and external factors are identified and classified by the experts are written in Table
Phase 2: AHP Analysis
For combining SWOT with AHP technique, a questionnaire model İSdeveloped with SWOT factors identified in Table
The respondent academicians have related working experiences, academic studies and also they provide consultancy services to related companies and made strategic reports with Turkey Ministry of Transport, Maritime Affairs and Communication.
Group priority, factor priority within the internal and external group and overall priority of factor are calculated with obtained data. The results can be seen in Table
In internal factors, 0.47 score is the strength group’ priority level and 0.53 for weaknesses (Table
According to the consistency analysis of pairwise comparisons, CR is calculated as 4.7 % for internal factors, and 2.7 % for external factors. Because CR is smaller than 10%, it is considered that pairwise comparisons have consistency, and alternative (invest or not invest)/ criteria matrixes calculated. Relative importance values calculated, and investment making decision is given for both internal (with relative importance value of 48%) and external factors (with relative importance value of 70%).
Phase 3: Stepwise Regression Analysis
Because both internal and external factors calculated that there should be an investment decision, it should be calculated what kind of investment must be done. According to this aim, a statistical model developed by using stepwise regression analysis with data of container throughputs, equipment, infrastructure, and quality management systems information of container terminals in Turkey, which are a member of Port Operators Association of Turkey (TURKLİM) and container handling minimum ten years. Data is obtained through port’s web pages, meetings with executives, and TÜRKLİM 2018 throughput data set (TÜRKLİM, 2018), classifying of these obtained data, Port Throughput (TEU) determined dependent variable, and quay length, draft, total terminal area, annual terminal capacity, SSG, MHC, RTG units, determined independent variables. Table
Stepwise regression analysis is done with 95% reliability level, and significant statistical model formulized below.
Y1= -11469.44+ 0.76 X4 - 46903.54 X6 + 292368.46 X8 - 275901.88 X9 (1)
This model is tested with port’s 2018 actual throughputs data, and it is performed a 13.34% error rate. Table
Conclusion and Discussions
Ports have strategic importance because it is an integral part of today’s most preferred transportation mode, namely maritime transport, in global trade due to the services that they provide. Due to the positive economic effect on the country’s competitiveness and economies, it is a must for countries to improve ports’ performance and efficiency.
Performance measurement is an important tool for evaluating organizations whether they performed in production or service industry. Testing the performance of ports in regard to infrastructure efficiency and equipment usage can be helped to evaluate capacity adequacy of port’s forecasted throughput. If forecasted throughput is bigger than port capacity, additional investment decision takes place as a major managerial activity. Investment decision which made with the wrong prediction can be caused idle capacity, loosed capital and missed opportunity costs. These decisions have strategic importance because of high costs, inflexibility, and also, belated investment decisions can cause customer losses, equipment attritions, handling beyond to port capacity, and insufficient to meet the projected growth.
In addition, to improve the right competitive strategies, rational calculations must be done as well as intuitional forecasts. Thus, in this study, it is aimed to create an effective decision-making process for port investment to gain a competitive advantage in the port industry. In order reach this aim, SWOT, AHP and Stepwise Regression analysis combined to create an effective decision-making process.
Firstly, SWOT analysis is performed, and the AHP technique is used for weighting criteria defined in SWOT. According to results, most weighted internal SWOT factors by experts’ opinions are “(S2) competitive port tariffs”, and “(W7) high investment costs”. Whereas ports need high investment costs, unfortunately, they have to apply competitive port tariffs, which cause the late internal rate of return (Meersman, 2005).
As looking at external factors, one of threat factor “(T3) increase in port competition” has most priority overall, after that, opportunity factor of “(O2) EU neighbor policy aiming to reach Asian markets with improved logistics infrastructure” following. Port investments increased in Turkey, also in World, as it can be seen according to increment in ports investments, competition is increasing too.
Investment making decision is given for both internal (with relative importance value of 48%) and external factors (with relative importance value of 70%), and due to the stepwise regression analysis with 95% reliability level, independent variables of Annual Terminal Capacity (TEU), MHC units, having quality management system certification, and having green port certification determined that effect dependent variable of Port Throughput.
The reason of MHC units has an effect on “port throughput” is lines pressure on ports to have fast movement in loading and unloading operation on the vessel, and also because “annual terminal capacity” determines ports’ storage adequacy, it has an effect on “port throughput”. One of the strength factors of SWOT analyses is “Turkey’s Green Port/ Ecological Port project”, and this factor is also related to the environmental component of sustainability. International institutions and government promoted the environmental component of sustainability, as is can be seen in stepwise analyses investments made in quality management systems (having quality management system certification, and having green port certification) have an effect on port throughput.
In this developed investment decision-making process, rational calculations come together with experts’ opinions, and statistical model helps to which type of investment must be made according to investment decision for port investment to gain the competitive advantage in regard of port industry and country’s economy, as well.
Restrictions of this study are; although the essence of SWOT and AHP, a few experts were reached, and this study has regional results, it is not covering the global market. Although it is aimed a rational decision making, in this study judgmental decisions are included in processes. For future studies, a new model will be developed with adding companies fundamental economic indicators.
References
- Acar, A. Z. (2010). Depolama ve Depo Yönetimi [Warehousing and Warehouse Management]. Ankara: Nobel Yayın Dağıtım.
- Alattar, M., Karkare, B., & Rajhans, N. (2006). Simulation of Container Queues for Port Investment Decisions. The Sixth International Symposium on Operations Research and Its Applications, 155-167. Xinjiang.
- Carter, C. R., & Rogers, D. S. (2008). A framework of sustainable supply chain management: moving toward new theory. International journal of physical distribution & logistics management, 38(5), 360-387.
- Chu, L., Fwa, T. F., & Nishijima, H. (2013). Container Port Operational Performance Assessment. Journal of the Eastern Asia Society for Transportation Studies, 10, 2197-2209.
- Cullinane, K., & Song, D.-W. (2006). Estimating The Relative Efficiency of European Container Ports: A Stochastic Frontier Analysis. Port Economics Research in Transportation Economics, 16, 85-115/
- Cullinane, K., & Wang, T.-F. (2007). Data Envelopment Analysis (DEA) and Improving Container Port Efficiency. Research in Transportation Economics, 17, 517-566.
- Cullinane, K., Fei, W. T., & Cullinane, S. (2004). Container Terminal Development in Mainland China and Its Impact on the Competitiveness of the Port of Hong Kong. Transport Reviews, 24(1), 33-56.
- Cullinane, K., Song, D.-W., & Gray, R. (2002). A stochastic frontier model of the efficiency of major container terminals in Asia: assessing the influence of administrative and ownership structures. Transportation Research, Part A, 36, 743–762.
- Elkington, J. (1998). Partnerships from cannibals with forks: The triple bottom line of 21st‐century business. Environmental Quality Management, 8(1), 37-51.
- Görener, A., Toker, K., & Uluçay, K. (2012). Applıcation of combined SWOT and AHP: A case of study for a manufacturıng firm . 8th International Strategic Management Conference . Barcelona, Spain.
- Hair, J., Black, W. C., Babin, B. J., Anderson, R. E., & Tatham, R. (2006). Multivariate data analysis. Vol. 6. Upper Saddle River : NJ: Pearson Prentice Hall.
- Hill, T., & Westbrook, R. (1997). Swot analysis: It’s time for a product recall. Long Range Planning, 30, 46-52.
- Hoshino, H. (2010). Competition and Collaboration among Container Ports. The Asian Journal of Shipping and Logistics, 26(1), 31-48.
- Kangas, J., Pesonen, M., Kurttila, M., & Kajanus, M. (2001). A’WOT: Integrating the AHP with SWOT Analysis. 6th ISAHP 2001 Proceedings. Berne, Switzerland.
- Lee, H.-S., Kuo, S.-G., & Chou, M.-T. (2005). Evaluating Port Efficiency In Asia Pacific Region With Recursive Data Envelopment Analysis. Journal of the Eastern Asia Society for Transportation Studies, 544-559.
- Mangan, J., & Lalwani, C. (2008). Port-centric logistics. The International Journal of Logistics Management, 19(1), 29-41.
- Meersman, H. M. (2005). Port Investments In An Uncertain Environment. Global Competition in Transportation Markets: Analysis and Policy Making Research in Transportation Economics, 13, 279-298.
- Robinson, R. (2002). Ports as elements in value-driven chain systems: the new paradigm. Maritime Policy and Management, 29(3), 241-255.
- Saaty, L. (1980). The Anlaytic Hierarchy Process. Newyork: McGraw-Hill.
- Saaty, L., & Vargas, L. (1996). Decision Making with the Analytic Network Process. Pittsburgh : Springer.
- Saaty, L. (2000). The analytic hierarchy and analytic network process. MCDM 15th International Conference, Ankara, Turkey, 1-5.
- Simkins, S. Z., & Stewart, R. D. (2015). Factoring a real value of cargo in port investment and funding decisions. Maritime Policy & Management, 42(7), 712-728.
- Song, L., & Mi, J. (2016). Port infrastructure and regional economic growth in China: a Granger causality analysis. Maritime Policy & Management, 43(4), 456-468.
- Tongzon, J. L. (1995). Determinants of port performance and efficiency. Transpn. Rcs, 29A(3), 245-252.
- Tongzon, J., & Heng, W. (2005). Port privatization, efficiency and competitiveness: Some empirical evidence from container ports (terminals). Transportation Research Part A, 39, 405-424.
- TÜRKLİM. (2018). TÜRKLİM 2018 Yük Bilgileri [TÜRKLİM 2018 Throughputs]. TÜRKLİM.
- UNCTAD. (2018). Review of Maritime Transport 2017. UNITED NATIONS CONFERENCE ON TRADE AND DEVELOPMENT.
- Vaidya, O., & Kumar, S. (2006). Analytic hierarchy process: An overview of applications. European Journal of Operational Research, 169, 1-29.
- Wang, G. C., & Jain, C. L. (2003). G. C. Wang, C. L. Jain, Regression Analysis: Modeling & Forecasting. Graceway Publishing Company.
- Wheelan, T. L., & Hunger, J.D. (1995). Strategic Management and Business Policy, 5th ed.. Addison-Wesley Longman, Reading, MA.
- Wu, S., Li, K. X., Shi, W., & Yang, Z. (2016). Influence of local government on port investment: implications of China’s decentralized port governance system. Maritime Policy & Management, 43(7), 777-797.
- Yüksel, İ., & Dagdeviren, M. (2007). Using the analytic network process (ANP) in a SWOT analysis–A case study for a textile firm. Information sciences, 177(16), 3364-3382.
Copyright information

This work is licensed under a Creative Commons Attribution-NonCommercial-NoDerivatives 4.0 International License.
About this article
Publication Date
30 October 2019
Article Doi
eBook ISBN
978-1-80296-070-9
Publisher
Future Academy
Volume
71
Print ISBN (optional)
-
Edition Number
1st Edition
Pages
1-460
Subjects
Business, innovation, Strategic management, Leadership, Technology, Sustainability
Cite this article as:
Gürol*, P., & Acar, A. Z. (2019). The Strategic View of Port Investment Decisions. In M. Özşahin (Ed.), Strategic Management in an International Environment: The New Challenges for International Business and Logistics in the Age of Industry 4.0, vol 71. European Proceedings of Social and Behavioural Sciences (pp. 230-240). Future Academy. https://doi.org/10.15405/epsbs.2019.10.02.21