
The Effect of Innovation Barriers on Construction Firms’ Innovation Orientation


Abstract
This paper aims to investigate the effect innovation barriers has on the innovation orientation in the Syrian construction firms in the period of the war years. The effect of 8 different barriers were investigated: Technical, Financial, Process, Psychological, Management, Culture, Environmental and Governmental barriers. Questionnaire data were collected from a sample of 306 architects and Civil engineers from large, small and medium sized construction firms, which operated in Syria within the past 6 years of the war. The results from total sample community confirmed only 9 hypotheses out of 16, confirming the full significant effect of the Technical, Financial, Process and Psychological Barriers had on both innovation orientations- (Creation & Adoption), Whereas, environmental Barrier significant effect only on the Creation innovation orientation. This paper illustrates the assessment of the measurement and structural model using Partial Least Squares–Structural Equation Modelling PLS-SEM (Warp PLS 6.0 software). The study contributes theoretically and methodologically to the innovation barriers literature in specific and innovation literature in general. Moreover, the result can assist the local firms and authorities in understanding the barriers structure and guide them for future developments and improvements that are disparately needed for the era of the rebuilding the country after the war.
Keywords: Innovation BarriersInnovation Orientation (Creation/ Adoption)PLS-SEMWarp PLS
Introduction
Whenever Syria is mentioned, the first issue that will come up is the destructive war taking place now in it, according to Black (2016) in his article in the Guardians 470,000 causalities till 2016, 45% of the population is displaced, life expectancy has dropped from 70 in 2010 to 55.4 in 2015 and overall economic losses are estimated at $255bn (£175bn) and according to (UNHCR, 2017) till the 6th of July 2017 a number of 5,136,969 refugee is formally registered under the various programs of United Nations High Commissioner for Refugees. Tremendous additional destruction is to be scored to the infrastructure in almost all the cities in this country especially the cities that can be labelled as war zone, where there is scarcity on exact statistics about current status of the damage taken by the construction infrastructure in all the cities due to the continuity of the war.
To support the construction sector in Syria innovation must be implemented. Slaughter (1998) defined innovation as any change which might be considered as a something new to the firm, and this explanation was widely accepted in the studies on construction industry such as (Blayse & Manley, 2004), and this definition will be used in this research as well. In construction industry, a vast collection of innovation implementation possibilities is available, from the products and materials, ending with service and deliverables passing by process and even organizational management and behavior.
Literature Review
Innovation orientation as a concept is the state of the choice that occurs in firms, according to Kong-Seng and Yusof (2011) the firms would tend to be either creation or adoption according to level and availability of the innovative tools used (AbuJarad & Yusof, 2010; Kamal, Yusof, & Iranmanesh, 2016; Seng, Yusof, & Abidin, 2011). However, most scholars defined innovation as being adopted and created synonymously; leading towards failure in many innovation comparison efforts (Winch, 2003; Yusof, Mustafa Kamal, Kong-Seng, & Iranmanesh, 2014).
Innovation creation is known as inventing a new product or service not known by competitors before. However, Innovation Adoption is considering ideas already invented by competitors (Naranjo-Valencia, Jiménez-Jiménez, & Sanz-Valle, 2011). The main difference between the innovation creation and adoption is that adoption would assimilate the service, product, or technology in the adopting firm, whereas the innovation creation would propose a new outcome from the creative firm (Damanpour & Gopalakrishnan, 1998; Damanpour & Wischnevsky, 2006). So the orientation of the firm’s innovation will be affected by the level of innovation tools used and the barriers to implement these tools will affect the choice of the firm, whether to be creative or just to be content with adaptation from the competitors.
Digital innovations which considered as a powerful driver of the construction companies is defined as the new combinations of digital and physical components to produce novel products or services. In other words to embed digital computer and communication technology into a traditionally non-digital product or service in the area of information science (Svensson, 2012; Yoo, Lyytinen, Boland, & Berente, 2010), basically used in designing phase in the construction industry (Boland Jr, Lyytinen, &Yoo, 2007; Yoo, Henfridsson, &Lyytinen, 2010). Investigating the digital innovation barriers, which are all factors that obstacle the implementation of the innovation in general, consequently it will directly affect the innovation orientation of the firm. Following the study will present the barriers used in literature of innovation as following:
The technical barrier, which focuses on the lack of technological tools, training, R&D and the interest in learning new technologies and how these issues constrain the innovation implementation in the firm (Abdullah, Zailani, Iranmanesh, & Jayaraman, 2016; Long, Blok, & Coninx, 2016).
The financial barriers which was addressed from two different point of view, the internal financial problems; such as lack of budget to spend on innovations and its tools and training, and the cost of setting up these innovations and the manpower’s cost related to the new technologies implemented. On the other hand, financial barriers are to be considered as external issue, tackling the problems of the paucity of external partner or funder and bank loan restrictions on the financial aids in addition to the financial disincentive of using new innovation in the market (D'Este, Rentocchini, & Vega-Jurado, 2014; Long et al., 2016; Ryszko, 2014; Sandberg & Aarikka-Stenroos, 2014).
The process barriers which took detailed procedure complexes of digital innovation in construction industry into consideration, like; slow speed of computer in processing 3D models and drawing extraction, complicated performance of innovation tools or software, inability of software to handle complex geometry, disintegration of 3D models to multiple sources or Inadequate level of details needed for 3D models (Frenkel, 2003; Huang & Chi, 2013; Long et al., 2016; Sandberg & Aarikka-Stenroos, 2014).
The psychological barriers addressed mainly the issues of stakeholders fear of change in work, product, processes, new marketing changes, financial changes which might results from the increase of labor cost, profit loss or even the fear of total failure, in addition to the lack of psychological assurance and trust in digital technology as concept and as tools (Abdullah et al., 2016; Frenkel, 2003; Huang & Chi, 2013; Sandberg & Aarikka-Stenroos, 2014).
The management barriers which mainly concern about the managerial and leadership skills and the level of support granted by management to the implementation of the innovation, and in addition to the level of collaboration and effective communication regarding the innovation teams and groups. This barrier was specifically mentioned by researchers concern about the construction industry (Abdullah et al., 2016; Bobera & Lekovic, 2013; Huang & Chi, 2013; Sandberg & Aarikka-Stenroos, 2014).
The cultural barriers is considered as a vast barrier that can include several stakeholders’ culture, such as the customers, the owners, and even the employees may develop their own culture, and that is why it can be considered as a factor that include internal and external items, that can vary from lack of empowerment and support, in addition to poor organization attitude to innovation and the adversarial relationship among staff (Abdullah et al., 2016; Long et al., 2016; Ryszko, 2014; Sandberg & Aarikka-Stenroos, 2014).
The Environmental barrier, which represent the surrounding communities affecting the firm as lack of customer demand, innovation commercial benefit or even the lack of business incubators for startups, in addition to the market entry barriers, conditions and restrictions. (Abdullah et al., 2016; D'Este et al., 2014; Long et al., 2016; Ryszko, 2014; Sandberg & Aarikka-Stenroos, 2014).
Finally, the Governmental constrains and legislation, one of the main external barriers that is considered to be a significant barrier to innovation (Bernstein & Pittman, 2004; Jones & Saad, 2003; Whyte, 2011; Yoo et al., 2010). Lack of support, too much constrains and conditions, Inflexible building codes, and several other practices would obstacle the innovation implementation in construction firms (Abdullah et al., 2016; Huang & Chi, 2013; Ramilo, 2014; Sandberg & Aarikka-Stenroos, 2014; Yoo et al., 2010).
Problem Statement
Planning for the after war phase “rebuild/ reviving” the most important sector that will be addressed is the construction sector, which will take the biggest budget of the rebuild projects. Construction and innovation has a vast history of contravention studies and trials, although the construction industry is often accused by implementing less innovations than other industries (Bankvall, Bygballe, Dubois, & Jahre, 2010), still the innovation has huge impact on increasing the productivity of the construction firms and saving all kind of resources used in this industry (Iranmanesh & Kamal, 2015; Kamal et al., 2016), and many studies proved the significant positive relation innovation generally has on performance of the construction companies (Panuwatwanich, Stewart, & Mohamed, 2008; Sexton & Barrett, 2005). So the first need is inspecting the current orientation of innovation of that the of the Syrian construction firms during the war.
Secondly, regarding the innovation orientation of the Syrian construction firms, the orientation would be affected by the level of innovation tools used and the barriers to implement these tools will affect the choice of the firm, whether to be creative or just to be content with adaptation from the competitors, and this will lead to the main need this study is investigating, which is to identify the relation in-between the barriers to the implementation of innovation tools and the innovation orientation of the firm, illustrating which barrier effect on both orientation or on one of them only, or never have any significant effect on either to help the Syrian managers to take appropriate decisions and assist them to improve their performance and boost the quality of their firms’ products.
Purpose of the Study
The main purpose of this study is to develop a model to measure the effect of significant barriers to digital innovation on the innovation orientation of the Syrian construction firms; by inspecting the current innovation orientation status of these firms and identifying the significant barriers on each of the innovation orientation.
Research Methods
The questionnaire developed in this research is a self-administered questionnaire which included ten (10) constructs (latent variables) 8 of them are the innovation barriers namely; technical, financial, process, management, psychological, cultural, environmental, and governmental. Whereas, the remaining two constructs were the innovation orientation; adoption and creation, and each of them is measured by several measurement items with total of 50 items (table
This study implemented the 7-point Likert-scale where the respondents were asked how strongly they evaluated the importance of the effect one situation has on the innovation of the firm or how the strongly they believe that one statement that describes the status of their firms.
Regarding the measurement items of the constructs, it was found that there were several reflective items that can be combined to form a single formative construct in order to make all the indicators as formative (Petter, Straub, & Rai, 2007). Whereas other indicators might describe categories or characteristics of the construct and cannot be interchange with each other, these indicators are named formative indicators (Petter et al., 2007). So, in this study, all the 50 items are formative, and they were calculated according to the formative statistical models and criteria in Warp PLS 6.0.
Findings
In the following section the study will demonstrate the findings according to three categories and conclude with the final statistic findings:
Profile of Respondents
The first section of the survey inquired about personal and firms’ characteristics. Table
Table
Descriptive Analysis
Respondents' perceptions of the innovation barriers and innovation orientation were illustrated in table
The descriptive analysis shows the perception of the respondents of the current innovation orientation status of their firms. table
Assessment of Model Using PLS-SEM
To assess a framework using PLS-SEM methodology, this study followed a two-step process; 1st assessment of the measurement model and 2nd assessment of structural model (Chin, 2010; Hair, Ringle, & Sarstedt, 2011). To assess the measurement model the study tested the latent variables (LVs) and their associated observable items. Whereas to assess the structural model, the study examined the relationships between the LVs.
To assess the measurement model of the formative constructs, first we need to adjust the default settings to suit the type of the data of this study; 1.The outer model analysis algorithm; according to Kock (2017) if the constructs are formative then the Mode B should be selected, 2. The default inner model "Warp2" was selected, 3. The Re-sampling method is "Stable1" (Kock, 2017). Second, the following four values should be calculated and reported: 1) the outer weight of the items should be significant, 2) P value of the outer weights was lower than 0.05 and significant. 3) Variance Inflated Factor (VIF), or collinearity between the items associated with the formative construct, should be lower than 5. (Chin, 2010; Hair et al., 2011) 4) the collinearity between the constructs (F. Hair Jr, Sarstedt, Hopkins, & G. Kuppelwieser, 2014). Table
All the full collinearity values were less than 3.3, which Kock and Lynn (2012) mentioned as a fairly conservative threshold, thus our model is free from pathological collinearity. Secondly all the VIFs values which are between the associated formative construct indicators were lower than 5, and lastly and the P values of the outer weights was lower than 0.05 and the outer weight were significant values as indicated in Table
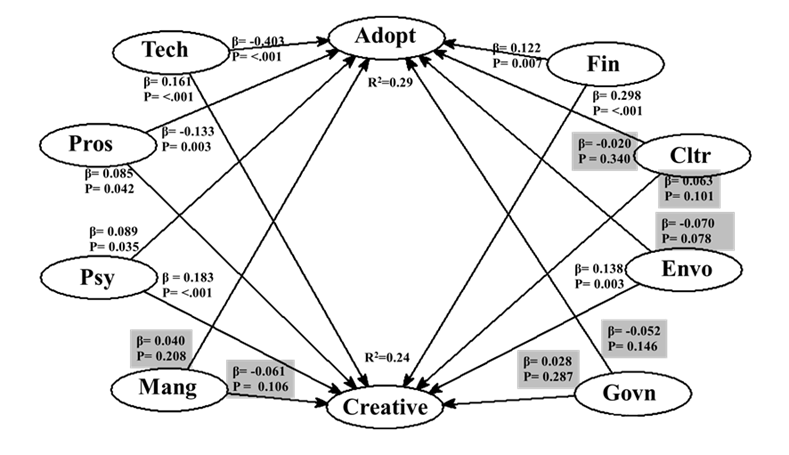
To assess the structural model and test the proposed hypotheses using PLS-SEM, two criteria needed to be investigated and reported: 1) the R2 measure for the endogenous constructs, 2) the path coefficients with its associated P value (Chin, 2010; Hair et al., 2011; Henseler, Hubona, & Ray, 2016; Lefcheck, 2016). The path coefficients should be significant and its P value should be insignificant; however, the value of R2 may vary according to the area of the research. Chin (2010) proposed the values of 0.67, 0.33, and 0.19 as measures for R2 to be considered as substantial, moderate, and weak, respectively. In Social studies R2 value is usually very low and weakest values is to be high relatively (Colton & Bower, 2002; Hair et al., 2011; Hao, Prevost, & Wongchoti, 2018). R2 values were 0.29 for the adoption, whereas 0.24 for the creation, and these values are accepted by consumer behavior research standards (Kock, 2017). Whereas, regarding the Path Coefficient and the P values, the Table
The barriers which significantly affected both DVs -creation and adoption- innovation orientation were 4 barriers; Technical, Financial, Process and Psychological barriers, which they had insignificant P values <0.05. However, when inspecting the Path Coefficient value of the Technical barrier, it was found that the adoption value is negative, whereas the creation value is positive, which means that the more stronger the Technical barrier the more adoption solutions and innovations the firm is going adopt, and in the contrary, the more stronger technical barrier the less creation innovation orientation the firm is going to be.
Regarding the Financial barrier, it is noticed that both Path Coefficient values are positive, that means the stronger this barrier the more negative effect will be there on both innovation orientation. However, the adoption path coefficient value is less that the creation, so the firm will tend to be more adoption in the case of strong financial barrier.
Regarding the Process barriers, it was found that adoption coefficient value is negative whereas the creation is positive, which means a stronger Process barrier will drive the firm to be adoption and restrain it from being creation. Whereas, regarding the Psychological barriers and despite the similar positive sign of the coefficient value, but the value of the adoption is less than the creation coefficient, so the stronger Psychological barrier would drive the firm to be more creation than adoption.
Finally, the environmental barrier P value varied, despite the highly insignificant accepted P value of the creation orientation 0.003<0.05, the P value of the adoption orientation was 0.075> 0.05 which is in spite the close P value but it was not accepted, and in that case the environmental barrier would have insignificant effect on the adoption orientation of the firm, whereas the stronger business environmental barrier would affect negatively of the creation orientation of the firms' innovation implementation. On the other hand, we have three barriers that were not supported due to high P values that exceeded 0.1which means there is no significant relation between these barriers and the innovation orientation with its both kinds, adoption and creation, which are; Management, Cultural and Governmental, where the highest P value was 0.340 of the effect of Cultural barriers on the adoption orientation, and the least was 0.101 also for the cultural barrier but to the creation orientation.
Conclusion
From the descriptive analysis regarding the innovation orientation, the mean statistics reflect in-awareness because that the most of the means revolves around the value of 4 which is "Neutral" which reflect a level of unawareness and insignificance of innovation orientation and implementation. The least mean values we can find are the adoption 3,4 which are 3.624 - 3.631 respectively, whereas the average of the adoption and creation orientation were 4.214 - 4.346 respectively.
However, as far as the statistics of the causal effect between the variables are considered, 4 barriers affected significantly both of the innovation orientation; technical, financial, process and psychological, and this supports the literature of (Abdullah et al., 2016; D'Este et al., 2014; Ryszko, 2014; Sandberg & Aarikka-Stenroos, 2014). Whereas, the significant effect of environmental barrier is only effecting creation orientation significantly, whereas has no significant effect on creation orientation. On the other hand, the barriers of management, culture and government support had no significant effect on neither innovation orientation and that contradict the literature of (Abdullah et al., 2016; Bernstein & Pittman, 2004; Jones & Saad, 2003; Whyte, 2011; Yoo et al., 2010).
Lastly, it is recommended that future studies should investigate the moderation effect the major moderating groups has on this relationship between the innovation barriers and the innovation orientation. For example, the firm size is a major moderating variable used by a lot of researchers in innovation fields, and the behaviour would definitely vary between the large firms and the SMEs, due to the differences in managerial structure, styles and methods. Moreover, the type of respondents is this study has two different types (architects and civil engineers) which definitely will have different opinion, experience and behaviors toward handling the new innovations. So, it is highly recommended to extend a comparative study between the behaviors of these two major players in the construction industry.
Acknowledgments
The paper presented for this conference is funded by School of Housing, Building and Planning, Universiti Sains Malaysia. The support is greatly acknowledged.
References
- Abdullah, M., Zailani, S., Iranmanesh, M., & Jayaraman, K. (2016). Barriers to green innovation initiatives among manufacturers: the Malaysian case. Review of Managerial Science, 10(4), 683-709.
- AbuJarad, I. Y., & Yusof, N. A. (2010). Innovation creation and innovation adoption: A proposed matrix towards a better understanding. International Journal of Organizational Innovation (Online), 3(1), 303.
- Bankvall, L., Bygballe, L. E., Dubois, A., & Jahre, M. (2010). Interdependence in supply chains and projects in construction. Supply Chain Management: An International Journal, 15(5), 385-393.
- Bernstein, P. G., & Pittman, J. H. (2004). Barriers to the adoption of building information modeling in the building industry. Autodesk building solutions.
- Black, I. (2016). Report on Syria conflict finds 11.5% of population killed or injured. The Guardian. Retrieved from https://www.theguardian.com/world/2016/feb/11/report-on-syria-conflict-finds-115-of-population-killed-or-injured
- Blayse, A. M., & Manley, K. (2004). Key influences on construction innovation. Construction innovation, 4(3), 143-154.
- Bobera, D., & Lekovic, B. (2013). Barriers to Innovation in Ap Vojvodina: Analysis Of Data And Research Findings From The Aspect Of Age And Gender. In U. Bacher, D. Barkovic, K. H. Dernoscheg, M. LamzaMaronic, B. Matic, & B. Runzheimer (Eds.), Interdisciplinary Management Research Ix (Vol. 9, pp. 57-66).
- Chin, W. W. (2010). How to write up and report PLS analyses Handbook of partial least squares (pp. 655-690): Springer.
- Colton, J. A., & Bower, K. M. (2002). Some misconceptions about R2. International Society of Six Sigma Professionals, EXTRAOrdinary Sense, 3(2), 20-22.
- D'Este, P., Rentocchini, F., & Vega-Jurado, J. (2014). The Role of Human Capital in Lowering the Barriers to Engaging in Innovation: Evidence from the Spanish Innovation Survey. Industry and Innovation, 21(1), 1-19. doi:
- Damanpour, F., & Gopalakrishnan, S. (1998). Theories of organizational structure and innovation adoption: the role of environmental change. Journal of Engineering and technology management, 15(1), 1-24.
- Damanpour, F., & Wischnevsky, J. D. (2006). Research on innovation in organizations: Distinguishing innovation-generating from innovation-adopting organizations. Journal of Engineering and technology management, 23(4), 269-291.
- F. Hair Jr, J., Sarstedt, M., Hopkins, L., & G. Kuppelwieser, V. (2014). Partial least squares structural equation modeling (PLS-SEM) An emerging tool in business research. European Business Review, 26(2), 106-121.
- Frenkel, A. (2003). Barriers and limitations in the development of industrial innovation in the region. European Planning Studies, 11(2), 115-137. doi:
- Hair, J. F., Ringle, C. M., & Sarstedt, M. (2011). PLS-SEM: Indeed a silver bullet. Journal of Marketing theory and Practice, 19(2), 139-152.
- Hao, W., Prevost, A., & Wongchoti, U. (2018). Are Low Equity R2 Firms More or Less Transparent? Evidence from the Corporate Bond Market. Financial Management.
- Henseler, J., Hubona, G., & Ray, P. A. (2016). Using PLS path modeling in new technology research: updated guidelines. Industrial management & data systems, 116(1), 2-20.
- Huang, X., & Chi, R. (2013). Innovation in China’s high-tech industries: barriers and their impact on innovation performance. International Journal of Technology Management, 62(1), 35-55.
- Iranmanesh, M., & Kamal, E. M. (2015). Innovation practices in construction firms. Advances in Environmental Biology, 9(5), 124-126.
- Jones, M., & Saad, M. (2003). Managing innovation in construction: Thomas Telford.
- Kamal, E. M., Yusof, N. A., & Iranmanesh, M. (2016). Innovation creation, innovation adoption, and firm characteristics in the construction industry. Journal of Science & Technology Policy Management, 7(1), 43-57.
- Kock, N. (2017). WarpPLS User Manual: Version 6.0: Laredo, TX: ScriptWarp Systems.
- Kock, N., & Lynn, G. (2012). Lateral collinearity and misleading results in variance-based SEM: An illustration and recommendations.
- Kong-Seng, L., & Yusof, N. (2011). Organizational culture and innovation adoption/generation: A proposed model. World Academy of Science, Engineering and Technology, 58(1), 268-273.
- Lefcheck, J. S. (2016). piecewiseSEM: piecewise structural equation modelling in R for ecology, evolution, and systematics. Methods in Ecology and Evolution, 7(5), 573-579.
- Long, T. B., Blok, V., & Coninx, I. (2016). Barriers to the adoption and diffusion of technological innovations for climate-smart agriculture in Europe: evidence from the Netherlands, France, Switzerland and Italy. Journal of Cleaner Production, 112, 9-21.
- Naranjo-Valencia, J. C., Jiménez-Jiménez, D., & Sanz-Valle, R. (2011). Innovation or imitation? The role of organizational culture. Management Decision, 49(1), 55-72.
- Panuwatwanich, K., Stewart, R. A., & Mohamed, S. (2008). The role of climate for innovation in enhancing business performance: The case of design firms. Engineering, Construction and Architectural Management, 15(5), 407-422.
- Petter, S., Straub, D., & Rai, A. (2007). Specifying formative constructs in information systems research. MIS quarterly, 623-656.
- Ramilo, R. (2014). Key determinants and barriers in digital innovation among small architectural organizations. Journal of Information Technology in Construction (ITcon), 19(11), 188-209.
- Ryszko, A. (2014). Drivers and barriers to the implementation of eco-innovation in the steel and metal industry in Poland: METAL.
- Sandberg, B., & Aarikka-Stenroos, L. (2014). What makes it so difficult? A systematic review on barriers to radical innovation. Industrial Marketing Management, 43(8), 1293-1305.
- Seng, L. K., Yusof, N. A., & Abidin, N. Z. (2011). Types of Innovation Implemented by Housing Developers in A Developing Country. International Journal of Academic Research, 3(3).
- Sexton, M., & Barrett, P. (2005). Performance-based building and innovation: balancing client and industry needs. Building Research & Information, 33(2), 142-148.
- Slaughter, E. S. (1998). Models of construction innovation. Journal of Construction Engineering and management, 124(3), 226-231.
- Svensson, J. (2012). Living Lab Principles-Supporting Digital Innovation. Paper presented at the ISPIM Conference Proceedings.
- UNHCR. (2017). The UN Refugee Agency. Retrieved from http://data.unhcr.org/syrianrefugees/ regional.php
- Whyte, J. (2011). Information management and its impact on project management. Oxford Handbook on the Management of Projects. Oxford University Press, Oxford.
- Winch, G. (2003). Models of manufacturing and the construction process: the genesis of re-engineering construction. Building Research & Information, 31(2), 107-118.
- Yoo, Y., Lyytinen, K. J., Boland, R. J., & Berente, N. (2010). The Next Wave of Digital Innovation: Opportunities and Challenges: A Report on the Research Workshop'Digital Challenges in Innovation Research'.
- Yusof, N. A., Mustafa Kamal, E., Kong-Seng, L., & Iranmanesh, M. (2014). Are innovations being created or adopted in the construction industry? Exploring innovation in the construction industry. Sage Open, 4(3), 2158244014552424.
Copyright information

This work is licensed under a Creative Commons Attribution-NonCommercial-NoDerivatives 4.0 International License.
About this article
Publication Date
02 August 2019
Article Doi
eBook ISBN
978-1-80296-064-8
Publisher
Future Academy
Volume
65
Print ISBN (optional)
-
Edition Number
1st Edition
Pages
1-749
Subjects
Business, innovation, sustainability, environment, green business, environmental issues
Cite this article as:
Kadi, A. J., Kamal, E. M., Yusof, N., & Rasoolimanesh, S. M. (2019). The Effect of Innovation Barriers on Construction Firms’ Innovation Orientation. In C. Tze Haw, C. Richardson, & F. Johara (Eds.), Business Sustainability and Innovation, vol 65. European Proceedings of Social and Behavioural Sciences (pp. 340-351). Future Academy. https://doi.org/10.15405/epsbs.2019.08.34