
Deducing The Basement Rock Of Pekan Using Electrical Conductivity

Abstract
Pekan, Pahang is generally covered with unconsolidated Quaternary alluvium as it makes up the Pahang Delta. Well studies have shown that the underlying metasediments and volcanic basement of Pekan are shallow, with increasing depth towards the shoreline. However, the structure of the basement is still unknown due to the poorly distributed wells throughout the Pekan district. Thus, the Transient electromagnetic (TEM) survey was conducted to provide a better data coverage by measuring the basement rock electrical conductivity. 300mS/m was set as the threshold value in filtering the conductivity values. These values are then used to create a 2D pseudo section along the profile A-A’. The pseudo section has revealed that the depth of the basement conforms the boreholes data in Pekan despite having an irregular structure along the profile. The conductivity value of the Pekan basement rock is found to be approximately 37.5 mS/m which matches the range of weathered granite value.
Keywords: “TEM Survey”“Conductivity of Rocks”“Pekan”“Basement Rocks”
Introduction
Transient Electromagnetic Method (TEM) is one of the geophysical surveys that has been utilized for more than half a century. The method measures the response of the ground towards the propagation of Electromagnetic (EM) field transmitted. The response varies according to the conductivity of the lithology and decays with time.
TEM is able to provide near-surface assessment down to a depth of several hundred meters deep, depending on the power source and the size of the loop. This method is commonly utilized for groundwater investigations and salt water intrusion studies. However, with different lithology producing various range of conductivity values, TEM can serve as a suitable technique in deducing the basement rock of Pekan.
Geology of Pekan
Pekan is a part of the Pahang delta, making it one of the flat areas in Peninsular Malaysia. The delta is estimated to be part of the landmass approximately 1800 years ago (Nossin, 1964, 1965). This area is generally covered by unconsolidated Quaternary alluvium which is overlying the volcanic and Permian metasediments basement (Yusoff, Mohamad, Ghani, & Jamaluddin, 2004). The basement rock of Pekan deepens and widens towards the East, forming a funnel-like shape opening which supplies sediments to the Penyu Basin, 39 km offshore of Pekan (Ali, 2001)
The Quaternary alluvium is classified into two sedimentary sequences, according to their respective age (Ali, 2002). Though both sedimentary sequences are Quaternary alluvium, they are not associated with one another. Sequence A appears to be linked to the present-day Pahang River delta complex depositional system whereas Sequence B is not. Sequence B sediments consists of conglomerate, conglomerate sand, sand, and mud. The presents of conglomerate may suggest that the sedimentation occurred in a high energy fluvial environment. Though the lithology present in Pekan are known, the structure and distribution of its basement rock remained ambiguous. This is due to the absence of exposed outcrop and poorly distributed well data making it hard to be predicted.
Problem Statement
Based on previous studies, the well data has revealed that the basement rock of Pekan vicinity is shallow, approximately 2 to 180 meters in depth. However, due to the poorly distributed wells throughout the Pekan district, the structure of the basement remains unknown.
Research Questions
-
What is the possible structure of basement rock in Pekan?
-
What is the conductivity value of the basement rock in Pekan?
Purpose of the Study
Given that the depth of the Pekan basement rock is shallow, it permits TEM survey to be conducted as the targeted depth of investigation complies the method’s maximum depth of penetration. Therefore, this study aims to deduce the structure and depth of Pekan basement rock based on its electrical conductivity using Transient Electromagnetics which will aid in further geological studies in the area (Figure
Research Methods
Data Acquisition
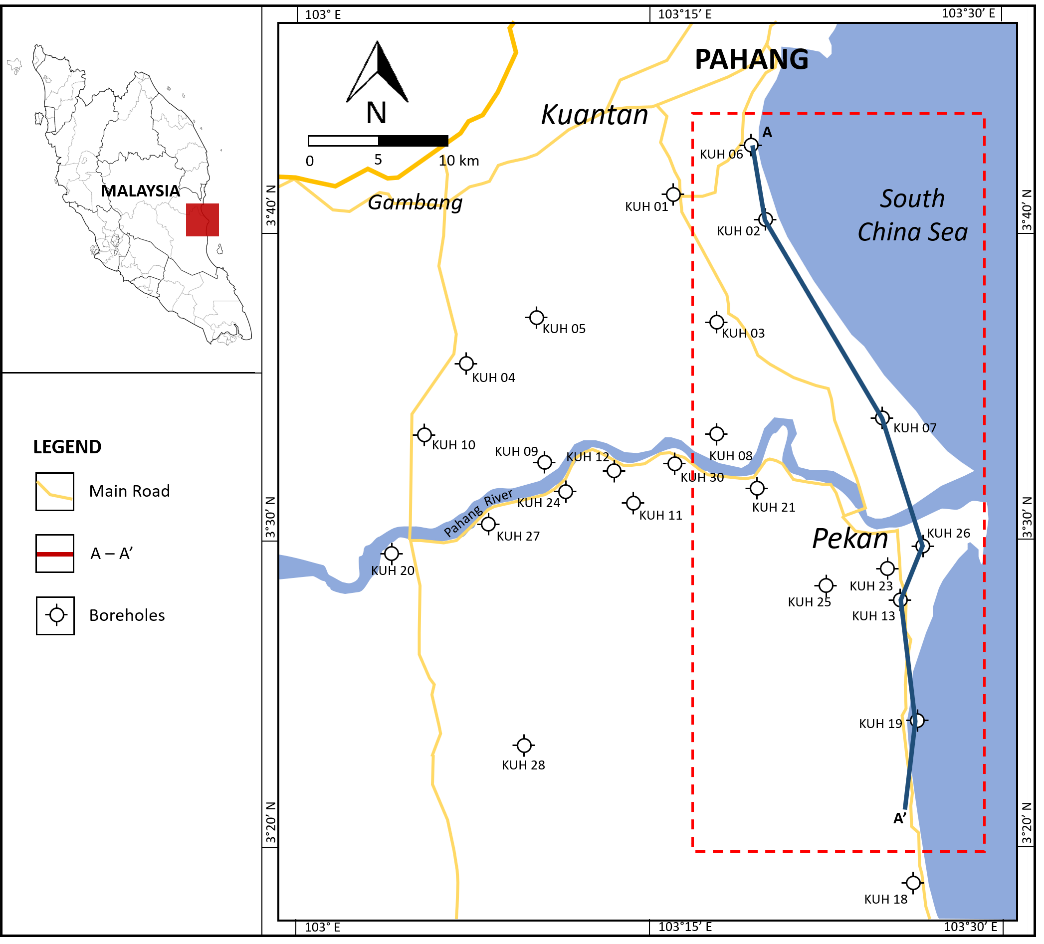
The TEM survey was conducted covering the whole of Pekan area with 179 data points. A single loop configuration was used for the 50 by 50 meters survey. The size of the loop is dependent on the depth of interest, as the depth of investigation of TEM is proportional to the 1/5 power of the source moment (Spies, 1989). The fixed loop size and a low frequency of 6 Hz was used which enabled us to acquire conductivity values down to a depth of 200 meters. In addition, three readings were acquired per data point with 500 stacks to increase accuracy.
Well Data
Thirty (30) well data conducted by the Jabatan Penyiasatan Kajibumi Malaysia in 1992 and 1993 were also used to control the interpretation of the electromagnetic data. These well data consist of lithology information which aids in understanding the basement rock geometry and structure of Pekan (Baharuddin, 1992, 1993).
Apparent Conductivity
The TEM data was processed using the terraTEM plotting software (Figure
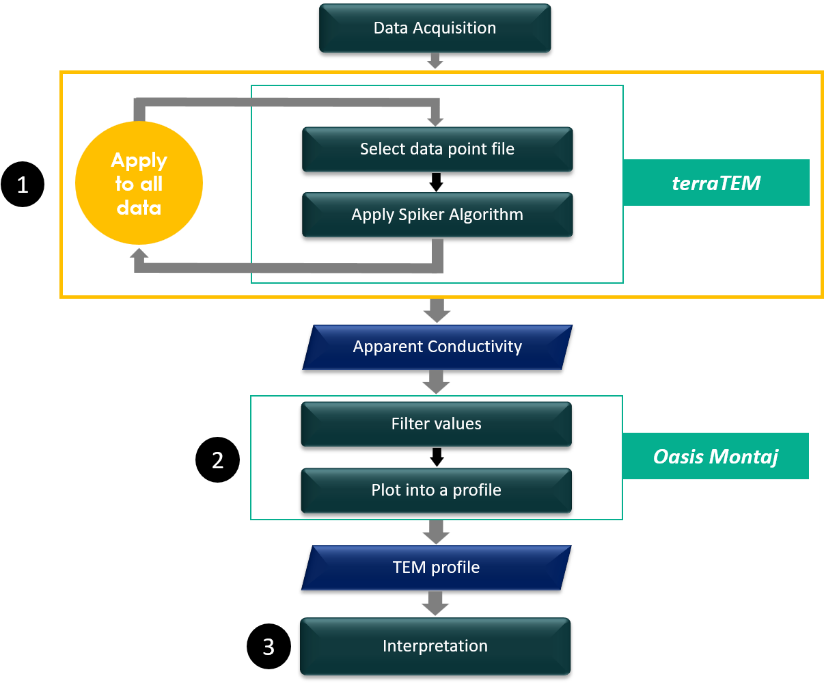
TEM Pseudo Section Profile
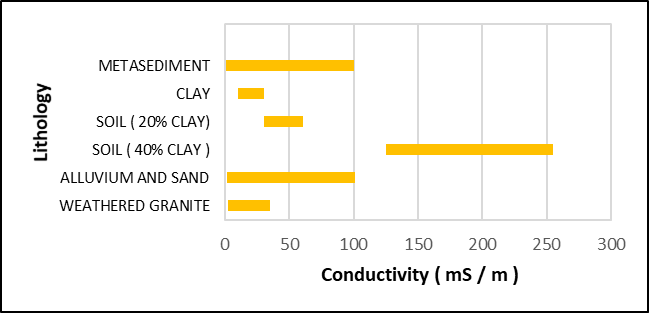
TEM data points that along the North-South (N-S) well data cross section made by Ismail et. al in 2002 are selected. Each lithology yields a variety range of conductivity values as it is mainly influenced by porosity, hydraulic permeability, moisture content, the concentration of dissolved electrolytes, temperature, phase pore fluid as well as the clay content of the lithology (McNeill, 1980). Thus, since it is expected that the lithology in the study area would yield specific range of values (0 to 300 mS/m), the conductivity values were filtered before being gridded into a profile (Figure
Findings
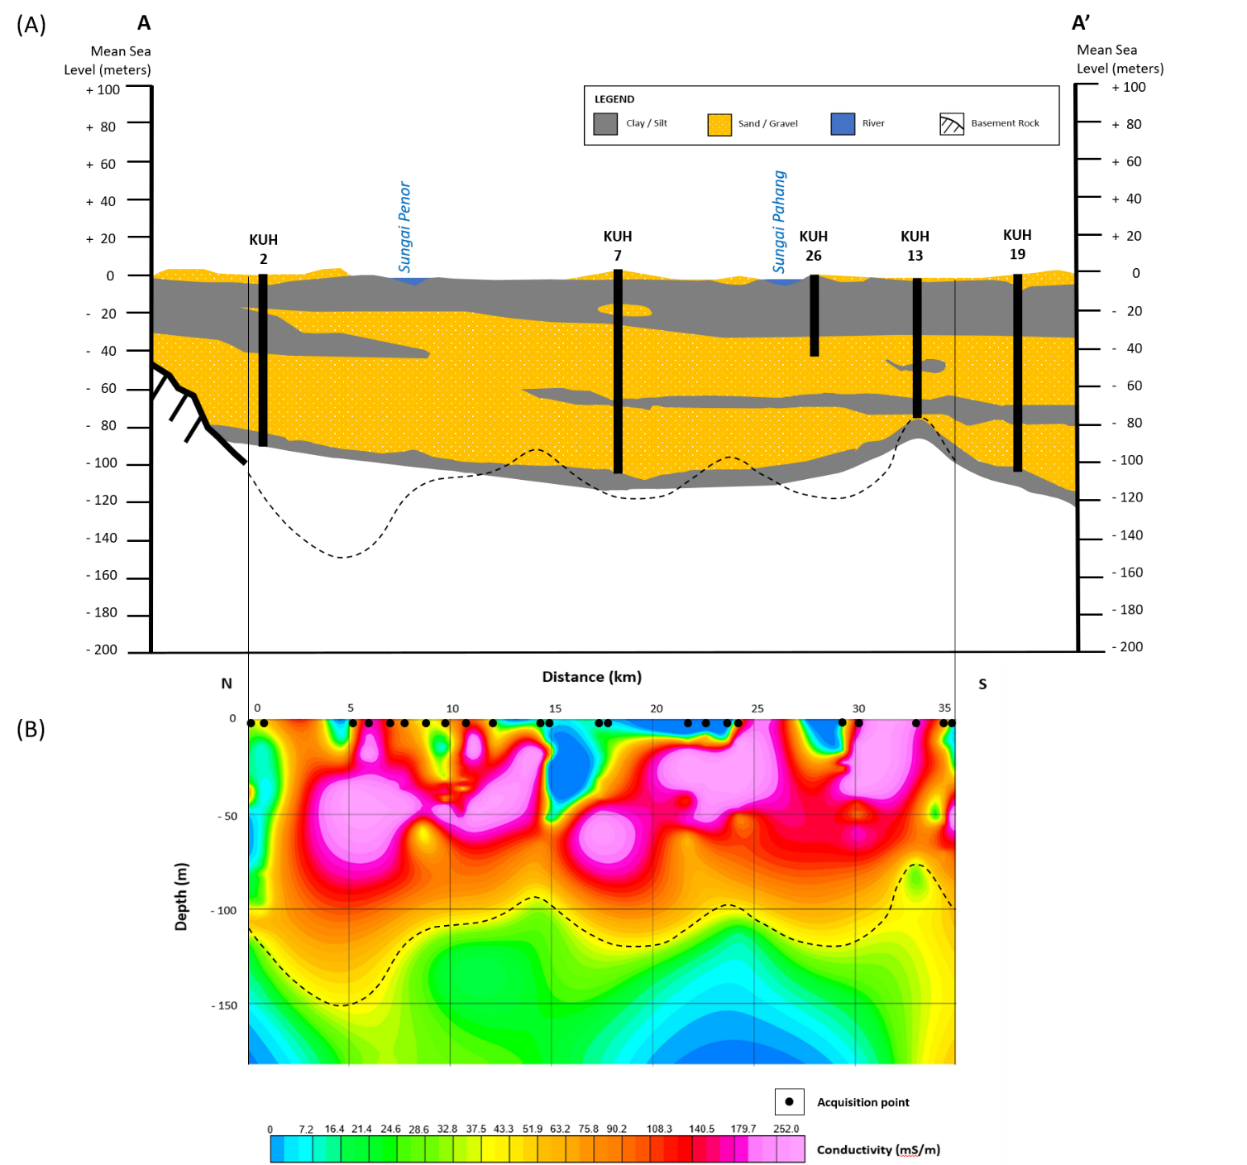
The Pekan basement rock are volcanic and metasediments which make the conductivity value to range from 10 – 35 mS/m and 0 – 100 mS/m respectively. The low conductivity values at deeper depths (more than 70 meters) correspond to the basement rock, where it’s conducting values are ought to be 37.5 mS/m (Figure
The contrast between the conductivity values of the basement and alluvium-soil allows us to predict the Pekan basement rock structure. The conductivity boundary separating the low and high conductivity produces a trend in the 2D pseudosection profile at 100 meters depth. In fact, a similar trend could be observed in the profile A-A’ lithological cross section which conforms the TEM results.
Conclusion
This paper has provided a general overview of the Pekan, Pahang basement rock structure from North to South by utilizing Transient Electromagnetics method. This study differs from previous approaches, as it uses the electrical conductivity of lithologies to characterize the subsurface. The structure and depth of the basement rock along the profile A-A’ has been illustrated in the TEM profile obtained, where the trend of the structure conforms the well data lithology sections with the deepest depth of basement at 150 meters. This subsurface characterization has successfully proven that TEM is a reliable alternative to other methods such as gravity for subsurface assessment in terms of covering large areas and deep depths of interest.
However, there is much work to be done in this regard, especially in mapping the entire Pekan basement rock. Acquisition of more data points in a spatially distributed manner will be required throughout the whole vicinity of Pekan. Thus, acquiring several TEM profiles in the north to south and east to west orientations would be sufficient to create a 3D conductivity model and further delineate the basement distribution in Pekan. This expansion of work would enhance the effectiveness of this method for studies involving large areas and deep depths of interest.
Acknowledgments
The authors wish to thank Universiti Teknologi PETRONAS for providing the research fund under the Yayasan UTP and the technicians for their help in the data acquisitions process.
References
- Ali, C. A. (2001). Evolusi Delta Sungai Pahang: Bukti-bukti permukaan dan bawah tanah. Warta Geologi, 27(May-Jun 2001), 27–32.
- Ali, C. A. (2002). Sedimentary sequence in the subsurface of the Pekan coastal plain, Pahang. Bulletin of the Geological Society of Malaysia, Annual Geological Conference 2002, 45(May 2002), 293–300.
- Baharuddin, S. (1992). Hidrogeologi dan Prospek Air Tanah Kawasan Aluvium Kuantan - Pekan, Pahang.
- Baharuddin, S. (1993). Hidrogeologi dan Prospek Air Tanah Kawasan Aluvium Kuantan - Nenasi, Pahang.
- McNeill, J. D. (1980). Electrical conductivity of soils and rocks. Ontario, Canada: Geonics Limited.
- Mohamad, I. C., Samsudin, A. R., & Rafek, A. G. (2002). Perubahan fasies hidrokimia dalam akuifer aluvium pantai: Kafflan kes di kawasan Pekan-Nenasi, Pahang. Bulletin of the Geological Society of Malaysia, Annual Geological Conference 2002 Issue, 45, 23–30.
- Nossin, J. J. (1964). Beach ridges on the east coast of Malaya. George Philip & Son.
- Nossin, J. J. (1965). The geomorphic history of the Northern Pahang Delta. J Trop Geogr, 20, 54–64.
- Smith, R. S., Edwards, R. N., & Buselli, G. (1994). An Automatic Technique for Presentation of Coincident-Loop, Impulse-Response, Transient, Electromagnetic Data. Geophysics, 59(10), 1542–1550.
- Spies, B. R. (1989). Depth of Investigation in electromagnetic sounding methods.pdf. Geophysics, 54(7), 872–888.
- Yusoff, I., Mohamad, I. C., Ghani, A. A., & Jamaluddin, T. A. (2004). Groundwater modelling of Nenasi, Pekan, Pahang. Geological Society of Malaysia, 48(June), 41–45.
Copyright information

This work is licensed under a Creative Commons Attribution-NonCommercial-NoDerivatives 4.0 International License.
About this article
Publication Date
17 May 2019
Article Doi
eBook ISBN
978-1-80296-061-7
Publisher
Future Academy
Volume
62
Print ISBN (optional)
-
Edition Number
1st Edition
Pages
1-539
Subjects
Business, innovation, sustainability, environment, green business, environmental issues
Cite this article as:
Bin Zakariah, M. N. A., Bin Mohd Mazlan, M. R., Bin Md Rafek, A. G., Bin Mohd Noh, K. A., & Yoong*, A. A. (2019). Deducing The Basement Rock Of Pekan Using Electrical Conductivity. In M. Imran Qureshi (Ed.), Technology & Society: A Multidisciplinary Pathway for Sustainable Development, vol 62. European Proceedings of Social and Behavioural Sciences (pp. 230-236). Future Academy. https://doi.org/10.15405/epsbs.2019.05.02.22