Deducing The Basement Rock Of Pekan Using Electrical Conductivity
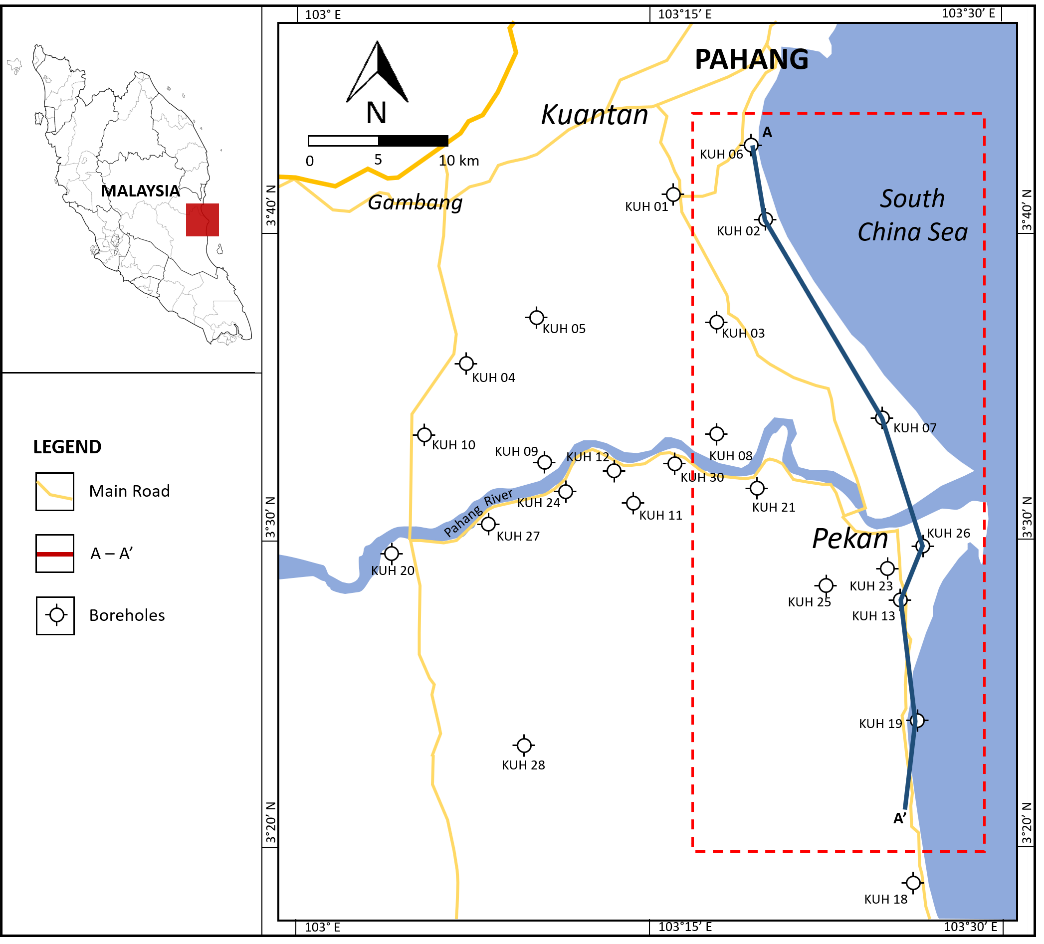
Figure 1: The red box shows the location of the study area which covers the coast of Pekan, Pahang. Whereas, the A -A’ profile represents the well correlation between KUH04, KUH 02, KUH07, KUH26, KUH13 and KUH19.