Deducing The Basement Rock Of Pekan Using Electrical Conductivity
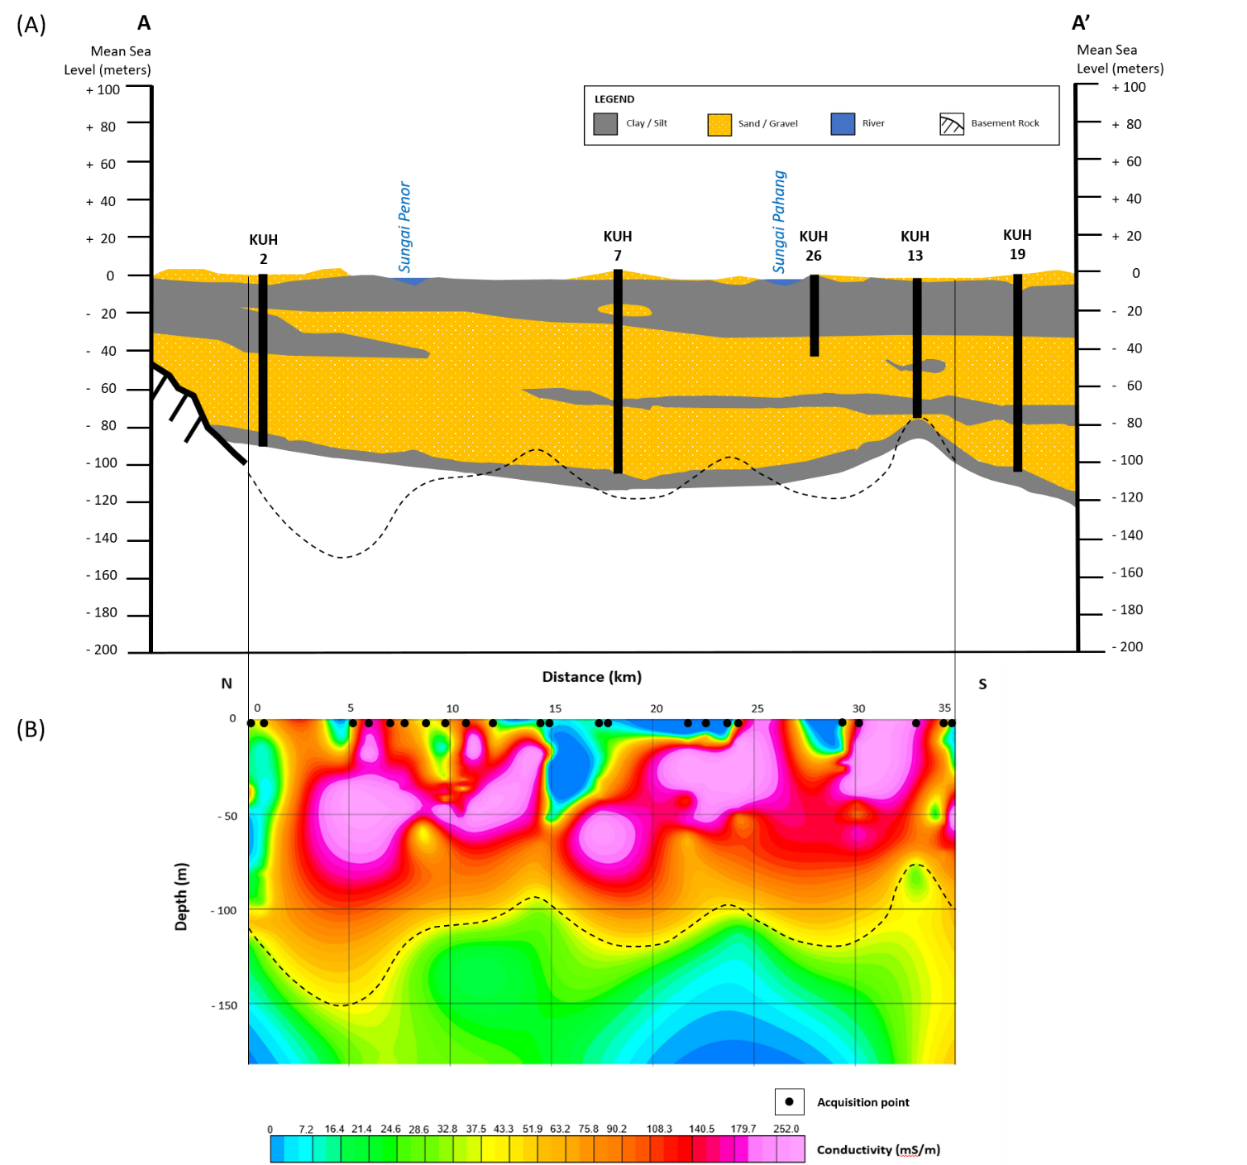
Figure 4: Lithological section modified from Mohamad, Samsudin, & Rafek (2002) across five wells (A) is correlated with the 2D TEM pseudo section (B) along the profile A-A’. The results from TEM shows a similar trend for the distribution of the sediments and basement. The dashed line represents a possible boundary between the Quaternary layer and the granitic basement.