
Test-Retest Reliability Of Behavioural And Erp Measures In Maths-Related Processing


Abstract
Research into test-retest stability of emotional and cognitive responses has focused on behavioural and ERP components in relation to very well-established paradigms (such as oddball, mismatch negativity, continuous performance task, etc.). However, there is a lack of evidence for more integrative paradigms that contain a variety of tasks in a single paradigm. The aim of the present study was to investigate the test-retest reliability for behavioural and ERP components (cue-locked P300 and task-locked P600) in a paradigm composed of three different error-recognition tasks: lexical, arithmetic, and algebraic. Participants completed the paradigm on two occasions, two weeks apart on average. We examined the between-session correlations and mean-level differences. The results showed moderate-to-strong between-session stability for accuracies (
Keywords: ERPstest-retestlexical taskmaths taskP300P600
Introduction
Event-Related Potentials (ERPs) are commonly used to assess sensory, emotional, and cognitive information processing in human participants (Luck, 2014). For example, a wealth of ERP research has provided information on individual differences in emotional reactivity (Taylor-Colls & Pasco Fearon, 2015) and on the influence of visual processing (Luck, 2005). Lately, ERP research has emerged addressing the cognitive-affective processing in children and young adults (Luck, 2014). For example, studies have investigated event-related potentials (ERPs) as predictors of emotional disorders (Bar-Haim, Lamy, Pergamin et al., 2007) and markers of cognitive deficits (Luck & Kappenmann, 2011). Such research can inform us on best ways in early diagnostics of disorders and deficits (Luck & Kappenman, 2011). With increased recognition of the importance of affect and cognitive abilities in academic achievement (OECD, 2013), more research is needed into the underlying mechanisms of these links. To enable this research, it is important to test whether the currently used measures of neural activity are methodologically suited for the study of individual differences. One of the most important methodological issues that needs to be addressed is the stability of the ERP measures, defined as test-retest reliability (Cassidy, Robertson, & O'Connell, 2012). The test-retest reliability of a measure is reflected in the degree to which scores on tests (or any other measures) of an individual are consistent (relative to other individuals in the sample) over multiple measurement occasions in a relatively short period of time (Tabachnick & Fidell, 2007). Consistency of a measure over time is an important feature, required for drawing meaningful conclusions about predictive and diagnostic value of the measure.
The current study investigates the test-retest reliability of emotional and cognitive ERPs in response to task-relevant cues and ERPs associated with performance on lexical and maths tasks. The cues served to produce different levels of anticipatory anxiety as a function of individuals’ domain-specific anxiety (e.g. maths anxiety). In line with previous fMRI research on anticipatory anxiety (Lyons & Beilock, 2012a; 2012b), the study focuses on the reliability of emotional ERPs after the cue onset (P300). Later cognitive ERPs after the task onset (P600) were also investigated. The ERP components (described in the following subsections) were chosen based on the strength of the EEG signal, visual inspection of topographic maps, and visibility of ERP waveforms.
The cue-locked P300 component
The cue-locked P300 provides an indirect measure of early attentional processes that are not accessible through behavioural measures. The P300 is a large centro-parietal deflection, peaking approximately 300ms after cue onset (Luck, 2014). Early accounts emphasized the P300 involvement in the evaluation of stimulus appearance probability: whether it follows a sequence or not (see e.g. oddball paradigm; Polich, 2007). In this framework, the component was considered to be a manifestation of the previous context update (Guo, Duan, Li, & Pallers, 2006). Subsequent research described the role of P300 in attentional resource allocation involved in task preparatory processes (e.g. Pelosi, Holly, Slade et al., 1992; Finke, Escara, & Barcelo, 2012). Given that the P300 can be used as a covert measure of resource allocation, independent of behavioural responding, it is particularly suited to investigate in a multitask paradigm that varies in task demands. Moreover, some studies extended the theory of attentional P300 by suggesting that P300 might be sensitive to emotional stimuli (Cuthbert, Schupp, Bradley, Birbaumer, & Lang, 2000; Keil, Bradley, Hauk, et al., 2002; Hajcak & Olvet, 2008). For example, it was shown that self-relevant stimuli (the ones linked to personal concerns and values) are more likely to receive attentional resources, which will be reflected by increase in P300 amplitude (Gray, Ambady, Lowenthal, & Deldin, 2004). The study from this perspective might add to the existing understanding of negative emotions, such as maths anxiety (Suárez-Pellicioni, Núñez-Peña, & Colomé, 2016). Previous studies investigated mostly oddball task P300 and reported moderate-to-high test-retest correlation coefficients, ranging from 0.50 to 0.80 for component amplitude and from 0.40 to 0.77 for peak latency of component (Fabiani, Gratton, Karis, & Donchin, 1987; Segalowitz & Barnes, 1993; Walhovd & Fjell, 2002).
The task-locked P600 component
The P600 is a positive component that peaks between 500 and 1000ms after stimulus onset (Luck, 2014). P600 has mainly been studied during language processing, particularly, the component has been observed when syntactic structures are violated (e.g. Osterhout & Holcomb, 1993). More recently, research has demonstrated the involvement of the P600 in semantic violations (Swaab, LeDoux, Camblin, & Boudewyn, 2012) and mathematical rule violations (Núñez-Peña & Honrubia-Serrano, 2004). A recent review suggested that P600-related effects reflect an update of current representation of incoming information (Brouwer, Fitz, & Hoeks, 2012). It remains unclear whether P600 reflects common neurocognitive processes associated with rule violations in general, or functionally distinct mechanisms underlying processing of specific information. The paradigm used in the present study includes three types of tasks, enabling an investigation of domain generality vs. specificity of P600, comparing a component for different types of task: language and maths-related ones. While there is a wealth of research on P600 as a component, little is known about its reliability. To our knowledge, there is only one study investigating the reliability of P600 component, which showed a moderate test-retest correlation for the component amplitude (.64) and no correlation for latency (Borghans & Prince, 2013 ). However, there are some studies which consider P3b to be overlapping or qualitatively similar to P600 (see for example Bornkessel-Schlesewsky, Kretzschmar, Tune, et al. 2011). Studies addressing the reliability of P3b showed reliability indices as high as .88 for the area under the curve estimates (see Cassidy et al., 2012).
Problem Statement
Much empirical evidence exists on the stability of ERP components in well-established paradigms investigating emotional and cognitive processes. This contrasts with a lack of research into more integrative paradigms, for example, those containing a variety of tasks in a single paradigm: lexical, arithmetic, and algebraic.
Research Questions
The present study investigated the stability of: (I) accuracies and reaction times of lexical, arithmetic, and algebraic tasks performance; (II) two ERP components: cue-locked P300 in response to lexical, arithmetic, and algebraic cues; and task-locked P600 in response to lexical, arithmetic, and algebraic tasks. The stability will be assessed through examining the mean-level differences and between-session correlations for the behavioural and ERP components in the mentioned paradigm.
Purpose of the Study
To provide information on the stability of behavioural and ERP components that can be used in further research into individual differences in emotional and cognitive processing.
Research Methods
Participants
Participants were recruited at one of two experimental sites: Tomsk State University (Tomsk, Russia) and Psychological Institute of Russian Academy of Education (Moscow, Russia). Participants were recruited through online social media invitations, including participants of the Russian School Twin Registry (Kovas, Galajinsky, Boivin, et al. 2013). All participants had normal or corrected-to-normal vision, with no history of head injury, neurological or psychiatric disorder. The mean age was 20.48 (SD = 4.83). Participants were rewarded 1000RUB (approximately 15USD) for participation in the study. Participants gave written informed consent prior to the study, which was approved by The Ethical Committee for Interdisciplinary Investigations, Tomsk State University. The number of participants varied from 41 to 46 on behavioural measures (accuracies and reaction times), and 33 to 39 on neural measures. The inclusion criteria for this study were based on the availability of at least 30 clean segments of EEG data at the cue and the task onset, across the three different task types.
Materials, procedures, and EEG paradigm
All participants were tested with an interval of two weeks on average (min 1 week, max 1 month) in between sessions. Each session took approximately 120 minutes. Both testing sessions took place at the same time of the day. Participants were tested while seated in an armchair ~70 cm from the computer screen in a dimly lit room to perform the error-recognition task. Participants were then thanked and reimbursed for their time.
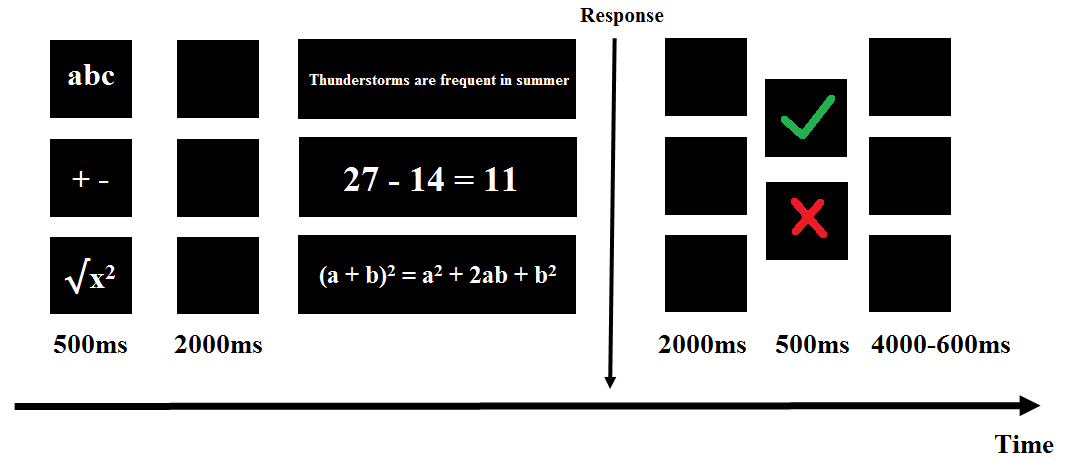
Error-recognition experimental task (during EEG recording)
Figure
EEG acquisition, ERP measures, and electrode grouping
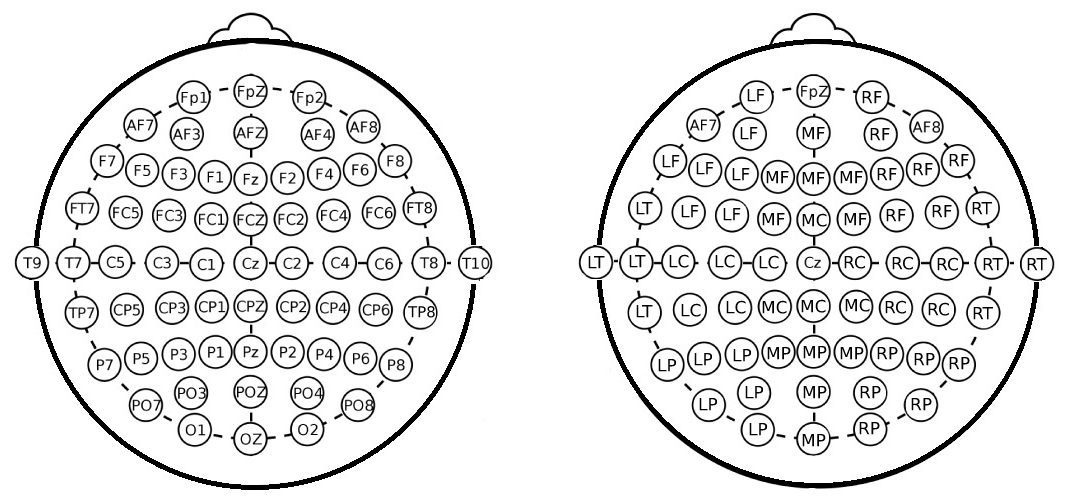
The tasks were presented via a 21.5" (Samsung S22b350, refresh rate 60Hz) monitor located 70 cm away in front of the participant. The signals were amplified using Brain Products GmbH amplifiers (www.brainproducts.com). EEGs were recorded using 64 channels using Ag/Cl electrodes, with 0.1–100 Hz analog bandpass filtering and digitized at 500 Hz. The EEG electrodes were placed according to the international 10–20 system using Quik-Cap 128 NSL and referenced to Cz with ground at Fpz electrode. The signal was re-referenced to global average offline during preprocessing. The data were analysed offline using BrainVision Analyzer2. EEG data were down-sampled from 500 Hz to 256 Hz, filtered from 0.1-30 Hz. The data were then cleaned from artefacts manually, with noisy channels excluded. To remove blink and vertical eye-movement artefacts, independent component analysis (ICA) was performed, on the following electrodes: VEOG - AFz, HEOG - FT9 and FT10. After the ICA the excluded channels were topographically interpolated and semiautomatic artefact rejection was conducted. Stimulus-locked ERPs were extracted from the cue and task presentation from all conditions (lexical, arithmetic, and algebraic tasks) and segmented into epochs of 200ms before to 1000ms after stimulus onset, and baseline-corrected using the prestimulus interval. We measured the P300 within the time window of 250-450ms elicited at the onset of the cue (separately for lexical, arithmetic, and algebraic) and the P600 within the time window of 500-1000ms after the task onset (lexical, arithmetic and algebraic, all in correct and incorrect conditions). The visual inspection of current source density maps confirmed that the classic approach to measuring ERPs would not be suitable for the present study. This is because of the stimuli eliciting waveforms that do not fit the classic ERPs pattern. For this reason, all ERPs were measured with the area under the curve (AUC) method, using standard BrainVision Analyzer2 procedures. The AUC measure accounts for amplitudes and latencies, making it a more stable measure (Luck, 2014). The AUCs were measured extrapolating averages in 11 different scalp areas. Table
Statistical approach
Test-retest stability indices for error recognition accuracy (ERA), error recognition reaction time (ERRT), and ERP measures were estimated as between-session mean-level differences (paired-samples
Findings
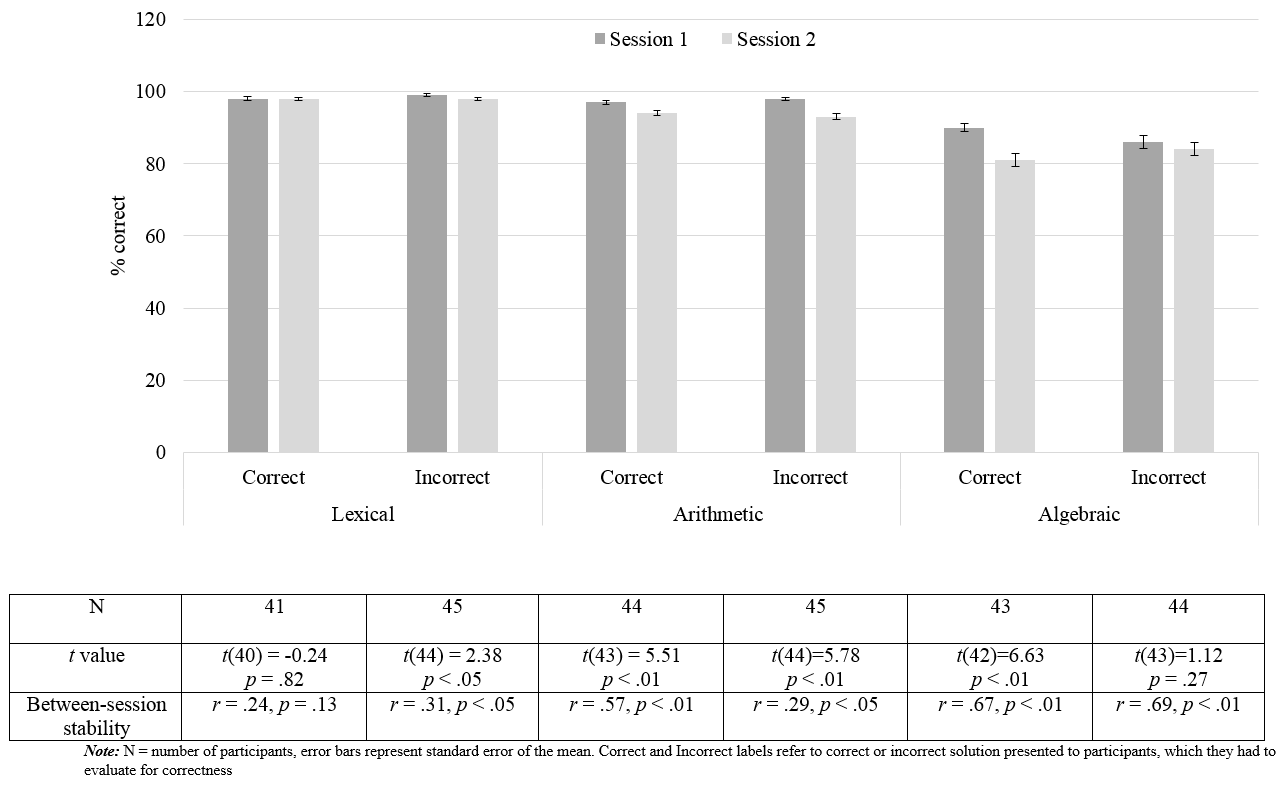
Error recognition task accuracy (ERA)
Accuracies were quantified as percent correct out of a 100% accurate possible. Figure
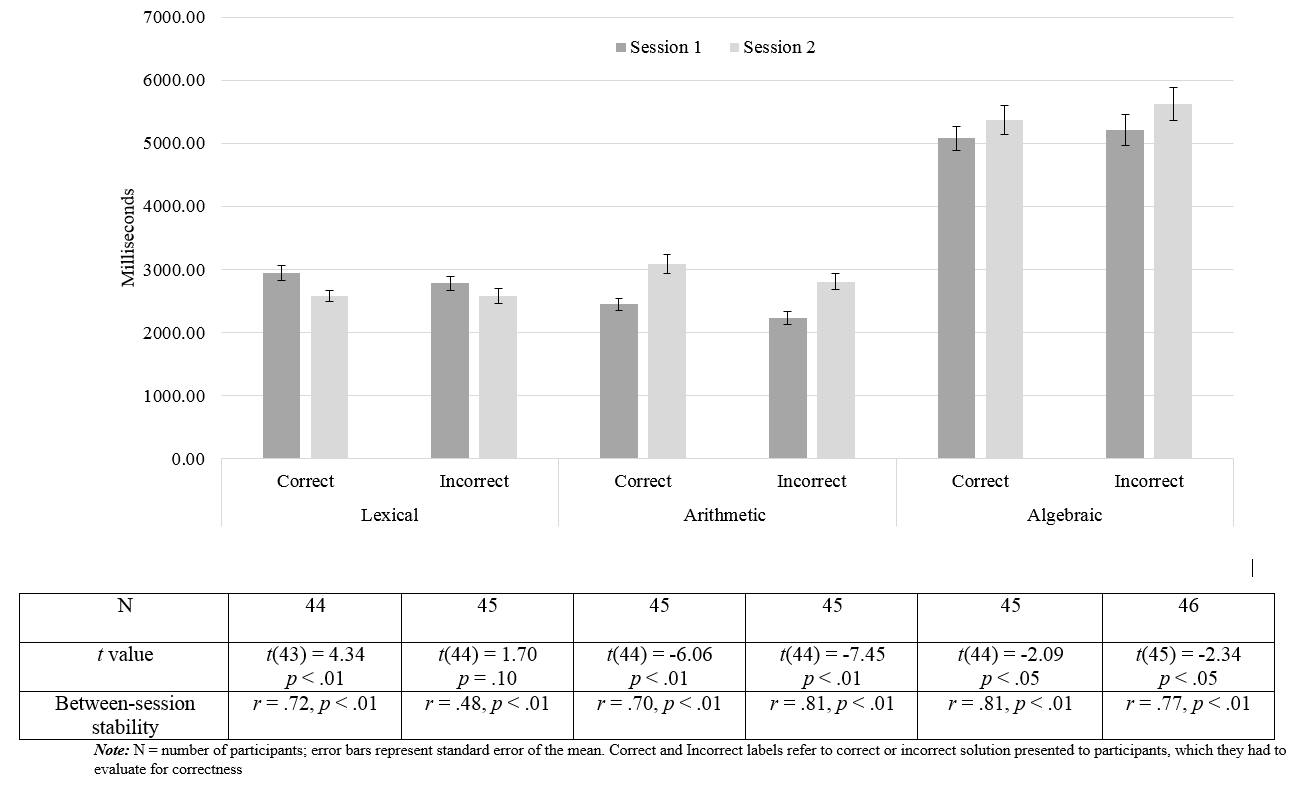
Error recognition task reaction time
Figure
Event-related potentials (ERPs)
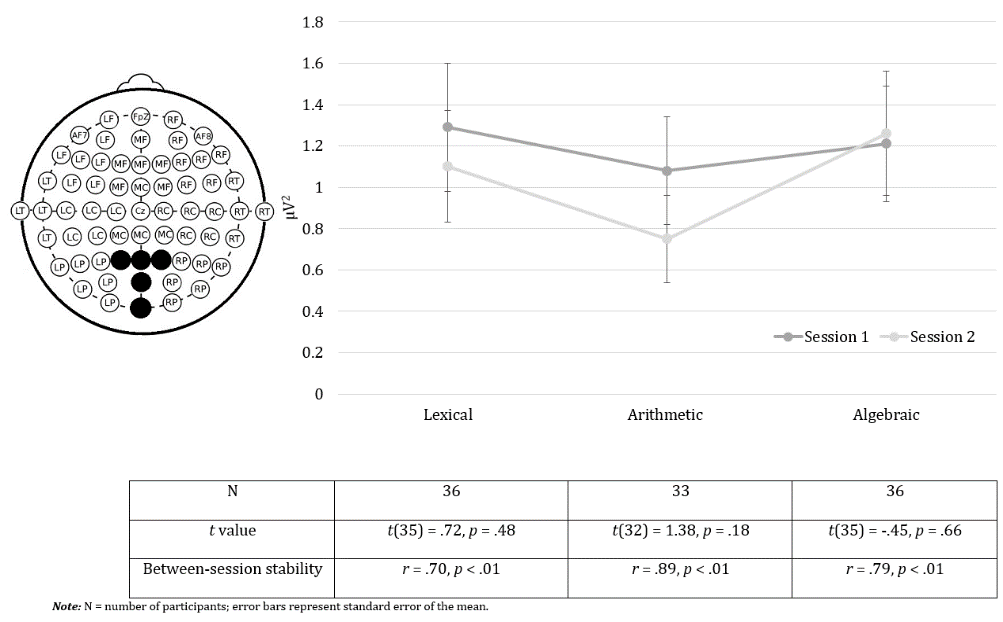
Cue-locked P300 area under the curve (AUC)
Figure
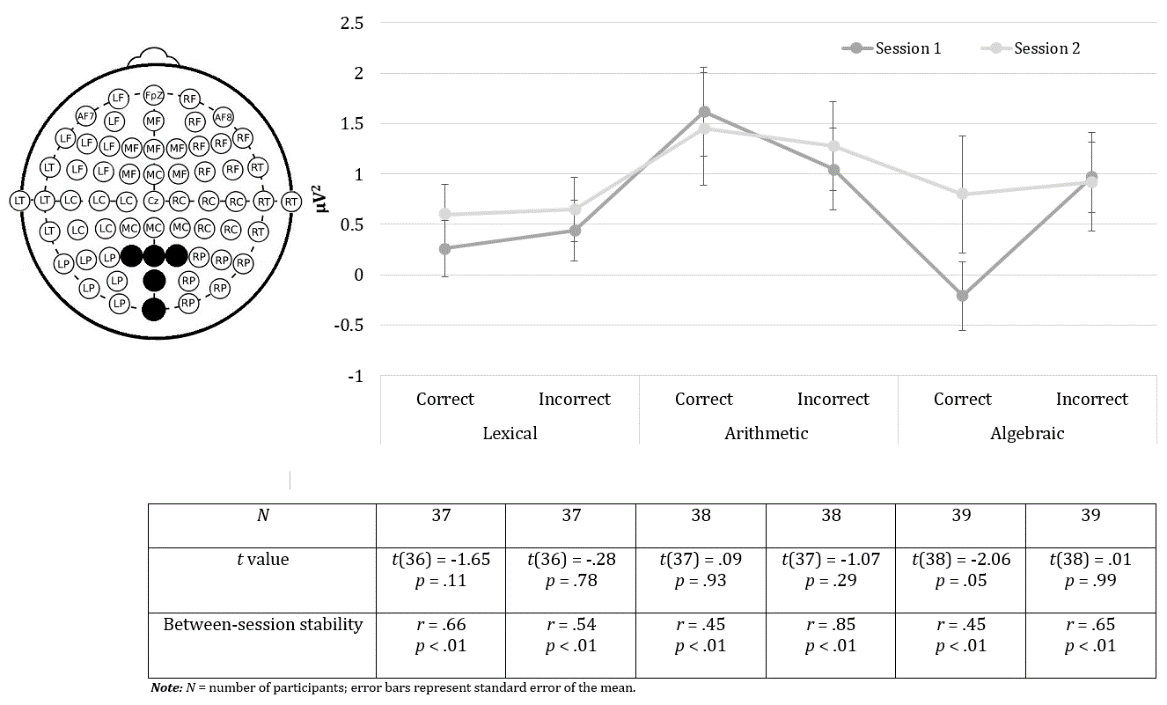
Task-locked P600 area under the curve (AUC)
The between-session mean level differences yielded non-significant results across all task conditions, except for the correct algebraic task presentation, where the mean comparison showed marginally significant differences in P600 AUC at
Conclusion
The aim of the present study was to investigate the stability of several measures on behavioural and neurophysiological levels in a novel paradigm which included lexical, arithmetic, and algebraic tasks performance and cueing. This study showed that accuracies, reaction times, and two ERP components recorded during performance on three tasks in healthy young adults were overall stable between sessions. Average between-session stability, in which the test-retest interval was approximately two weeks, was between .29 and .69 for accuracies, between .48 and .81 for reaction times, between .70 and .89 for P300, and between .45 and .85 for P600. Our data showed that behavioural measures (accuracies and reaction times) generally demonstrated lower stability than did the cue- or task-related ERPs.
Lower stability estimates for behavioral measures are likely to reflect the ceiling effect in the accuracies and the very short reaction times. However, the scope of these effects differed across the task types. On average, participants responded with almost 100% accuracy in the lexical task, but producing more errors as the task difficulty increased from lexical, through arithmetic, to algebraic task. This difference in complexity was somewhat reflected in the pattern of stability distribution: correlation coefficients between sessions increased from easier to more complex task for both correct and incorrect conditions. Reaction times proved as being a more stable measure and might be used as a measure of performance in a presence of ceiling effect in accuracy.
With regards to the ERP components, the high stability estimates are in line with previously reported stability for cognitive P600 associated with exposure to cognitive load (Borghans & Prince, 2013). Our data showed that this component was highly stable during the exposure to all tasks, but did not show the same pattern of stability estimates as was shown by behavioural measures. The P600 measured at the mid-parietal area was overall higher at the exposure to arithmetic task than to the lexical or algebraic tasks. However, stability measures for this component showed mixed pattern, with the highest stability at the exposure to the incorrect arithmetic task (
The study also shows that emotional P300 components, associated with cueing, might be as reliable as a cognitive P300 elicited by Oddball paradigm (see Cassidy et al., 2012, who showed a reliability of 0.77 for this component). The somewhat higher stability indices in cue-locked P300 than in task-locked P600 are likely due to larger variation in cognitive resources allocation in exposure to actual task rather than to merely being cued. Another explanation might be the fact, that the P300 is one of the most stable ERP components related to reactivity (Cassidy et al., 2012) and is considered to be as reliable as in clinical models (Polich & Herbst, 2000). One of the advantages of integrating a cue into the paradigm is having a scalp-level index of anticipatory reactivity. This could have potential benefits for investigating anticipatory anxiety (Boehme, Ritter, Tefikow, et al., 2014) or more specifically, maths anxiety (Lyons & Beilock, 2012b). Studies have shown that individuals high in maths anxiety have more of an emotional response when the upcoming task is related to maths than non-maths tasks (Suárez-Pellicioni, Núñez-Peña, & Colomé, 2015).
The present study has certain limitations. For example, the reliability of ERPs was assessed using area under the curve from electrodes grouped into 11 scalp areas, with statistical comparisons performed at mid-parietal (MP) area, where the P300 and P600 components were maximal. The ERP measurement approach in the current study was dictated by the very large heterogeneity in the ERP components across the entire scalp and the stimuli eliciting atypical averaged waveforms in some participants, which was evident from visual inspection. Therefore, the use of electrode grouping could be justified in this case, and has been employed in many other studies (e.g. Salti, Bar-Haim, & Lamy, 2012; or Tsai, Savostyanov, Wu et al., 2013). Another limitation is that the MP area is likely to be more affected by muscle contamination than more central or frontal sites, with ERPs in this area possibly distorted by large scalp muscles. Thus, to obtain more reliable measurements, approaches other than ERPs could be explored further.
Despite limitations, this study has shown that under certain cueing and task exposure conditions, the behavioural and, in particular, ERP indicators show overall good reliability. These findings suggest that these measures are suitable for investigating processing and performance in maths vs. non-maths tasks.
Acknowledgments
This work is supported by the Ministry of Education and Science of the Russian Federation within the project No. 25.8566.2017/9.10
References
- Bar-Haim, Y., Lamy, D., Pergamin, L., Bakermans-Kranenburg, M. J., & van Ijzendoorn, M. H. (2007). Threat-related attentional bias in anxious and nonanxious individuals: A meta-analytic study. Psychological Bulletin, 133(1), 1-24. http://dx.doi.org/10.1037/0033-2909.133.1.1
- Boehme, S., Ritter, V., Tefikow, S., Stangier, U., Strauss, B., Miltner, W. H. R., & Straube, T. (2014). Brain activation during anticipatory anxiety in social anxiety disorder. Social Cognitive and Affective Neuroscience, 9(9), 1413-1418. http://doi.org/10.1093/scan/nst129
- Borghans, L., & Prince, M. (2013). The stability of memory performance using an adapted version of the Delayed Matching To Sample task: An ERP study. Maastricht Student Journal of Psychology and Neuroscience, 1, 9-18.
- Bornkessel-Schlesewsky, F., Kretzschmar, S., Tune, S., Wang, L., Genç, S., Philipp, M., Roehm, D., & Schlesewsky, M. (2011). Think globally: Cross-linguistic variation in electrophysiological activity during sentence comprehension. Brain and Language, 117(3), 133-52. https://doi.org/10.1016/j.bandl.2010.09.010.
- Brouwer, H., Fitz, H., & Hoeks, J. (2012). Getting real about Semantic Illusions: Rethinking the functional role of the P600 in language comprehension. Brain Research, 1446, 127-143. https://doi.org/10.1016/j.brainres.2012.01.055.
- Cassidy, S. M., Robertson, I. H., & O'Connell, R. G. (2012). Retest reliability of event‐related potentials: Evidence from a variety of paradigms. Psychophysiology, 49(5), 659-664. https://doi.org/10.1111/j.1469-8986.2011.01349.x
- Cuthbert, B. N., Schupp, H. T., Bradley, M. M., Birbaumer, N., & Lang, P. J. (2000). Brain potentials in affective picture processing: covariation with autonomic arousal and affective report. Biological psychology, 52(2), 95-111.
- Fabiani, M., Gratton, G., Karis, D., & Donchin, E. (1987). Definition, identification, and reliability of measurement of the P300 component of the event-related brain potential. Advances in Psychophysiology, 2(1), 1-78.
- Finke, M., Escera, C., & Barceló, F. (2012). The effects of foreknowledge and task-set shifting as mirrored in cue-and target-locked event-related potentials. PLOS ONE, 7(11), e49486. https://doi.org/10.1371/journal.pone.0049486
- Gray, H.M., Ambady, N., Lowenthal, W.T., & Deldin, P. (2004). P300 as an index of attention to self-relevant stimuli. Journal of Experiment and Social Psychology, 40(2), 216-224. https://doi.org/10.1016/S0022-1031(03)00092-1
- Guo, C., Duan, L., Li, W., & Paller, K.A. (2006) Distinguishing source memory and item memory: Brain potentials at encoding and retrieval. Brain Research, 1118(1), 142-154. doi: 10.1016/j.brainres.2006.08.034
- Hajcak, G., & Olvet, D. M. (2008). The persistence of attention to emotion: Brain potentials during and after picture presentation. Emotion, 8(2), 250-255. https://doi.org/10.1037/1528-3542.8.2.250
- Keil, A., Bradley, M. M., Hauk, O., Rockstroh, B., Elbert, T., & Lang, P. J. (2002). Large scale neural correlates of affective picture processing. Psychophysiology,39(5), 641-649.
- Kovas, Y., Galajinsky, E. V., Boivin, M., Harold, G. T., Jones, A., Lemelin, J. P., ... & Zhou, X. (2013). The Russian School Twin Registry (RSTR): Project PROGRESS. Twin Research and Human Genetics, 16(1), 126-133. https://doi.org/10.1017/thg.2012.133
- Luck, S. J. (2005). Ten simple rules for designing ERP experiments. Event-related potentials: A methods handbook. MIT Press.
- Luck, S. J. (2014). An introduction to the event-related potential technique. MIT press.
- Luck, S. J., & Kappenman, E. S. (Eds.). (2011). The Oxford handbook of event-related potential components. Oxford University Press.
- Lyons, I. M., & Beilock, S. L. (2012a). Maths anxiety: Separating the maths from the anxiety. Cerebral Cortex, 22(9), 2102-2110. doi: 10.1093/cercor/bhr289. Epub 2011 Oct 20
- Lyons, I. M., & Beilock, S. L. (2012b). When math hurts: Math anxiety predicts pain network activation in anticipation of doing math. PLOS ONE, 7(10), https://doi.org/10.1371/journal.pone.0048076
- Núñez-Peña, M. I., & Honrubia-Serrano, M. L. (2004). P600 related to rule violation in an arithmetic task. Cognitive Brain Research, 18(2), 130-141. https://doi.org/10.1016/j.cogbrainres.2003.09.010
- Organisation for Economic Co-operation and Development (2013). PISA 2012 assessment and analytical framework: Maths, reading science, problem solving and financial literacy. Paris: OECD Publishing.
- Osterhout, L., & Holcomb, P. J. (1993). Event-related brain potentials elicited by syntactic anomaly. Journal of Memory and Language, 31(6), 785-806. https://doi.org/10.1016/0749-596X(92)90039-Z
- Pelosi, L., Holly, M., Slade, T., Hayward, M., Barrett, G., & Blumhardt, L. D. (1992). Wave form variations in auditory event-related potentials evoked by a memory-scanning task and their relationship with tests of intellectual function. Electroencephalography and Clinical Neurophysiology/Evoked Potentials Section, 84(4), 344-352. https://doi.org/10.1016/0168-5597(92)90087-R
- Polich, J. (2007). Updating P300: An integrative theory of P3a and P3b. Clinical Neurophysiology, 118(10), 2128-2148. https://doi.org/10.1016/j.clinph.2007.04.019
- Polich, J., & Herbst, K., (2000). P300 as a clinical assay: Rationale, evaluation, and findings. International Journal of Psychophysiology, 38(1), 3-19. https://doi.org/10.1016/S0167-8760(00)00127-6
- Salti, M., Bar-Haim, Y., & Lamy, D. (2012). The P3 component of the ERP reflects conscious perception, not confidence. Consciousness and Cognition, 21(2), 961-968. https://doi.org/10.1016/j.concog.2012.01.012
- Segalowitz, S. J., & Barnes, K. L. (1993). The reliability of ERP components in the auditory oddball paradigm. Psychophysiology, 30(5), 451-459.
- Suárez-Pellicioni, M., Núñez-Peña, M. I., & Colomé, À. (2015). Attentional bias in high math-anxious individuals: Evidence from an emotional Stroop task. Frontiers in Psychology, 6, 1577. http://doi.org/10.3389/fpsyg.2015.01577
- Suárez-Pellicioni, M., Núñez-Peña, M.I., & Colomé, À. (2016). Math anxiety: A review of its cognitive consequences, psychophysiological correlates, and brain bases. Cognitive, Affective, & Behavioural Neuroscience, 16(1), 3-22. https://doi.org/10.3758/s13415-015-0370-7
- Swaab, T. Y., Ledoux, K., Camblin, C. C., & Boudewyn (2012). Language-related ERP components. In Luck, S. J. & Kappenman, E. S. (Eds.), The Oxford handbook of event related potential components (397-439). New York, NY: Oxford University Press.
- Tabachnick, B. G., & Fidell, L. S. (2007). Using Multivariate Statistics (5th ed.). New York: Allyn and Bacon.
- Taylor‐Colls, S., & Pasco Fearon, R. M. (2015). The effects of parental behavior on infants' neural processing of emotion expressions. Child Development, 86(3), 877-888. https://doi.org/10.1111/cdev.12348
- Tsai, A., Savostyanov, A., Wu, A., Evans, J., Chien, V., Yang, H.H., Yang, D.Y., & Liou, M. (2013). Recognizing syntactic errors in Chinese and English sentences: Brain electrical activity in Asperger's syndrome. Research in Autism Spectrum Disorders, 7(7), 889-905. https://doi.org/10.1016/j.rasd.2013.02.001
- Walhovd, K. B., & Fjell, A. M. (2002). One-year test-retest reliability of auditory ERPs in young and old adults. International Journal of Psychophysiology, 46(1), 29-40. https://doi.org/10.1016/S0167-8760(02)00039-9
Copyright information

This work is licensed under a Creative Commons Attribution-NonCommercial-NoDerivatives 4.0 International License.
About this article
Publication Date
23 November 2018
Article Doi
eBook ISBN
978-1-80296-048-8
Publisher
Future Academy
Volume
49
Print ISBN (optional)
-
Edition Number
1st Edition
Pages
1-840
Subjects
Educational psychology, child psychology, developmental psychology, cognitive psychology
Cite this article as:
Bloniewski, T., Likhanov, M., Khuc, J., Budakova, A., Kovas, Y., & Zakharov, I. (2018). Test-Retest Reliability Of Behavioural And Erp Measures In Maths-Related Processing. In S. Malykh, & E. Nikulchev (Eds.), Psychology and Education - ICPE 2018, vol 49. European Proceedings of Social and Behavioural Sciences (pp. 113-124). Future Academy. https://doi.org/10.15405/epsbs.2018.11.02.13