Test-Retest Reliability Of Behavioural And Erp Measures In Maths-Related Processing
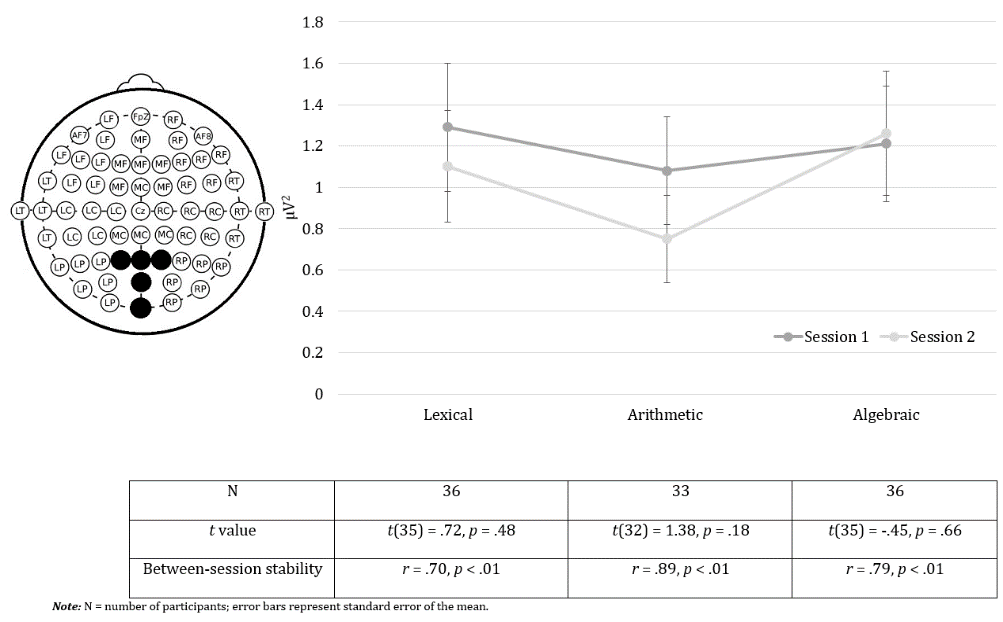
Figure 5: Area under the P300 curve at MP across three cues. The error bars represent standard error of the mean. Graph to the left shows electrodes included as a part of MP area.