
Migration And Welfare In The Far East


Abstract
This study analyzes the problem of negative migration flows of the Far Eastern Region as one of the main components of the welfare of the population. The aim of the study is to construct an econometric model describing the correlation between the productive and factor characteristics, which will be of practical importance for the compilation and adjustment of state programs for the development of the Far Eastern Region. The hypothesis of the study is the assertion that the following indicators influence the emigration flows: the volume of industrial production, its rise or decline and the volume of shipped goods of its own production related to manufacturing industries. Therefore, the study reveals factors influencing the high level of emigration flows from the Far Eastern Region. Multilevel factorial regression analysis is performed. The analysis shows that with the state policy unchanged in relation to the increase in living standards and welfare of the Far Eastern Region, migration to other regions of the Russian Federation will exceed 100 thousand people by 2020, which is a critical mark for the region. Thus, recommendations are given on the use of the model in drawing up federal programs to increase the welfare of the Far East.
Keywords: Welfaremigrationthe Far Eastregression analysisfactor analysis
Introduction
The level of welfare of the population of the country is a consolidated component, including various influencing factors. These factors concern different aspects of the life of the population. The change and maintenance of the level of well-being at the required level implies impact at all levels. One of these levels is the sphere of economic regulation. In turn, economic programs to maintain the level of the well-being of the population are an internal policy to improve the most important economic indicators. One of such indicators is the uniformity of the development of the regions of the country.
It is known that the Russian Federation is characterized by uneven development of the regions. In particular, the Far East is an acute problem, which is supported by a number of state programs. However, the problem of a high degree of emigration flows remains the most acute. However, this region is relatively unattractive in comparison with other regions of the country. As a consequence, it is important to understand the migration problem and to justify the methods of solving its solution.
Problem Statement
Due to the fact that the fundamental problem of the backward development of the Far East is a significant disproportion between the state program for the economic development of the Far Eastern Region and limited labour resources, an important task is the suspension of accelerating emigration flows and the involvement of specialists in the region. It is migration flows, in particular negative ones, which can provoke a negative impact of this phenomenon on the welfare of the population of the region. This study assumes a regression analysis of the impact of emigration processes on the welfare of the region. For the analysis of the economic situation in the Far Eastern Region, the aggregated data of nine constituent entities for the period 2000-2014 were taken.
Research Questions
n the framework of this study, it is proposed to answer the following questions:
Prove and justify the negative impact of positive emigration flows from the Far Eastern Region,
Identify the most significant factors that affect the emigration and welfare of the regions of the Far East, conduct a factorial multi-level analysis,
To build a model for changing the index of industrial production, taking into account the depreciation of fixed assets and the number of credit institutions,
To build a model for changing exports from the region, taking into account the degree of depreciation of fixed assets and the number of scientific personnel,
Combine the two models in one, which will describe the growth of migration flows, depending on the changes in the value of fixed assets, credit institutions and the number of scientific personnel,
To determine the possibilities of using this model for further application in drawing up federal programs to increase the welfare of the population.
Purpose of the Study
The aim of the study is to construct an econometric model describing the correlation between the productive and factor characteristics, which will be of practical importance for the compilation and adjustment of state programs for the development of the Far Eastern Region.
Research Methods
During the research, the following analysis methods were used: comparison, regression analysis, synthesis and statistical method.
Findings
The hypothesis of the study is the assertion that the following indicators influence the emigration flows: the volume of industrial production, its rise or decline and the volume of shipped goods of its own production related to manufacturing industries.
Analysis of industrial production index
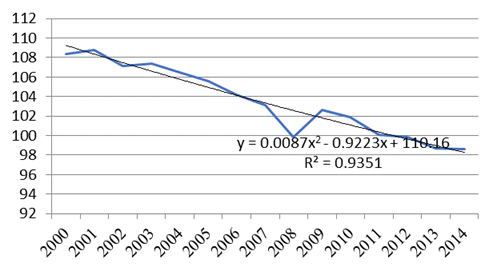
The volume of industrial production is affected by indicators of the degree of depreciation of fixed assets and the number of credit organizations in the region (Aksyonova & Barysheva, 2016). For calculation, depreciation rates of fixed assets in the construction industry were taken as the most in need of updating in comparison with other branches of production. Also, the volume of industrial production is affected by investment policy, namely, the creditworthiness of the population of the Far Eastern Region (Silifonova et al., 2017). Over the past 15 years, due to the steady decline in the number of credit institutions, the availability of cash for the population is declining. The dynamics of the above indicators are shown in Table
When regression analysis is carried out, the P-value (probability of error) of the depreciation ratio is close to 5%, the number of credit institutions is less than 2%, which indicates the sufficient reliability of the obtained model. The R-square (the coefficient of determination) is 96.9%. The results of the regression analysis are presented in Table
,
Where – industrial production index,
– degree of depreciation of fixed assets in the construction industry in the Far Eastern Region,
– number of credit institutions in the Far Eastern Region.
Figure
with an accuracy level of 93.5%. With the help of this equation, the predicted values of the industrial production index until 2020 are calculated.
The volume of shipped goods of own production in manufacturing industries
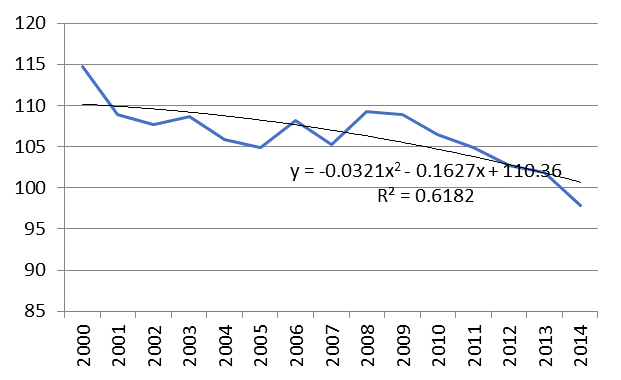
Regression analysis of the exported goods of manufacturing industries in the Far Eastern Region shows that this indicator is a dependent value of the number of scientific personnel in the region and the degree of depreciation of fixed assets for mining (Barsukov, 2015).
The increase of human potential, understood as a set of abilities and opportunities for the performance of a certain type of labour activity, is now an unconditional factor in increasing the competitiveness of products and services (Iremadze & Kulinich, 2013). The knowledge applied by producers of goods obtained in scientific fields allows manufacturers to use effective means of organizing production. Increasing exports of goods from the region presupposes a stable variability of highly developed industries, which in turn generates the need for continuous improvement of the skills of workers. At the same time, the scientific personnel is the mechanism for the formation of innovative potential in the region to increase the competitiveness of exported goods (Barysheva et al., 2016).
The state of the processing industries depends not only on the state of fixed assets in this sector (this indicator has already been taken into account in analyzing the index of industrial production). The efficiency and degree of development of the manufacturing industry is directly proportional to the position of the production of minerals (Ronova & Yakovlev, 2011). When the goods with high added value pass through the full technological cycle, the intermediate phase is the extraction of raw materials. Therefore, the productivity of products, their uniqueness and competitiveness, and therefore, the volume of their exports to other regions and beyond the Russian Federation, directly depends on the state of fixed assets in the extractive industries. In this case, this indicator is the degree of depreciation of fixed assets.The dynamics of the indicators used in the analysis is presented in Table
When carrying out the regression analysis, the P-value (probability of error) of depreciation of fixed assets is 0.3%, the number of scientific personnel is 0.04%, which indicates the high reliability of the model obtained. The R-square (the coefficient of determination) is 68.2%. The results of the regression analysis are presented in Table
where – industrial production index,
– degree of depreciation of fixed assets in the construction industry in the Far Eastern Region,
– number of credit institutions in the Far Eastern Region.
Figure
with a level of accuracy of 61,8%. With the help of this equation, the forecasted values of the growth rates of the shipped goods of own production until 2020 are calculated.
Analysis of the level of migration from the Far Eastern Region to other regions of the Russian Federation
The analysis of the industrial production index is due to the fact that it reflects a change in the real level of production in the Far Eastern Region, in contrast to the domestic regional product discounted to the level of inflation. Due to the fact that there is a significant disproportion between the statistical data of the consumer price index and the opinions of people living in the given territory, there can be doubts about the reliability of the inflation indicator (Kundakchyan & Zulfakarova, 2013).
The volume of industrial production is an indicator of the standard of living in the region due to the fact that it is a derivative of the level of incomes of the population, the number of jobs, social payments due to changes in tax revenues (Tchigirinskaya, Tchigirinsky & Chesnokov, 2015). Thus, the increase in migration flows to the western regions of the Russian Federation is due to a slowdown in the dynamics of industrial production.
The volume of shipped goods of its own production affects the welfare of the population and emigration flows through capital inflows from export transactions. Inflow of capital promotes increase of investment activity of the population (Masaya & Atsushi, 2014). According to the law of diminishing marginal return on capital (Chicherina & Tolkacheva, 2017), the Far East as an underdeveloped region will bring a greater return on investment than a more developed region, which will have a beneficial effect on the economy of the Russian Federation as a whole (Platonova & Panina, 2015).
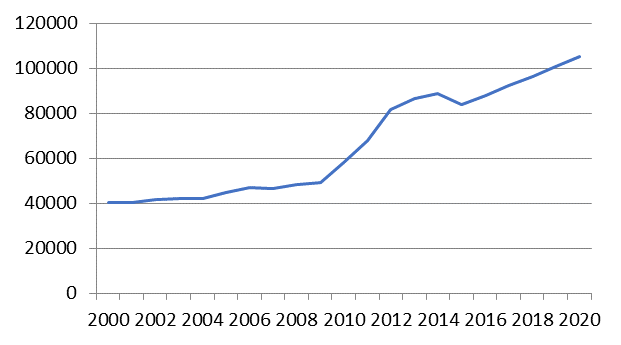
Over the past 15 years there has been a steady positive dynamics of migration from the Far Eastern Region to other regions of the country. Table
In the regression analysis, the P-value (probability of error) of the industrial production index is 0.8%, the growth rate of the volume of shipped goods of own production by processing industries is 2.3%, which indicates the high reliability of the model obtained. R-square (coefficient of determination) is equal to 80.9%. The results of the regression analysis are presented in Table
Where – migration to other regions of the Russian Federation, persons,
– the index of industrial production,
– the rate of growth in the volume of shipped goods of own production by processing industries.
Using formula (3), using the obtained predictive data of factor characteristics, we calculate the migration rates from the Far Eastern Region to other regions until 2020. The dynamics of migration flows with the current economic situation of the Far East is presented in Figure
The analysis shows that with the state policy unchanged in relation to the increase in living standards and welfare of the Far Eastern Region, migration to other regions of the Russian Federation will exceed 100 thousand people by 2020, which is a critical mark for the region.
Dynamics of changes in the growth rates of shipped goods of own production in processing industries and the trend in the Far Eastern Region.
Conclusion
The study of migration processes from the Far Eastern Region to other regions of the Russian Federation is not perfect because in this econometric model. There is a breakdown of factor characteristics into additional dependent quantities. In this case, such a need is that the number of elements of the time series must exceed the number of factor attributes by a factor of 7-8.
However, due to the limited availability of statistical data (since 2000), it is impossible to build a single model with many factors. At the same time, this approach makes it possible to compile and adjust state programs to support the Far Eastern Region, numerically determine by what levers it is possible to most effectively influence the level of migration flows from the region.
References
- Aksyonova, Y.V. & Barysheva, G.A. (2016). The Optimum Ratio of Risk and Return Accrued Pension Funds as a Factor of Influence on the Well-Being of the Older Generation. The European Proceedings of Social and Behavioural Sciences, 7, 366-375.
- Barsukov, V.N. (2015). On the question of raising the retirement age in Russia. Problems of development of the territory, 5(79), 111-124.
- Barysheva, G.A., Filippova, T.V., Baryshev, A.A., Aksyonova, Y.V. (2016). Modelling Regional Elderly Employment Due to Seasonal Fluctuation in Tomsk Region. Proceedings IBIMA, 7, 3738-3746.
- Chicherina, N.V. & Tolkacheva, V.A. (2017) Cultural Memory as a Basis of the Social Wellbeing [Electronic resource]. The European Proceedings of Social & Behavioral Sciences (EpSBS),19, 683-687. Retrieved from http://dx.doi.org/10.15405/epsbs.2017.01.90
- Iremadze, E.O. & Kulinich, O.V. (2013). The econometric model of the Russian economy. . In : Applied Sciences in Europe: tendencies of contemporary development 1st International Scientific Conference (Vol. 1, pp. 236-241). Hosted by the ORT Publishing and The Centre For Social and Political Studies "Premier".
- Kundakchyan, R.M. & Zulfakarova, L.F. (2013). Econometric modelling of performance indicators of the companies. World Applied Sciences Journal, 10, 1307-1311.
- Masaya, Y & Atsushi, M. (2014). Fertility rate and child care policies in a pension system. Economic Analysis and Policy, 44(1), 122-127.
- Platonova, I.V. & Panina, M.G. (2015). An econometric model of the Russian Federation in terms of quality of life. Bulletin of the Moscow City Pedagogical University, 1, 58-70.
- Ronova, G.N. & Yakovlev, A.Y. (2011) Pension funds, insurance companies and individuals as potential investors are infrastructure funds in Russia. Economics, Statistics and Informatics, 2, 112-117.
- Silifonova, E., Dukart, S., Korneva, O., Baev, A., Tchaikovskaya, O. N., & Bastida, J. (2017). Assessment of Economic Development Level as the Basis to Analyze Society Welfare, European Proceedings of Social and Behavioural Sciences, 19, 632-637. DOI: 10.15405/epsbs.2017.01.84
- Tchigirinskaya, N.V., Tchigirinsky, Ju.L. & Chesnokov, O.C. (2015). Spreadsheet as tool for econometric modelling. SWorldJournal, 1(8), 101-105.
Copyright information

This work is licensed under a Creative Commons Attribution-NonCommercial-NoDerivatives 4.0 International License.
About this article
Publication Date
16 April 2018
Article Doi
eBook ISBN
978-1-80296-037-2
Publisher
Future Academy
Volume
38
Print ISBN (optional)
-
Edition Number
1st Edition
Pages
1-509
Subjects
Social welfare, social services, personal health, public health
Cite this article as:
Aksenova, Y. V., Dukart, S. A., Borisova, L. M., & Anikina, E. (2018). Migration And Welfare In The Far East. In F. Casati, G. А. Barysheva, & W. Krieger (Eds.), Lifelong Wellbeing in the World - WELLSO 2017, vol 38. European Proceedings of Social and Behavioural Sciences (pp. 8-18). Future Academy. https://doi.org/10.15405/epsbs.2018.04.2