
Does Enhancing Visual Perception in Mild Intellectually Disabled Children transfer to other skills?


Abstract
This work examines the effectiveness of two training programs (teacher-assisted versus computer-based) to enhance the visual perception of mild intellectually disabled children native Arabic children in Egypt. Subjects were randomly assigned to three groups: control group with treatment as usual (n=12), traditional/teacher-assisted training (n=12) and a computerized training (n=12). Groups were matched for socio-demographic variables controlling for age, gender, and the education of parents. The success of the different training procedures was evaluated by Frosting Developmental Test of Visual Perception and its transfer to other skills in the same modality (List of Reading Readiness Skills) and general improvement in cognitive abilities (The Stanford-Binet Test). Both programs significantly improved performances of the experimental groups compared to the control group. Yet, no significant differences were found between the two active training groups, suggesting that a computerized trainings may be an option to assist challenged children, particularly when there are no specialized teachers available for the highly time consuming trainings. These findings are discussed in terms of neurological plasticity as well as recommendations for integrated training programs.
Keywords: Visualtrainingmild retardationreadingIQ
Introduction
Mental dysfunctions may be aggravated by impaired perceptual functions such as problems in visual discrimination, especially during decisive developmental periods. Comparing normally developing children to intellectually disabled children showed that the latter were significantly more limited in their production of perceptual skills. To illustrate, they perform significantly worse in tasks of visual perception, motor-visual co-ordination, fine motor skills, visual memory and in visual matching and visual discrimination subtests (e.g., Aki & Atasavun, 2008). Substantial evidence indicates that deficient visual perceptual skills in intellectually disabled children could be enhanced by teacher-assisted training programs (Rice, 1967; Silverstein, 1964) and, later, by a computerized training (Fox, 1998; Lynch, 2002; Moreno& Saldan, 2005).
While traditional training procedures require significant human resources, more computer softwares have been developed to both assess and enhance perceptual deficiencies (Hall& Cope, 1995; Tam et al., 2005). For instance, Bice (1995), Green (1995), and Loar (1992) pointed out that, using computers as an instructional tool sustains the attention of children and provides both consistent auditory and visual reinforcement. In a recent study, Poon, Li-Tsang, Weiss & Rosenblum (2010) showed that visual perception and visual-motor integration computerized training appeared to be effective in improving the handwriting in children with respective motor difficulties. Computerized training programs provide not only cognitive and perceptual training especially for visual, auditory and motor difficulties, but may be designed to present immediate and highly contingent visual or auditory feedback (Cardona, Martinez, & Hinojosa, 2000; Li-Tsang et al., 2005), a type of reinforcement that may be particularly beneficial for the young or challenged. In addition, it has been argued that computerized intervention programs may reduce cognitive deficits (Lynch, 2002; Tam. et al., 2005) and stimulate neuroplastic modifications that – if the right software is employed - can be adaptive.
In the current study, two training programs (teacher assisted × computerized) were used to enhance the visual perception of mild intellectually disabled children. Also, the potential transfer of the training to other skills from the same modality was investigated. While evidence showed mentally handicapped have deficiencies in visually perceptual processes, the effectiveness of training programs to enhance these deficiencies remains under-explored.
Research Questions
1- What is the effect of two different training programs on the visual perception skills of the mild intellectually disabled children?
2- Could the training be transferred to other skills in the same modality?
Purpose of the Study
The purpose of this study was to examine the effectiveness of using two different training programs, namely a computerized and a teacher-assisted in enhancing the visual perception of educable mentally retarded children.
Research Methods
4.1 Participants
Altogether 50 mild intellectually disabled Arabic-speaking children who were enrolled in the Mental-
Retarded schooll in The New Valley, Egypt were recruited for the current study. Individually tailored information was given to the children who all agreed to participate. Moreover, the informed consent was given by their caregivers and the study was approved by the board of the school. Out of 50, fourteen children were excluded as their level of functioning was too low to allow the completion of the diagnostic testing. Eligible participants were then grouped in twelve triplets, matched for socio-demographic variables. The subjects of each triplet were then randomly assigned to one of three groups: control with treatment as usual, traditional training and computerized training. Altogether, thirty six children formed the final sample [83% male, mean chronological age (CA) = 10.24 ± 1.18 SD, mean mental age (MA) = 5.96 ±.76 SD years]. Table
4.2 Measures
In order to test and compare the success of the different training procedures, tests were chosen, that specifically assessed the abilities related to the training (Frosting Developmental Test of Visual Perception) and its transfer to other skills in the same modality (List of Reading Readiness Skills) and general improvement in cognitive abilities (Stanford-Binet Intelligence Scale).
4.2.1. Frostig Developmental Test of Visual Perception
The Frostig et al.’s (1963) Developmental Test of Visual Perception (DTVP) is a test designed to assess visual perceptual skills in children aged 3-9 years. It provides information that includes 1) an estimation of the overall visual perception ability of the child and 2) a delimitation of the distinct visual perception difficulties in need of training. The five DTVP subtests are presumed to measure five distinct subareas of visual perception: Eye Motor Coordination, Figure Ground, Constancy of Shape, Position in Space, and Spatial Relationships. Raw scores are obtained for each of the subtests and then converted to Age Equivalents or Perceptual Ages (PAs) and Scale Scores (SSs). The total test results are expressed in Perceptual Quotient (PQ) and percentile rank (Kamel, 2001). In the current study, the Arabic version, which was standardized by Kamel (2001), was administered to provide norms for the Egyptian community. Cronbach-alpha and Half-Split reliability coefficients were .82 and .67 for the whole test, respectively. Further, the test proved to be valid using the internal consistency method. Validity coefficients were .92 , .95, .90, .72, .58 for Eye Motor Coordination, Figure Ground, Constancy of Shape, Position in Space, and Spatial Relationships, respectively (p<0.01) (Kamel, 2001).
4.2.2 List of Reading Readiness Skills
The list was prepared by Al-Tahan (2003) to assess the reading readiness of pre-schoolers and early primary graders. The list comprised seven skills: visual discrimination, auditory discrimination, visual-auditory discrimination, visual memory, speech and articulation, language and experience and motor coordination. The list has been validated for its psychometric properties. For reliability, Cronbach’s Alpha was computed and values were: .54, .58, .63, .64, .61, .52, .63 for the visual perception, auditory discrimination, visual-auditory discrimination, visual memory, speech and articulation, language and experience and motor coordination, respectively. For the whole list, Cronbach’s Alpha was (r= .68). All values of coefficients were significant (p<.01). In addition, validity coefficients between each subscale and the total score of the whole list were also calculated and values were: .65, .74, .56, .63, .56, .72, .68 for the visual perception, auditory discrimination, visual-auditory discrimination, visual memory, speech and articulation, language and experience and motor coordination, respectively. All values of coefficients were significant (p<.01) showing high internal consistency of the list.
4.2.3 Stanford-Binet Intelligence Scale (fourth edition)
The scale was constructed as a standardized test that assesses IQ and cognitive abilities in children and adults aged 2 to 23 years. The Arabic version of the test was standardized by Melika (1998) to provide norms for the Egyptian community. The test comprised 15 sub-tests including, vocabulary, comprehension, verbal absurdities, pattern analysis, matrices, paper, folding and cutting, copying, quantitative, number series, equation building, memory for sentences, memory for digits, memory for objects and bead memory. Kuder-Richardson reliability coefficient was .87 for the whole test. Further, the test proved to be valid as it showed the ability to distinguish between children with learning disabilities (mean = 97.29), poor achievers (mean= 77.76) and intellectually disabled children (mean=56.73) (Melika, 1998).
4.3 Administration of training programs
Five teachers of the school were trained to work as facilitators for the training programs. The two programs aimed to develop visual perception either through traditional paper and pencil exercises or by a computerized training program.
4.3.1 Treatment as usual (TAU)
In the school children were offered a variety of tasks and games, but were not specifically challenged to perform distinct tasks. Nor were there sufficient resources to offer an individualized training protocol.
4.3.2 Traditional, teacher-assisted training program
The traditional program is a paper and pencil – based program which aimed to enhance the visual perception skills as defined by Frostig et al. (1963). The program includes individual training of visual-motor coordination, discrimination between shape and background, perception of shape constancy, perception of position in space and spatial relationships. Children of the traditional/teacher assisted training group received the training in 50 sessions in group format (6 children per group) stretched across 10 weeks (5 sessions per week). Sessions lasted an average of 40 minutes. The program starts with an introductory session whereby facilitators have a good rapport with the children and children get familiar with each other. The following sessions included 176 exercises that are built in terms of level of difficulty, so the program ensures that every child experiences training in his/her own pace. Children are encouraged to use color pencils while doing the exercises to keep their motivation. Further, facilitators provide feedback and reinforce correct responses by rewards and encouraging words.
4.3.3. Computerized training (InSight Brain Fitness Training - Posit Science1.1. BFT)
The Computerized training software was created by Posit Science™ (2009). According to Delahunt et al., (2008), the program has been based on scientific findings about neuroplasticity (see e.g., Buonomano& Merzenich, 1998; Elbert & Rockstroh, 2004). The program aims to speed up and sharpens the brain’s visual system by encouraging faster, clearer communication between neural representations, and trains the brain’s information processing units to take in more visual information accurately. Consequently, memory and other cognitive functions are also enhanced. Previous evidence indicated that the program was able to speed up visual processing and double the size of useful field of view and to improve brain activation in areas related to attention (Delahunt et al., 2008). The computerized training (BFT) program was used for 50 sessions (35-40 minutes each) individually across a period of 10 weeks (5 sessions per week). The program content includes five exercises/games: Bird safari, Jewel Diver, Master Gardener, Road Tour and Sweep Seeker. These exercises aim to develop visual skills as: visual accuracy, i.e. ability to accurately retrieve details of events, divide visual attention, promote working memory (visuo-spatial sketch-pad), extend the visual scope and speed up visual processing, respectively. The recommended schedule starts with one exercise and gradually builds up to 10 minutes per session in four of the five Insight exercises. A shaping procedure with increasing difficulty level ensures training at an appropriate individually determined level. Once the child improves, the task gets a little harder to push the performance to the next level (Posit Science, 2009). The setting was guaranteed to be well prepared and comforting for children. Facilitators were provided to children and two trials have been given to the children before starting the training to guarantee that children are familiar with using the computer and its accessories.
4.4 Procedure
The protocol of the study was extended across thirteen weeks as illustrated in Table
Findings
The statistical analysis was carried out using SPSS 21 and STATISTICA6 for Windows. The accuracy percentage has been calculated for each skill. A repeated measure ANOVA was, then, calculated for the skills of visual perception across time, using the general linear model with VISUAL PERCEPTION (Eye Motor Coordination, Figure Ground, Constancy of Shape, Position in Space, and Spatial Relationships.) and TIME (Pre-test, Post-test) as within factor, and GROUP (Control, traditional training, computer training) as between subjects’ factor. Bonferonni Post hoc-analyses revealed that both the traditional/teacher-assisted and the computerized training group performed significantly better than the control group in all the post-tests of visual perception skills (Bonferroni p<0.001). Further, only the teacher-assisted training group and the computer training (brain fitness program) performed significantly better in post-tests than in pre-tests (Bonferroni p<0.001), but not the control group (TAU). Interestingly, no significant differences were found between the two active training groups in any of the tests for the visual perception skills (Fig.1).
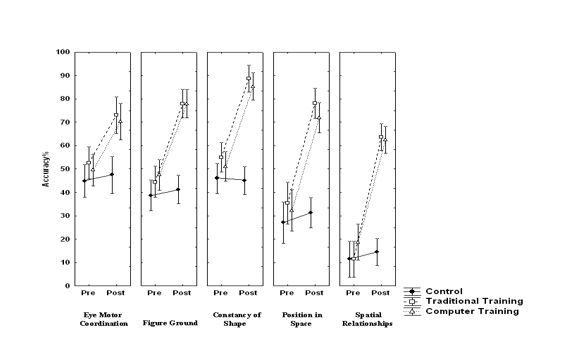
Results showed a strong and highly significant improvement of test scores across time (pre to post-training) for the two active treatment groups with little changes for the control group, which gave rise to the interaction TIME × GROUP [(F (2, 33) =158.55, p<0.001 and to a main effect for TIME (Pre-Post) [(F (1,33) =76.91, p<0.001], and GROUP [(F (2,33) =35.68, p<0.001]. The effects VISUAL PERCEPTION SKILLS [(F (4, 132) =72.99, p<0.001], TIME x VISUAL PERCEPTION SKILLS [(F (4, 132) =23.91, p<0.001], and an interaction effect of TIME x VISUAL PERCEPTION SKILLS x GROUP [(F (8, 132) =5.77, p<0.001] indicated the specificity of training.
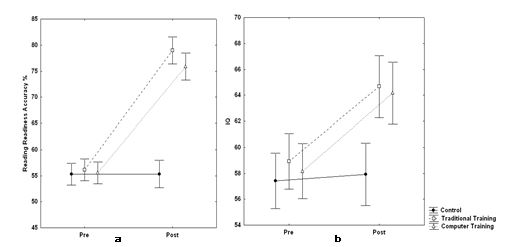
Further, a repeated measure ANOVA was calculated for Reading readiness and IQ independently across time. TIME (Pre-test, Post-test) served as within factor, while GROUP (Control, traditional training, computer training) served as the between subjects’ factor. For Reading readiness, results showed a significant effect for TIME (Pre-Post) [(F (1, 33) =359.41, p<0.001], GROUP [(F (2, 33) =46.87, p<0.001], TIME×GROUP [(F (2, 33) =90.76, p<0.001]. Bonferonni post hoc-analyses revealed that both the traditional and the computer training group significantly outperformed the treatment as usual control group in the post-tests (Bonferroni p<0.001). Again, no significant differences were found between the two active training groups in the post tests of reading readiness skills (Fig.2a). Even for IQ, results produced a significant effect for TIME (Pre-Post) [(
Moreover, correlations between the psychometric measures after the intervention in the whole cohort are presented in Table
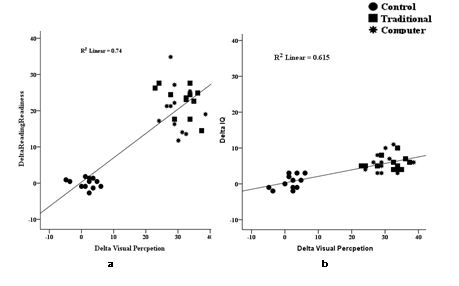
The scatter plots in Figure 3a and 3b illustrate the relation between changes of scores (Delta) in visual perception, reading readiness skills and IQ. Obviously, enhancing visual perception helps to enhance both reading readiness skills and IQ.
Finally, to investigate the long-term effects of the training program, we applied a repeated measure ANOVA for visual perception, reading readiness and IQ independently across time. TIME (Post-test, Follow- up test) served as within factor, while GROUP (traditional training, computer training) served as the between subjects’ factor. For visual perception and the list of reading readiness skills accuracy percentage has been calculated. For Reading readiness, results showed a significant effect for TIME (Pre-Post) [(
Conclusions
The present study indicates that a considerable gain in specific skills and, with it, in general functioning can be achieved in mild intellectually disabled within a limited time period of intensive training. It is noteworthy, but not too surprising that the specific skills translate into enhanced reading skills and IQ. Substantial correlations between the specialized visual tests and the more complex reading ability and IQ have been reported earlier. For example, classical studies as Allen, Haupt & Jones (1965) investigated the correlates of visual perceptual functions and the mental efficacy (IQ) in a group of educable challenged children. Results showed that those children’s scores of Wechsler’s IQ test highly correlate with their scores on the visual perception test. Also, our results go in line with Shinkfield, Sparrow & Day (1997) showing that compared to normally developing children, intellectually disabled children have difficulties in visual perception as measured by both motor reproduction and visual discrimination abilities. There is a consensus that visual perception deficits may contribute to mental retardation (Groß-Selbeck, Dietze , Mau & Gutezeit, 1974; Fidler, Most & Guiberson, 2005).
Moreover, results showed that visual perception positively correlates with reading readiness. This was previously supported by results showing that visual perception is a good predictor of children’s reading level and their readiness to read (e.g., Sortor and Kulp, 2003). Importantly, studies on Semitic scripts showed predictive correlations between both visual and verbal ability and reading. This is might be attributed to complexity of the Semitic orthographies as they demand the manipulation of visual word recognition strategies and visuo-spatial processing to manipulate changes in letter shapes in a word (Myler & Breznitz, 1998; Abu-Rabia & Taha, 2004; Mohamed, Elbert & Landerl, 2011)
The current study reveals significant and clinically substantial effects for both, the traditional, teacher-assisted and the computerized training as compared to the control group. A number of early studies showed that the traditional training may enhance visual perception skills in the intellectually disabled (Hall& Deacon, 1970; Walsh& Dangelo, 1971; Forgnone, 1976). However, others could not obtain significant benefits (Wiederholt & Hammil, 1971; Kavale, 1984). Traditional training has included various skills such as guided drawing of curved and straight lines followed by unguided drawing, colouring both figure and background, identifying similar figures recruited from real life setting of children, which accordingly contributed to enhancing visual perception skills. The outcome of the traditional training procedures may, thus, depend on the particular exercises in conjunction with the skills of the trainers to motivate the children. On the other hand, the computerized training program does not take into account the personality of the child, but consider abilities of the child. Moreover, they can be programmed to consistently reward the child in a very consistent manner. The present results confirm previous findings showing that computer based training programs could enhance visual perception skills in intellectually disabled children (Dube, Moniz& Gomes, 1995). Specifically speaking, the
Moreover, results showed that each experimental group significantly outperformed the control group in the reading readiness. These are in agreement with previous studies showing that the readiness to read could be improved by training more basic visual perception processes (Cardozo & Allen, 1975; Fidler; Most & Guiberson, 2005; Wallbrown; Wallbrown & Engin, 1974; Wiederholt & Hammill, 1971). The reading skill starts with children being attracted to visual stimuli in magazines and picture books and is developed by training the eyes to trace and recognize the sequence of words in texts. Also, developing reading readiness includes skills such as perceptual discrimination, i.e., their ability to distinguish similarities and differences between objects. These skills are to be enhanced by the processing of visual materials and visual aids. As for the traditional training program, it was based on skills as eye-hand coordination, moving from right to left, figure copying, which accordingly, contributes to the enhancement of reading readiness of the experimental group. In the computerized training, children were trained to hold the mouse, pointing to the different positions of the visual stimuli, which positively sharpened their vision scope, and helped their eyes to follow the words later from right to left which is a requisite to read the Arabic language and rapidly recognize them and this contributed to enhancing reading readiness of the experimental group.
Finally, some improvements in the trained skills were expected, its substantial size, however, demonstrates considerable potentials for improvements in disabled children. To illustrate, although the scores of the Stanford-Binet IQ increased from pre- to post-tests in both experimental groups as opposed to the control group, the scores remained still in the very low range and did not indicate a higher mental age. However, it should also be noted, that these changes were observed in response to a compact training, limited in time.
References
- Abu- Rabia, S., & Taha, H. (2004). Reading and spelling error analysis of native Arabic dyslexic readers. Reading and Writing: An Interdisciplinary Journal, 17, 651-689.
- Aki, E. & Atasavun, S. (2008). The visual perception of children with multiple handicaps. European Journal of Paediatric Neurology, 12, 59 - 60.
- Allen, R. M. , Haupt, T. D. & Jones, R. W. (1965). Visual perception abilities and intelligence in mental retardates. Journal of clinical psychology, 21 (3), 299-300.
- Al-Tahan, T. (2003). List of Reading Readiness Skill in Early Childhood. Amman, Jordon: Dar Al Fikr.
- American Psychiatric Association. (2013). Cautionary statement for forensic use of DSM-5. In Diagnostic and statistical manual of mental disorders (5th ed.). doi:
- Bice, J. E. (1995). Instructional Software and Attention Disorders: A Tool for Teachers.
- Buonomano, D. V., & Merzenich, M. M. (1998). Cortical plasticity: from synapses to maps. Annual review of neuroscience, 21(1), 149-186.
- Cardona, M. D., Martinez, A. L. & Hinojosa, J. (2000). Effectiveness of using a computer to improve attention to visual analysis activities of five preschool children with disabilities. Occupational Therapy International, 7 (1), 42–56.
- Cardozo, C. W. & Allen, R. M. (1975). Contribution of visual perceptual maturation to the ability to conserve. American Journal of Mental Deficiency, 79 (6), 701-704.
- Delahunt, P. , Hardy, J. , Brenner, D. , Chan, S. Dewey, J. A., Mahncke, H. & Merzenich, M. (2008). InSight: Scientific principles of a brain-plasticity-based visual training program. San Francisco, CA: Posit Science Corporation.
- Dube, W. W. , Moniz, D. H. & Gomes, J. F. (1995). Use of computer and teacher-delivered prompts in discrimination training with individuals who have mental retardation. American Journal on Mental Retardation, 100 (3), 253-261.
- Elbert, T., & Rockstroh, B. (2004). Reorganization of human cerebral cortex: the range of changes following use and injury. The Neuroscientist, 10(2), 129-141.
- Fidler, D. J., Most, D. E., & Guiberson, M. M. (2005). Neuropsychological correlates of word identification in Down syndrome. Research in Developmental Disabilities, 26(5), 487-501.
- Forgnone, C. (1976). Effects of visual perception and language training upon certain abilities of retarded children. Education and Training of Mentally Retarded, 11 (3), 212-217.
- Fox, R. (1998). Perception, mental retardation, and intelligence. In R. Hoffman, M. Sherrick & J. Warm (Eds.) Viewing Psychology as a Whole (pp. 315-333), Washington, DC: APA Books.
- Frostig, M. & Horne, D. (1963). The Frostig program for the development of visual perception: Teacher's Guide. Chicago: Follett Publishing Company.
- Green, D. W. (1995). The Benefits of Multimedia Computer Software for Students with Disabilities.
- Groß-Selbeck, G. , Dietze, U. , Mau, G. & Gutezeit, G. (1974). Visuelle Pezeptionsstörungen bei 5-bis 7 Jährigen Kindern mit und ohne Hirnschädigung. Zeitung Kinderheilk, 117, 145-158.
- Hall, S. L. & Deacon. K. F. (1970). Effects noted from the use of the Frostig training program with trainable retardants. The Training School Bulletin, 67 (1), 20-24.
- Kavale, K. A. (1984). A meta-analytic evaluation of the Frostig test and training program. The Exceptional Child, 31 (2), 134-144.
- Kamel, M. (2001). Ikhtibar Nama’āi LIdrak Albasry[A Developmental Test of Visual Perception DTVP]. Cairo, Egypt: Anglo Bookshop.
- Li-Tsang, C. , Yeung, S. , Chan, C. & Hui-Chan, C. (2005). Factors affecting people with intellectual disabilities in learning to use computer technology. International Journal of Rehabilitation Research, 28 (2), 127-133.
- Loar, D. M. (1992). A Study of the Achievements of Pre-School, Kindergarten, First and Second Grade Children Using a Computerized Reading and Language Arts Program.
- Lundqvist, A., Grundström, K., Samuelsson, K., & Rönnberg, J. (2010). Computerized training of working memory in a group of patients suffering from acquired brain injury. Brain Injury, 24(10), 1173-1183.
- Lynch, B. (2002). Historical review of computer-assisted cognitive retraining. Journal of Head Trauma Rehabilitation, 17 (5), 446-457.
- Melika, L. (1998). The Stanford Binet Intelligence Scale: Fourth Edition: Arabic Examiner's Handbook. Cairo, Egypt: Elnhda Elarabya.
- Meyler, A., & Breznitz, Z. (1998). Developmental associations between verbal and visual short-term memory and the acquisition of decoding skill. Reading and Writing, 10(6), 519-540.
- Mohamed, W., Elbert, T., & Landerl, K. (2011). The development of reading and spelling abilities in the first 3 years of learning Arabic. Reading and Writing, 24(9), 1043-1060.
- Moreno, J. & Saldan˜a, D. (2005). Use of a computer-assisted program to improve metacognition in persons with severe intellectual disabilities. Research in Developmental Disabilities, 26, 341–357.
- Poon, K. W., Li-Tsang, C. W. P., Weiss, T. P. L., & Rosenblum, S. (2010). The effect of a computerized visual perception and visual-motor integration training program on improving Chinese handwriting of children with handwriting difficulties. Research in developmental disabilities, 31(6), 1552-1560.
- Posit Science (2009). Visual processing & memory "Insight": version 1.1, California: Posit Science Corporation.
- Rice, D. M. (1967). The effects of visual perception techniques with cerebral palsied individuals functioning at a mentally retarded level. D.A.I, 27(11-A), 3732.
- Shinkfield, A. J. , Sparrow, W. A. , Day, R. H. & Zerman, L. (1997). Visual discrimination and motor reproduction of movement by individuals with mental retardation. American Journal on Mental Retardation, 102 (2), 172-181.
- Silverstein, A. (1964). The development of visual perception in mentally retarded. California Mental Health Research Digest, 2 (4), 27-28.
- Sortor, J. M., & KULP, M. T. (2003). Are the results of the Beery-Buktenica Developmental Test of Visual-Motor Integration and its subtests related to achievement test scores? Optometry & Vision Science, 80(11), 758-763.
- Tam, S. , Man, D. W. , Chan, Y. , Sze, P. & Wong, C. (2005). Evaluation of a computer-assisted, 2-D virtual reality system for training people with intellectual disabilities on how to shop. Rehabilitation Psychology, 50 (3), 285–291.
- Wallbrown, J. D. , Wallbrown, F. H. & Engin, A. W. (1974). The relative importance of mental age and selected assessors of auditory and visual perception in metropolitan readiness test. Psychology in the School, 11 (2), 136-143.
- Walsh, J. F. & D'angelo, R. (1971). Effectiveness of the Frostig program for visual perceptual training with head start children. Perceptual and Motor Skills, 32 (3), 944-946.
- Wiederholt, J. L. & Hammil, D. D. (1971). Use of the Frostig-Horne visual perception program in the urban school. Psychology in The Schools, 8 (2), 268-274.
- World Health Organization. International Classification of Diseases, Mental and behavioral disorders. [online] version 2014 [cit. 2016-08-12]. http://apps.who.int/classifications/icd10/browse/2014/en#/F70-F79
Copyright information

This work is licensed under a Creative Commons Attribution-NonCommercial-NoDerivatives 4.0 International License.
About this article
Publication Date
22 November 2016
Article Doi
eBook ISBN
978-1-80296-015-0
Publisher
Future Academy
Volume
16
Print ISBN (optional)
-
Edition Number
1st Edition
Pages
1-919
Subjects
Education, educational psychology, counselling psychology
Cite this article as:
Elbert, T., Mohamed, W., & Teleb, A. (2016). Does Enhancing Visual Perception in Mild Intellectually Disabled Children transfer to other skills?. In Z. Bekirogullari, M. Y. Minas, & R. X. Thambusamy (Eds.), ICEEPSY 2016: Education and Educational Psychology, vol 16. European Proceedings of Social and Behavioural Sciences (pp. 391-402). Future Academy. https://doi.org/10.15405/epsbs.2016.11.41