Does Enhancing Visual Perception in Mild Intellectually Disabled Children transfer to other skills?
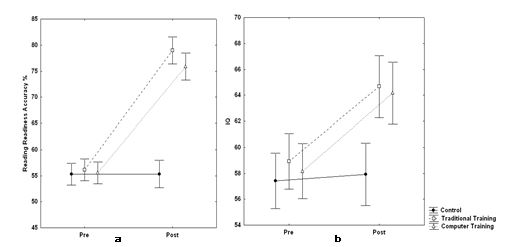
Figure 2: Accuracy % of performance in tests of reading readiness (2a) and IQ (2b) as a function of time (Pre-Post) in the three groups (n=36). Vertical bars indicate confidence intervals at 95%.