
Key Indicators for Improving the Resource Productivity in the Baltic States


Abstract
Growth of economics and population, as well as rising income and living standards, increase the global consumption of various materials, generating pressures on the natural resources and the environment. The unsustainable use of resources have led to climate change, environmental pollution and exhaustion of raw materials, which is why decoupling economic growth from environmental degradation as well as an efficient use of resources is one of the main objectives nowadays. The effectiveness with which the economy uses materials extracted from natural resources to generate economic value is described by resource productivity. Resource productivity is a problematic issue for the Baltic States as it is 1.5-3.0 times lower than the average resource productivity of all the EU. The paper analyses the tendencies of resource productivity in Estonia, Latvia and Lithuania, as well as the main factors that impact on it. The analysis includes 34 indicators related to national income and outlays for research and development, seeking to discover the factors that have the greatest influence on resource productivity. The research showed significant differences among countries, and, in turn, different means for increasing of the resource productivity should be applied. Latvia is the only country among three that has made progress in this area. Lithuania and, especially, Estonia should pay more attention to the effective use of outlays for R&D, make strict action plans, provide the list of means, and regularly check the implementation as a means of seeking to improve the resource productivity.
Keywords: Resource productivityBaltic StatesSustainable development
Introduction
Growth is considered to be one of the major driving forces of the world‘s development. But the further the more it becomes clear that a greener and more crucial model of growth must be applied in order to improve the human well-being, as the size of the world economy is expected to double and world population to increase by one-third by 2030. Growth of economics and population, as well as rising income and living standards, increases the global consumption of various materials generating pressures on natural resources and the environment. The unsustainable use of resources has resulted in the challenges we face today, i.e. the climate change, environmental pollution, ecosystem degradation and exhaustion of raw materials.
The sustainable development strategy encourages the sustainable use of resources and strengthens the synergy between environmental protection and growth. Decoupling economic growth from environmental degradation and improving resource efficiency, reducing the overall use of non-renewable natural resources, thereby using renewable resources at a rate that does not exceed their regeneration capacity are one of the main objectives worldwide (Eurostat, 2016).
The total amount of materials directly used by an economy is measured by the domestic material consumption (DMC). It is defined as the annual quantity of raw materials extracted from the domestic territory of the focal economy, plus all physical imports minus all physical exports.
The effectiveness with which an economy uses materials extracted from natural resources to generate economic value is described by the resource productivity. This indicator is defined as the ratio between gross domestic product (GDP) and domestic material consumption (DMC). The way natural resources and materials are managed and used is important not only from an environmental perspective but also from an economic perspective (OECD, 2015). Resource productivity belongs to the Sustainable Development Indicators and the Resource Efficiency Indicators set. Resource productivity provides insights into whether decoupling between the use of natural resource and economic growth is taking place.
Improving resource productivity and ensuring a sustainable resource and materials management building on the principle of the 3Rs (reduce, reuse, recycle) is a central element of green growth policy and has become a priority for governments and businesses alike. It helps to preserve the environment and sustain the economic growth by securing adequate supplies of materials and improving competitiveness (OECD, 2015).
An effective use of resources in Europe is one of the main objectives of the Europe 2020 Strategy. Each Member State has adopted its own national targets. Resource productivity is problematic subject for the Baltic States as it is 1.5-3 times lower than the average resource productivity of all EU. Resource productivity of the region was analysed by Tanning and Tanning (2014, 2015), but only trend of resource productivity was examined. Most researches analyse the impact of factors for other types of resources, mainly labour or energy (for example, Mulder, & Groot, 2007; Štreimikienė, 2016; Streimikiene et al., 2009). In general, the researches on resource productivity in the Baltic States are insufficient.
That‘s why the purpose of this research is to identify the main factors that have the impact on the resource productivity in Lithuania, Latvia and Estonia providing the proposals for improving the situation. The research is based on the analysis of the indicators that are related to outlays for research and development and national income as they are considered as the most important in the scientific literature. Research methods include scientific literature analysis, statistical data analysis, correlation analysis, Granger causality test and regression analysis.
Literature analysis
The importance of resources
Natural resources are essential for the economy and human well-being and consumption of them should not exceed sustainable levels. They provide substantial raw materials and other commodities, and are an important source of production, income and jobs. However the use of materials has environmental, economic and social consequences (OECD, 2015).
There are lots of reasons why the resource problems should be placed in a dynamic perspective. One of the main objectives of natural resource economics is to better understand the role of natural resources in the economy in order to develop more sustainable methods of managing the resources in order to ensure their availability to future generations. Current use of non-renewable resources, such as oil or gas, determines future resource availability. Renewable natural resources regenerate in a dynamic ecological process, but it can be disturbed by commercial activities. Bretschger & Smulders (2007) found that macroeconomic dynamics become highly relevant for the resource scarcity and pollution. According to the researchers, capital accumulation and technological change are essential to offset the increasing scarcity of natural resources and to promote sustainable development. In particular, the development and adoption of new technologies allow improve the efficiency of use of resources. Social dynamics are also important. The behaviour of users of natural resources and polluters, as well as policymakers, changes over time because of learning behaviour, changing perceptions, the building-up of new information, and the reaction thereupon (Bretschger, & Smulders, 2007).
2.2 The conception of productivity
In general, productivity represents the relationship between the outputs of the production system and inputs that are necessary for the creation of these outflows (Aspridis et al., 2014). In more detail productivity is represented by the rate of input production factor for the production of a product or a service, and includes four factors – resources, workers, facilities, and technology and management (Joo, 2011). Therefore, productivity can be defined as an index of the product compared with the production factors, including labor productivity and resource productivity, or as the total factor productivity that reflects all production factors. The total factor productivity can reflect all the production factors, but it makes the calculation and analysis complicated, whereas the productivity based on a single production factor cannot reflect the effects of the other factors (Lee et al., 2014).
Labor productivity is the most widely used indicator of productivity and it is the result of a system related to human resources that produce the outcomes. Labor productivity reflects the overall effect of various factors (such as physical capital, technology, human capital, organization of work and other) to the result (Aspridis et al, 2014).
Mulder and Groot (2007) investigation on the development of cross-country differences in energy and labour productivity showed that it differs and cross-country variation of productivity levels is typically larger for energy than for labour. Energy prices and wages have positive affect on energy and labour productivity growth while the investment share, openness and specialization play only a modest role in explaining cross-country variation in energy and labour productivity growth.
Labour and energy productivity was also analysed by Achour (2016), Broadstock (2016), Calcagnini et al. (2016) and others. As well, the researches on total factor productivity (Farhadi et al., 2015; Long et al., 2015, Bah, & Fang, 2015) or consumption of biomass (Bringezu, 2012), water and forests can be found. The productivity is analysed at the national level, as well as various sectors, i.e. transport, manufacture, agriculture and so on.
However, the resource productivity is becoming the core element of the total factor productivity as the cost of production can be reduced in terms of resources via process innovation and design change. Resources change into the products that have added values through the general production process. The change in resources is directly applied to the added value of the product, while the changes in other factors are indirectly applied to the changes in the added values of the products. Therefore, the most efficient productivity evaluation method is to use the resource productivity index, which means the ratio of the resource to the resulting added value (Aspridis et al, 2014).
Efforts on improving the resource productivity
A growing population is getting richer and demands more and more products which require natural resources and create various environmental impacts (Bringezu, 2011). One key strategy is resource efficiency, i.e. to make more out of less, to generate more wealth and well-being with less input of natural resources. For industry, higher material and energy efficiency is a chance to reduce costs and enhance competitiveness. The search for eco-efficient technologies is thought to trigger innovation.
Resource productivity, measured as GDP output per resource input, is a widespread sustainability indicator combining economic and environmental information. High resource productivity is interpreted as the sign of a resource-efficient, and hence more sustainable, economy (Steinberger, & Krausmann, 2010).
The researches demonstrate that resource productivity is influenced by national income and its current use tends to support a simultaneous growth in economic productivity and resource consumption. A growing number of countries have already defined targets to increase resource productivity of their economy. This is requested by the Thematic Strategy for the Sustainable Use of Natural Resources (CEC 2005). OECD Council also adopted a recommendation that encourages its members to improve resource productivity by promoting environmentally effective and economically efficient uses of natural resources and materials at the macro, sectorial and micro levels as well as to strengthen capacity for analysing material flows and the associated environmental impacts. The nowadays challenge is to create the higher value with less natural resource input, and thereby do not compromise the needs of future generations.
Bringezu et al. (2012) proposed a comprehensive approach to account for the global land use of countries for their domestic consumption, and assess this level with regard to globally acceptable levels of resource use, based on the concept of safe operating space. They showed that the European Union uses one-third more cropland than globally available on a per capita basis and that with constant consumption levels it would exceed its fair share of acceptable resource use in 2030.
Hence governments need a reference point for assessing the sustainability implications of their policies on global resource consumption. Each country must be sure that the thresholds for sustainable resource use, emissions and waste disposal are not exceeded. In reality, however, only few countries have the capacities to monitor and control their domestic resource extraction, wastes and emissions (Bringezu et al., 2012). Nevertheless EU countries are making their efforts to improve resource productivity. Domestic material consumption indicator is routinely reported by Eurostat and analysed by various researchers.
Many countries in the world joined the initiative and have included resource productivity issues in their sustainable development strategies, established programmes on sustainable production and consumption, stewardship programmes for materials and natural resources, and have introduced integrated waste and materials management policies. Business sectors address these issues by establishing stewardship programmes for materials and products, investing in R&D and using advanced technologies in order to increase materials and energy efficiency, enhancing environmental management, promoting eco-design and coherent materials supply and use systems (OECD, 2008 and 2011). Moro and Stucchi (2015) state that changes in the distribution of resources across firms can have different effects on aggregate productivity depending on the elasticity of substitution among goods.
R&D is the main source of firm absorptive capacity and therefore, along with to introduce innovation, this factor is crucial to remain close to the technological frontier (Griffith et al., 2004). The contribution of foreign R&D to productivity growth often exceeds that of domestic innovation, especially when one considers R&D performed by third countries which is (indirectly) embodied in the products of our (direct) trading partners (Lumenga-Neso et al., 2005).
Giljum et al. (2015) found that the differences in material footprints per capita are huge, ranging from up to 100 tonnes in the rich, oil-exporting countries to values as low as 1.5 to 2.0 tonnes in some developing countries. Some researches indicate that the levels of material use per capita and the composition of materials used can be quite different even among highly industrial economies of similar per capita income levels. Weisz et al. (2006) have analyzed DMC for the EU-15 countries in order to identify possible reasons for cross-country variations in the levels of material use. They found that variability of DMC is in a similar order of magnitude as the variability of GDP per capita or total primary energy supply per capita. Linear correlation analysis reveals that national income and final energy consumption relate to material use but cannot fully account for the observed differences in material consumption (Weisz et al., 2006; Kalmykova et al., 2015). Steinberger and Krausmann (2010) showed that different types of materials exhibit fundamentally different behaviors, depending on their international income elasticities of consumption.
Wang et al. (2012) examined driving factors of changes in recent resource use in China and found that the affluence factor contributed most to the increase of direct material input. Schandl & West (2012) showed that Australia, China, and Japan have diverging patterns of resource use, and that these patterns can be linked to interdependencies between them and the very different roles each nation plays within a globalized system of natural resource exploitation. However, these studies only estimate domestic resources extraction and direct resource trade, without linking resources extraction with final products consumption within a globalized system of resources use (Wu et al., 2016).
Although resource consumption varies with income, resource productivity can be not dependent on income. This is because resource productivity is a ratio of income and consumption. So if consumption is proportional to income, there will be no variation in productivity. That‘s why the resource productivity is not a good indicator of resource efficiency according to Steinberger & Krausmann (2010). Other authors have also expressed skepticism toward resource productivity as a robust or informative indicator. Ang (2006) pointed out that both the resource and economic measures are rather arbitrarily weighted composites, with contributions from many sectors at varying prices for GDP.
Nevertheless the efficient use of resources and improvement of resource productivity are one of the main objectives nowadays. The improvement of resource productivity is a long lasting process and needs a good understanding of the material basis of the economy, greater coherence of policies relating to resource use and materials management, strengthening the partnerships with the private sector, research, and civil society and so on (OECD, 2011).
Kalmykova et al. (2015) after the analyses of the material flows at the national (Sweden) and urban scale declared that the resource consumption trends indicate that the implemented policies have failed to bring significant reductions in resource and energy throughput. Nations must urgently reduce the consumption of all resources. The EU’s long-term growth strategy, “EUROPE 2020”, chose efficient resources as one of its major implementation themes to emphasize efficient resource management for economic development (EC, 2010), and proposed the direction of the long-term policy for the increase in production efficiency and the use of wastes as resources (EC, 2011). Tarasyev et al. (2015) analysed a dynamic mechanism for optimization of resource productivity within the economic growth model framework. The optimal control problem is posed to optimize investment in capital, as a basic factor of production, and investment in technology for raising resource productivity. According to the authors, there is urgent need to explore new approaches in economics that take natural resource into an analytical framework. However Bringezu et al. (2012) and others think that globally acceptable levels of resource use can hardly be calculated and derived directly from any modeling.
Resource productivity in the Baltic States
As the resource productivity is a concern of each country of the world it is critical to estimate the resource productivity at the national level in order to identify the most problematic regions and make certain decisions.
Tendencies of resource productivity in the region
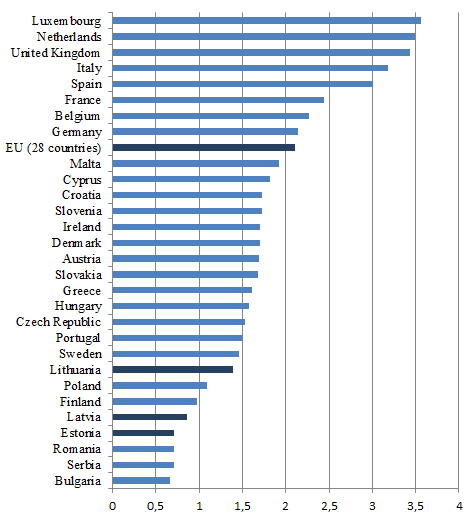
The analysis of resource productivity in Europe shows that the Baltic States are those where this question should be solved strictly as the resource productivity in the region is 1.5-3 times lower than the average resource productivity of all EU (2.1) and is one of the lowest in the region (Fig. 1). According to the data of 2014, the resource productivity in Lithuania is the highest (1.4) among three Baltic States and almost twice higher than the resource productivity in Latvia (0.9) and Estonia (0.7).
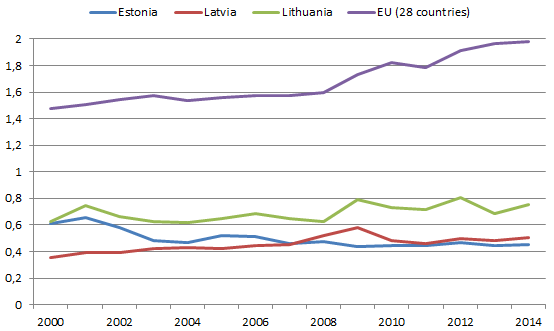
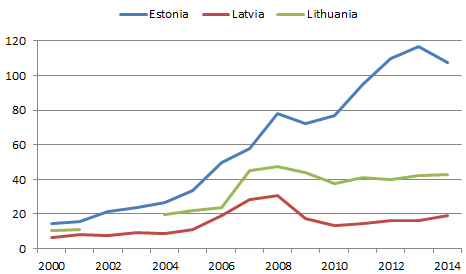
Moreover, the progress to increase it during the last decade was low. The average resource productivity of EU increased by 34.2% since 2000 (till 2014), while Latvia was the only country among three Baltic States that managed to exceed this growth (Fig. 2). The resource productivity in this country increased by 43.5% during this period and outstripped the resource productivity in Estonia. Lithuania improved this indicator by 20.5%, while Estonia is one of a few that fixed negative change (-26.2%) of the resource productivity during fourteen years (the resource productivity has also decreased in Malta and Romania).
The analysis tends to a conclusion that the resources in the Baltic States are used inefficiently. It raises a great concern and should be one of the most important questions that should be solved without delay. That‘s why it is important to identify the main factors that have influence on the resource productivity and put effort in supporting them in order to improve the situation in the region.
Identification of the factors that have influence on the resource productivity
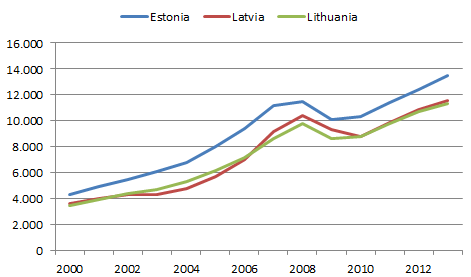
Such indicators as national income, technologies used in business as well as investing in R&D are mentioned as the most important for the resource productivity in various researches. Gross and net national income per capita rose consistently in all three countries since 2000 (except it fell slightly in 2009) and increased three times during thirteen years (Fig. 3). In turn, it has had to increase the use of the resources.
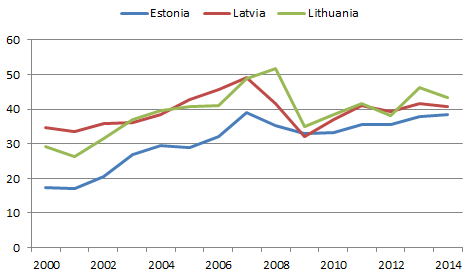
Domestic material consumption grew more moderately (Fig. 4). DMC in Latvia increased the least, i.e. 17.7% during fourteen years. DMC in Lithuania rose 49.1% while it increased twice (121.7%) in Estonia.
Reduction in use of resources can be reached by improving the processes and technologies. This intent and effort can be represented by the expenditures on research and development. Total R&D appropriations per inhabitant in Latvia are the lowest in Latvia and they are 2.5 times lower than in Estonia (Fig. 5). Growth of R&D appropriations and decline of resource productivity at the same time leads to a conclusion that R&D expenditures in Estonia are not directed to reduce the consumption of resources or efforts to do that are not effective.
In order to make the more detailed analysis of various indicators and their impact on the resource productivity the correlation analysis and Granger causality analysis will be done. Moreover more indicators related to outlays for research and development and national income will be taken into account. The further research covers the analysis of the following indicators:
government budget appropriations or outlays for research and development (GBAORD) for environment, transport, telecommunication and other infrastructures, energy, industrial production and technology (all in euro per inhabitant and as a percentage of GDP),
total R&D appropriations (euro per inhabitant and as a percentage of GDP), gross domestic expenditure on R&D (GERD) in PPPs USD, publically financed GERD as a percentage of GDP,
total intramural R&D expenditure (GERD) of all sectors, GERD of business enterprise sector, GERD of government, GERD of higher education sector (all in euro per inhabitant and as a percentage of GDP),
business enterprise expenditure on R&D (BERD) as a percentage of GDP, BERD financed by government (direct) as a percentage of GDP, BERD of small and medium enterprises (SMEs) as a percentage of total BERD, BERD of large firms as a percentage of total BERD,
net primary income transfers with the rest of the world, primary incomes payable to the rest of the world, primary incomes receivable from the rest of the world, gross national income at market prices, net national income at market prices, net national disposable income, gross national disposable income, final consumption expenditure, domestic demand, gross value added at basic prices (all in euro per inhabitant).
The analysis covers an annual data from 2000 till 2014, but some indicators have shorter time series.
Correlation analysis
The correlation analysis between resource productivity in each country of the Baltic States and indicators mentioned above was made in order to define the indicators that are mostly related with the resource productivity. The correlation coefficients (
The results show the great differences among countries. Most indicators are negatively correlated with the resource productivity in Estonia and net primary income transfers with the rest of the world are the only that significantly positively correlates with the resource productivity. Meanwhile most indicators are positively correlated with the resource productivity in Latvia. It has the strongest correlation with government budget appropriations or outlays for R&D as a percentage of GDP, national income at market prices (gross and net) and national disposable income (gross and net). Contrary to these, there are lots of positively, as well as negatively correlated indicators with the resource productivity in Lithuania, but there are only three indicators that correlates significantly, i.e. gross domestic expenditure on R&D (GERD) in PPPs, total intramural R&D expenditure of all sectors as a percentage of GDP and GERD of business enterprise sector, euro per inhabitant.
Correlation analysis still does not show the causal relationship between these indicators. Furthermore, some indicators can have the delayed effect on the resource productivity. That‘s why Granger causality test will also be made.
Granger causality test
The Granger causality test is a statistical hypothesis test for determining whether one time series is useful in forecasting another. In other words the Granger approach to the question of whether
The results showed that the resource productivity in Estonia is Granger caused by total R&D appropriations as a percentage of GDP, publically financed GERD as a percentage of GDP and intramural R&D expenditure of government (in euro per inhabitant and as a percentage of GDP). As the correlation between these indicators and the resource productivity is negative, it is obvious that R&D expenditure does not help to improve the resource productivity and this can be as a cause of inefficient use of these outlays (Table
The resource productivity in Latvia is Granger caused by government budget appropriations or outlays for R&D for energy (in euro per inhabitant), total R&D appropriations (in euro per inhabitant), total intramural R&D expenditure of all sectors (in euro per inhabitant), GERD of government as a percentage of GDP, GERD of business enterprise sector, government and higher education sector (all in euro per inhabitant) and all the indicators related to national income, i.e. net primary income transfers with the rest of the world, primary incomes payable to the rest of the world, primary incomes receivable from the rest of the world, gross national income at market prices, net national income at market prices, net national disposable income, gross national disposable income, final consumption expenditure, domestic demand and gross value added. It tends to a conclusion that growth of income has positive effect on the resource productivity, as well as the expenditures on R&D in all the sectors are used efficiently in this country.
Meanwhile the resource productivity in Lithuania is Granger caused only by R&D of small and medium-sized firms as a percentage of total BERD and R&D of large firms as a percentage of total BERD. By analogy to the case of Estonia, it shows that R&D expenditure does not help to improve the resource productivity in Lithuania. Only large firms can be distinguished as leaders as their expenditures on R&D tend to increase the resource productivity.
Regression analysis
Hereinafter autoregressive distributed lag models (ADL) will be created in order to present the more detailed relationship between the resource productivity and the indicators related to national income as well as expenditures on R&D. In order to insure the logical interpretation of the results and avoid the situations when the results tends to the recommends to worsen the certain indicators that would have negative impact on the economics of the country, the requirement that the parameters of the model (except intercept) must be positive will be set. All the indicators that can be significant for the resource productivity according to the results of correlation analysis and Granger causality test will be taken into account when making the ADL model. Also two lags of dependent and independent variables will be analysed.
Unfortunately no one significant model for the resource productivity in Estonia was found. It confirms again that Estonia has great problems with the resource productivity and R&D expenditures are not directed to solve it.
In the case of Latvia several similar models can be created, but the best significant model (at the significance level of 0.05) is as follows:
(1) here yt is the resource productivity in Latvia at the time moment t and xt-1 is domestic demand at the time moment t-1. So, growing demand of products (as well as national income since they are also strongly correlated with the resource productivity) encourages the nation to take care about the resource productivity. The coefficient of determination of the model is 0.86 and it means that variation of xt-1 can explain 86% of the variation of yt. Lags of yt (i.e. yt-1 and yt-2) as well as other indicators don’t improve the model.
The resource productivity in Latvia is also strongly correlated with the R&D expenditure. The best significant model is written below:
(2) here
The best significant model for the resource productivity in Lithuania is presented below:
(3) here
Conclusions
An effective use of resources is one of the main objectives all over the world. The resource productivity significantly differs not only among the regions but also among the countries in the region. The resource productivity depends on various factors, but national income and outlays for research and development are two indicators that are mentioned most frequently in various scientific literature.
The resource productivity in the Baltic States is one of the lowest comparing with other countries of the Europe. The tendency of resource productivity in Latvia and Lithuania is positive. It increased respectively by 43.5% and 20.5% since 2000. Nevertheless, it didn’t help to rise from the bottom of the list of most productive EU countries. Meanwhile Estonia is one of a few countries where the resource productivity is still decreasing. It indicates that the problem of resource productivity is not dealt there.
Significant differences can be also observed within countries when analysing the factors that have the greatest influence on the resource productivity. No indicators related to national income and R&D expenditures that have positive relationship with the resource productivity in Estonia were found. Large companies are the only that significantly contribute to improvement of resource productivity in Lithuania so far. Meanwhile the problem of the resource productivity in Latvia is dealt the best. Growth of national income encourages the nation to take care about the resource productivity and the resource productivity is significantly correlated with such indicators as total R&D appropriations in euro per inhabitant, total intramural R&D expenditure of government in euro per inhabitant and others. It shows that R&D expenditure is efficiently used for improvement of the resource productivity.
According to the results, different means for increasing the resource productivity should be applied. Latvia should continue to invest in R&D and support other indicators that help to improve the resource productivity. While Lithuania and especially Estonia should take care about the effective use of outlays for R&D, make the strict action plans, provide the list of means and check regularly the implementation of them seeking to improve the resource productivity.
References
- Achour, H. & Belloumi, M. (2016). Investigating the causal relationship between transport infrastructure, transport energy consumption and economic growth in Tunisia. Renewable and Sustainable Energy Reviews, 56, 988-998.
- Ang, B.W. (2006). Monitoring changes in economy-wide energy efficiency: From energy-GDP ratio to composite efficiency index. Energy Policy, 34 (5), 574–582.
- Aspridis, G., Kazantzi, V., Sdrolias, L. & Mplanas, N. (2014). Productivity Enhancement Options in the Years of the Economic Crisis. Procedia - Social and Behavioral Sciences, 148, 516 – 523.
- Bah, E.H. & Fang, L. (2015). Impact of the business environment on output and productivity in Africa. Journal of Development Economics, 114, 159–171.
- Bretschger, L. & Smulders, S. (2007). Introduction to sustainable resource use and economic dynamics. In: Bretschger L, Smulders S, editors. Sustainable resource use and economic dynamics. Berlin: Springer, 1–16.
- Bringezu, S. (2011). Key elements of economy-wide sustainable resource management. Annales de Mines, Serie Responsabilite & Environnement, 61, 78–87.
- Bringezu, S., O’Brien, M. & Schütz, H. (2012). Beyond biofuels: Assessing global land use for domestic consumption of biomass A conceptual and empirical contribution to sustainable management of global resources. Land Use Policy, 29, 224–232.
- Broadstock, D.C., Li, J. & Zhang, D. (2016). Efficiency snakes and energy ladders: A (meta-)frontier demand analysis of electricity consumption efficiency in Chinese households. Energy Policy, 91, 383-396.
- Calcagnini, G., Giombini, G. & Travaglini, G. (2016). Modelling energy intensity, pollution per capita and productivity in Italy: A structural VAR approach. Renewable and Sustainable Energy Reviews, 59, 1482–1492.
- CEC – Commission of the European Communities. (2005). Thematic Strategy on sustainable use of natural resources COM, 670 final.
- EC – European Commission. (2006). Halting the Loss of Biodiversity By 2010—and Beyond. Sustaining ecosystem services for human well-being. COM(2006) 216 final.
- Eurostat. (2016). Components of domestic material consumption. Available via internet: <http://ec.europa.eu/eurostat/cache/metadata/en/tsdpc220_esmsip.htm>.
- Farhadi, M., Islam, M.R. & Moslehi, S. (2015). Economic Freedom and Productivity Growth in Resource-rich Economies. World Development, 72, 109–126.
- Giljum, S., Bruckner, M. & Martinez, A. (2015). Material Footprint Assessment in a Global Input-Output Framework. Journal of Industrial Ecology, 19, 792-804.
- Griffith, R., Redding, S. & van Reenen, J. (2004). Mapping the two faces of R&D: productivity growth in a panel of OECD industries. Review of Economics and Statistics, 86, 883–895.
- Kalmykova, Y., Rosado, L. & Patrício, J. (2015). Resource consumption drivers and pathways to reduction: economy, policy and lifestyle impact on material flows at the national and urban scale. Journal of Cleaner Production, In Press, 1-11.
- Lee, I.S., Kang, H.Y., Kim, K.H., Kwak, I.H., Park, K.H., Jo, H.J. & An, S. (2014). A suggestion for Korean resource productivity management policy with calculating and analyzing its national resource productivity. Resources, Conservation and Recycling, 91, 40–51.
- Long, X., Zhao, X. & Cheng, F. (2015). The comparison analysis of total factor productivity and eco-efficiency in China's cement manufactures. Energy Policy, 81, 61–66.
- Lumenga-Neso, O., Olarreaga, M. & Schiff, M. (2005). On ‘indirect’trade-related R&D spillovers. European Economic Review, 49 (7), 1785–1798.
- Moro, A. & Stucchi, R. (2015). Heterogeneous productivity shocks, elasticity of substitution and aggregate fluctuations. Journal of Macroeconomics, 45, 45–53.
- Mulder, P. & de Groot, H.L.F. (2007). Sectoral energy and labour productivity convergence. In: Bretschger L, Smulders S, editors. Sustainable resource use and economic dynamics. Berlin: Springer, 165–90.
- OECD. (2008). Measuring Material Flows and Resource Productivity. Synthesis Report.
- OECD. (2011). Resource Productivity in the G8 and the OECD – A Report in the Framework of the Kobe 3R Action Plan.
- OECD. (2015). Material Resources, Productivity and the Environment. In series: OECD Green Growth Studies.
- Schandl, H., West, J. (2012). Material Flows and Material Productivity in China, Australia, and Japan. Journal of Industrial Ecology, 16, 352-364.
- Steinberger, J.K. & Krausmann, F. 2010. Material and Energy Productivity. Environmental Science & Technology, 45, 1169-1176.
- Streimikiene, D., Simanaviciene, Z. & Kovaliov, R. (2009). Corporate social responsibility for implementation of sustainable energy development in Baltic States. Renewable and Sustainable Energy Reviews, 13(4), 813–824.
- Štreimikienė, D. 2016. Review of financial support from EU Structural Funds to sustainable energy in Baltic States. Renewable and Sustainable Energy Reviews, 58, 1027–1038.
- Tanning, T. & Tanning, L. (2014). Material flow efficiency of Central and East European countries of the European Union. Journal of Multidisciplinary Engineering Science and Technology, 1(4).
- Tanning, T. & Tanning, L. (2015). Analysis of the Resource Productivity of New Members of the European Union. Journal of Behavioural Economics, Finance, Entrepreneurship, Accounting and Transport, 3(1), 21-31.
- Tarasyev, A., Usova, A. & Wang, W. (2015). Hamiltonian Trajectories in a Heterogeneous Economic Growth Model for Optimization Resource Productivity. IFAC-PapersOnLine, 48-25, 074–079.
- Wang, H., Hashimoto, S., Moriguchi, Y., Yue, Q. & Lu, Z. (2012). Resource Use in Growing China. Journal of Industrial Ecology, 16, 481-492.
- Weisz, H., Krausmann, F., Amann, C., Eisenmenger, N., Erb, K.H., Hubacek, K. & Fischer-Kowalski, M. (2006). The physical economy of the European Union: Cross-country comparison and determinants of material consumption. Ecological Economics, 58, 676–698.
- Wu, R., Geng, Y. & Wenjing, L. (2016). Trends of natural resource footprints in the BRIC countries. Journal of Cleaner Production, In Press, available online 8 April 2016.
Copyright information

This work is licensed under a Creative Commons Attribution-NonCommercial-NoDerivatives 4.0 International License.
About this article
Publication Date
30 November 2016
Article Doi
eBook ISBN
978-1-80296-016-7
Publisher
Future Academy
Volume
17
Print ISBN (optional)
-
Edition Number
1st Edition
Pages
1-471
Subjects
Business, management, behavioural management, macroeconomics, behavioural science, behavioural sales, behavioural marketing
Cite this article as:
Stundziene, A. (2016). Key Indicators for Improving the Resource Productivity in the Baltic States. In R. X. Thambusamy, M. Y. Minas, & Z. Bekirogullari (Eds.), Business & Economics - BE-ci 2016, vol 17. European Proceedings of Social and Behavioural Sciences (pp. 339-354). Future Academy. https://doi.org/10.15405/epsbs.2016.11.02.31