
Economic Growth and Poverty Alleviation in Russia: Should We Take Inequality into Consideration?


Abstract
The paper describes main ideas surrounding the topic of inclusive and pro-poor growth. This study investigates the impact of economic growth on inequality and poverty in Russia over the period 2002-2012. High rates of economic growth had brought about rapid reduction of the poor people while income inequality had risen. The work examines whether Russian economic growth is pro-poor over that period. Poverty in Russia is a problem of excessively high inequality now and its scope can’t be radically reduced in the short term without a rapid reduction of inequality. The current situation is paradoxical – the economic growth only reinforces inequality, is not conducive to the alleviation of poverty, and may be characterized by low quality. We conclude that it is essential to formulate pro-poor policies along with growth-enhancing policies in order to alleviate both absolute and relative poverty in Russia. Growth is good for the poor, and growth that is accompanied by progressive distributional change is even better.
Keywords: Inequalitypovertypro-poor growtheconomic growthRussia
Introduction
According to the Concept of Russia’s long-term development till 2020, the goal of achieving sustainable economic growth remains a key focus of policymakers. However, high rates of economic growth over the last decade were accompanied by strengthening of inequality. In these circumstances, the problem of poverty has acquired a new character – chronic and local. After the 2008 financial crisis economic growth does not have a positive impact on official poverty headcount in Russia, ‘canning’ poverty within 11%. Moreover, the relative poverty headcount is much higher and remains stable at the level of 30%.
It is obvious that a high level of economic development facilitates the struggle against poverty, providing resources for this purpose. However, it is also possible that economic growth increases poverty. This can happen when inequality increases so much that the beneficial effects of growth is completely eliminated. Bhagwati calls this as an immeserizing growth, the growth that provokes poverty (Kakwani, & Pernia, 2000). Opponents of growth consider that there is virtually no reason to believe that economic growth helps to solve social problems. In many countries, mainly developed, the problem of poverty is a problem of distribution, rather than production. Moreover, high rates of growth can be related to environmental pollution and high stress, which would be prejudicial to physical and mental health.
So, it is necessary to determine the extent to which economic growth improves the status of the poor. Do the poor benefit to the same extent as the rest of the population? Following Dollar & Kraay (2002): “Economic growth is good for the poor”, since average incomes of the poorest quintile rise proportionally with average incomes of the rest. Changes in the income distribution (on average) are slight and moving too slowly to lead to substantial changes in the level of poverty. The evidence emphasizes the importance of economic growth for poverty reduction.
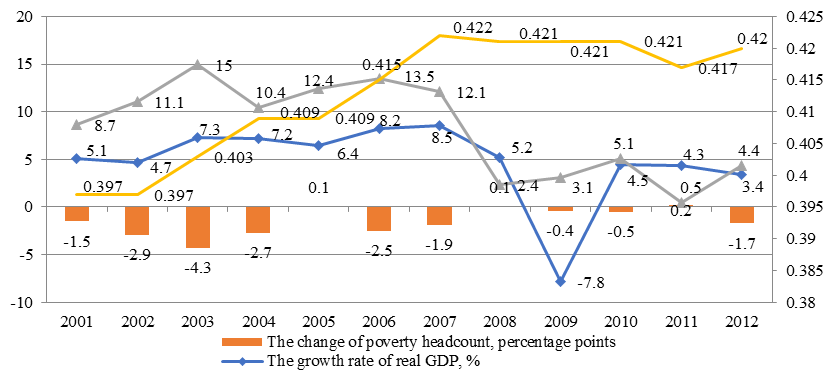
However, the beneficial effect of economic growth on the poor considerably varies not only between countries but also within. In some cases, the increase in per capita income by 1% can lead to a decrease in poverty headcount by 3-4%, while in other cases, by only a tenth of a percent or even an increase. Such a phenomenon can be observed in the Russian economy in 2005, 2008 and 2011, when economic growth exacerbated the problem of poverty (see Fig.
Saving income inequality at a present high level under accelerated economic growth shows the uneven distribution of gains from economic growth, which could potentially lead to a weakening of the influence of economic growth on poverty reduction. This study investigates the impact of economic growth on inequality and poverty in Russia over the period 2002-2012. We examine whether Russian economic growth is pro-poor over that period.
Pro-Poor Growth: A Short Review
The concept of pro-poor growth has become very popular during the last decade. It reflects the idea that economic growth should affect all the segments of society and this is why the term “inclusive growth” is also often used. Pro-poor growth is defined as a growth, which leads to a significant reduction in poverty. However, this does not give a formal definition of clear quantitative criteria for a “significant” reduction of poverty. It is recognized that the pro-poor growth should enable the poor to participate actively in economic activities and to receive some benefits from this participation. The author stands by the concept of relative pro-poor growth, which implies an increase in the proportion of the poor in the total distribution of the national income.
Although there have been only a few studies on pro-poor growth in Russia, some studies have highlighted that Russian economic growth has not been pro-poor over the last decade. Following Takeda (2010), who had examined the effect of economic growth on poverty reduction in Russia based on the elasticity of poverty to real per capita GRP, using Russian regional data for 1995-2006, growth benefited the richer regions (or people) more. As a result, from the regional point of view, she concluded that the growth after the 1998 financial crisis had not been pro-poor in Russia. Shvareva & Kononova (2007) have found that the inflation burden was higher for the poor, so the inflation in Russia stood one of the factors that increased social inequality. They also have argued that economic growth could be characterized as pro-rich growth because major gains from economic growth were distributed in favor of the wealthy.
Data and Methodology
In this study, we use official data by the Federal State Statistics Service of Russia for 2002-2012 on the average per capita money income and subsistence minimum, as well as data on the distribution of population by disposable income. We proceed from the premise that poverty is fully determined by three parameters – the level of per capita income (the mean income of the distribution), the poverty line and the Lorenz curve representing the structure of relative income inequalities. The poverty index, as measured by the class of FGT indices, can be written as
(1)
where
The framework of analysis has its origins in the decomposition of changes in poverty into growth and redistribution components proposed by Ravallion & Datt (1991). The level of poverty may change due to a change in the mean income
(2)
where
The growth component of a change in the poverty measure is defined as the change in poverty due to a change in the mean while the distribution of income does not change. The redistribution component is the change in poverty when the Lorenz curve changes in the absence of growth.
The pure growth elasticity of poverty
(3)
As an increase in average income reduces poverty, net growth elasticity is always negative.
The inequality elasticity of poverty
(4)
The inequality elasticity of poverty decreases monotonically with the initial level of inequality. On the one hand, efforts of a society with a high level of initial inequality to reduce poverty may be futile. On the other hand, a further increase in inequality in such a society weakly affects the poor. In general, the lower initial level of inequality will be more productive fight against poverty.
On dividing the equation (2) by the growth rate of real mean income gives the total poverty elasticity
(5)
where – the total poverty elasticity, – the growth elasticity of inequality, which measures the percentage change in the Gini index when there is a growth rate of 1 percent.
When is positive (negative), the growth process is accompanied by an increase (decrease) in inequality. The total poverty elasticity measures the impact of growth on poverty when inequality can also change with growth. It measures the percentage change in poverty when there is a growth rate of 1 percent.
Following Kakwani & Pernia (2000), the degree of pro-poor (pro-rich) growth can be measured by an index of pro-poor growth
(7)
where – the index of pro-poor growth.
If > 1, the growth process is considered to be pro-poor. If = 1 and = 0, the growth process is accompanied by a zero change in inequality and poverty, respectively. When 1 < < 0, economic growth reduces poverty, but the “inequality effect” of economic growth is negative so that the poor benefit proportionately less from economic growth than the non-poor. This can be characterised as trickle-down growth. If < 0, economic growth actually. In case of an economic recession, the pro-poor index is inverted to be . A growth episode is called pro-poor only if inequality declines or remains unchanged.
Following Aivazian (1997), the distribution of Russian households by per capita income may in fact be adequately described with a mixture of log-normal laws. A similar point is made by Lopez and Serven (2006), who using a large cross country dataset spanning close to 800 country-year observations from industrial and developing countries on income/expenditure inequality formally test the null hypothesis of lognormality for the size distribution of income/expenditure. Their results suggest a rejection of the null hypothesis for per capita expenditure, but they are unable to reject the null for per capita income (Lopez, & Serven, 2006).
The advantage of this approach is that, with the data on the distribution of income by quintile shares, the poverty line and the average income, we can easily estimate any desired poverty measures (absolute or relative): poverty headcount, poverty gap and squared poverty gap. The last two are not officially presented by the Russian Federal State Statistics Service.
First, we have estimated values of the Gini index and headcount indexes of poverty according to the log-normal model presented by Kolenikov & Shorrocks (2003).
(7)
(8)
where
The measures show a pronounced trend decrease in poverty over the period. Poverty indexes fell, though not all continuously. However, increases are small and probably not significant statistically at a reasonable level. The poverty headcount index is estimated to have started at 24.47% in 2002, falling by 13.3 points to 11.21% in 2012. By year-to-year periods, this was made up of a fall in the index of 3.84 points over 2002 to 2003, 2.8 points between 2003 and 2004, and it rose by 0.19 points between 2008 and 2009, 0.34 points between 2010 and 2011.
Data and Methodology
We apply the two-way Shapley decomposition to changes in poverty since 2002. We assess the factor contribution to poverty changes presented in table
table
The results in Table
According to the index for the full period the poor did not participate fully in the growth that occurred. Growth in Russia has not been strictly pro-poor, although it has resulted in considerable poverty reduction. Poverty reduction would have been even faster if the government had avoided policies with adverse consequences on income distribution. For instance if the Lorenz curve had been at the 2002 level the poverty headcount would have been 9% of the total population.
In the aftermath of the financial crisis 2008, the high positive growth rates achieved by the Russian economy had slowed down. The annual growth rate of real disposable money income fell from 12.4% in 2002-2007 to 3% in 2008-2012. The decline in annual growth of real GDP was even more dramatic – from 7% in 2002-2007 to 1,8% in 2008-2012. The results in Table
The development strategy, based on the growing inequality in the distribution of income between the rich and the poor, actually does not lead to an increase in economic potential. By the number of billionaires Russia is one of the leaders in the global economy. Thus, according to the annual Forbes ranking 2013, Russia was ranked third after the United States and China, but according to the GDP per capita (PPP) Russia was ranked only 77 (Rudenko, 2014).
Conclusion
We must say that the problem of absolute monetary poverty in Russia is almost solved. But if we look at the relative poverty the problem remains constant or even worsens – the proportion of people with money incomes below the half of average income is estimated to have started at 28.3% in 2002, rising to 31% in 2012. The state social policy of redistribution has no significant effect on the risk of poverty and the benefit system that is aimed at poverty reduction does not actually perform this function. Poverty in Russia is a problem of excessively high inequality now and its scope can’t be reduced in the short term without a radical reduction of inequality. The current situation is paradoxical – the economic growth only reinforces inequality, it is not conducive to the alleviation of poverty, and may be characterized by low quality. Trying to meet the challenges of economic growth and the eradication of poverty at the same time will not be successful until we prioritize goals. We conclude that it is essential to formulate pro-poor policies along with growth-enhancing policies in order to alleviate both absolute and relative poverty in Russia and its regions.
Acknowledgements
The study was supported by the Ministry of education and science of Russia, project 14.Z56.14.3051-MK.
References
- Rosstat (2014). Social and Economic Indicators for Russia 2013. Available at: http://www.gks.ru/dbscripts/Cbsd/DBInet.cgi#1 (accessed April 10, 2015).
- Kakwani, N., & Pernia, E.M. (2000). What is pro-poor growth? Asian Development Review, 18 (1), 1-16.
- Dollar, D., & Kraay, A. (2002). Growth is good for the poor. Journal of Economic Growth, 7 (3), 195-225.
- Ravallion, М. & Chen, S. (2003). Measuring pro-poor growth. Economics Letters, 78 (1), 93-99.
- Kraay, A. (2006). When is growth pro-poor? Evidence from a panel of countries. Journal of Development Economics, 80 (1), 198-227.
- Takeda, Y. (2010). Is Russia’s economic growth pro-poor? In A., Uegaki, & S., Tabata, (Eds.), The Elusive Balance: Regional Powers and the Search for Sustainable Development (pp. 129-142). Sapporo: Slavic Research Center, Hokkaido University.
- Shvareva, N. & Kononova, V. (2007). Impact of economic growth on poverty reduction: the Russian experience of 2001-2005. In Scientific papers of the Institute for Complex Strategic Studies, 2006. (pp. 8-33). Moscow: Institute for Complex Strategic Studies.
- Ravallion, M., & Datt, G. (1991). Growth and redistributive components of changes in poverty measures. A decomposition with applications to Brazil and India in 1980s. Living Standards Measurement Study Working Paper № 83. Washington D.C.: The World Bank.
- Aivazyan, S.A. (1997). The model for the formation of population distribution in terms of per capita income in Russia. Economics and Mathematical Methods, (4), 74-86.
- Lopez, J.H. & Serven, L. (2006). A normal relationship? Poverty, growth and inequality. World Bank Policy Research Working Paper 3814, January 2006.
- Kolenikov, S.О., & Shorrocks, A.F. (2003). А decomposition analysis of regional poverty in Russia. WIDER Discussion Paper No. 2003/74.
- Rudenko, D.Y., Pogodaeva, T.V., & Didenko, N.I. (2015). Poverty Alleviation Strategies in the Russian Arctic Zone Regions. Mediterranean Journal of Social Sciences, 6(1), 32-39.
- Rudenko, D.Y. (2014). Alternative Approaches to Measure Poverty in Russian Regions. Mediterranean Journal of Social Sciences, 4(13), 262-267.
Copyright information

This work is licensed under a Creative Commons Attribution-NonCommercial-NoDerivatives 4.0 International License.
About this article
Publication Date
20 February 2016
Article Doi
eBook ISBN
978-1-80296-006-8
Publisher
Future Academy
Volume
7
Print ISBN (optional)
-
Edition Number
1st Edition
Pages
1-513
Subjects
Social welfare, social services, personal health, public health
Cite this article as:
Rudenko, D. (2016). Economic Growth and Poverty Alleviation in Russia: Should We Take Inequality into Consideration?. In F. Casati (Ed.), Lifelong Wellbeing in the World - WELLSO 2015, vol 7. European Proceedings of Social and Behavioural Sciences (pp. 109-116). Future Academy. https://doi.org/10.15405/epsbs.2016.02.15