
Assessment of Financial Sector Blueprint to Achieve Banking Sector Efficiency in Malaysia


Abstract
Malaysia introduced the Financial Sector Blueprint 2011-2020 as a strategic initiative to fortify its financial sector and propel the nation towards becoming a high-value-added, high-income economy. Following the culmination of the Financial Sector Blueprint 2011-2020, Malaysia has recently launched a new five-year Financial Sector Blueprint spanning from 2022 to 2026. Nevertheless, there remains a crucial need to assess the effectiveness of the previous blueprint (2011-2020) in achieving its predetermined objectives and goals. Therefore, the primary objective of this study is to critically evaluate the performance of the Malaysian Financial Sector Blueprint 2011-2020, specifically with regard to its impact on enhancing bank efficiency. To accomplish this, the study utilizes secondary data and employs a ratio analysis of conventional banks in Malaysia. The research highlights a favourable shift in banks' financial standings, characterized by increased stability and reduced volatility following the implementation of the Blueprint. The insights derived from this analysis stand to offer invaluable direction for policymakers, assisting in crafting well-informed strategies for upcoming blueprints. Essentially, this study emphasizes the pivotal role of the Financial Sector Blueprint 2011-2020 and presents critical analysis that can shape future blueprint initiatives, fortifying the sustained expansion and resilience of Malaysia's financial landscape.
Keywords: Banking Sector, Financial Sector Blueprint, Financial Performance, Malaysia
Introduction
The efficiency of the banking sector has received a lot of attention in the literature recently (Hussien et al., 2019). When banking sectors struggle, the government and financial authorities typically step in with the intention of restoring market confidence and preventing a ripple impact on the rest of the economy. These government interventions are viewed as being at odds with the ideals of a market economy and may lead to conflicts of interest and ineffective resource allocation (Allen et al., 2015; Calderon & Schaeck, 2016). Some of the literature supports the idea that intervention measures or financial reforms in the banking industry distort the market, reduce competence, and raise risk (Acharya & Yorulmazer, 2007; Gropp & Vesala, 2004). However, when the market economy fails, government interventions become one of the only measures that work to repair the market failures, enhancing the competitiveness and solvency of the financial sector as well as its functionality (Abdurraheem et al., 2023; Alam et al., 2023; Brei & Schclarek, 2013; Widarjono et al., 2023).
In the case of Malaysia, the fallout from the global financial crisis made clear how important Malaysia's banking sector is for stability and efficiency. The crisis revealed flaws in financial institutions and sparked worries about governance, risk management, and the state of the banking industry as a whole. The Malaysian government took urgent action to strengthen the financial sector and regain confidence after realising the need for reform. In order to address these issues strategically, the Financial Sector Blueprint 2011-2020 was unveiled with the main goal of enhancing the efficiency and resilience of the banking sector (Bank Negara Malaysia, 2011).
As a result, a strong and competitive financial ecosystem was to be developed as part of the Financial Sector Blueprint 2011-2020 in order to support Malaysia's ambitions for economic growth. The strategy emphasised the value of stability, competitiveness, and high value-added activities in fostering the banking sector's intermediary function for economic growth. In it, a financial system was envisioned that would lead to a high-income economy. Risk management, governance, market expansion, and improving the general effectiveness of banking operations were major areas of focus.
Malaysian banks set out on a path of change and reform in order to accomplish the objectives indicated in the blueprint. They adopted fresh approaches and programmes to fortify their governance procedures, strengthen their risk management frameworks, and boost operational effectiveness. The changes intended to strengthen the financial system and make it more resistant to shocks in the future while promoting steady economic growth. This study aims to evaluate the effectiveness of Malaysian banks' operations and the results of the financial reforms put in place following the 2008 global financial crisis. We may learn more about the Financial Sector Blueprint 2011-2020's ability to influence banks towards improved efficiency and resilience in Malaysia's financial environment by examining important metrics and trends.
Though the period of the Financial Sector Blueprint 2011-2020 is already over one year ago, another new Blueprint is still not released. At the same time, there are lack of study on the performance of the blueprint on Malaysian (conventional) banking industry development. Thus, it is very important to evaluate the performance of Malaysia's financial sector blueprint 2011–2020 policy reforms in case of achieving conventional banking efficiency. Moreover, it is also very urgent to develop a set of guidelines for forthcoming Blueprints base on the lessons received from the performance assessment of previous Blueprint.
The overall objective of this research is to examine the influence of financial sector blueprint (2011-2020) on the market efficiency of Bursa Malaysia. Further, the sub-objectives can be referred as follows:
To examine the overall performance conventional banking after the financial sector blueprint (2011-2020) policy reforms in Malaysia.
To provide some specific guidelines for the forthcoming blueprint relevant to the stock market development
According to Casu and Molyneux (2003), institutional and other environmental factors are to blame for the conflicting results of earlier research addressing the impact of reforms on bank performance. In other words, these authors contend that country-specific factors influence how financial system restructurings affect banking sector performance. Therefore, these results support the requirement for further studies. Therefore, by evaluating the efficacy of the Financial Sector Blueprint 2011-2020, this study addresses a critical gap in the existing research. It provides an in-depth analysis of the efficacy of the blueprint in enhancing the efficiency of conventional banks. This evaluation is essential for comprehending the impact of the policy reforms on the banking sector, identifying areas of success, and identifying potential enhancement areas.
Additionally, the study recognises the significance of learning from past experiences to utilize for future policy formulations. This study will provide policymakers and the Malaysian government with valuable guidelines for devising future blueprints. The findings of this research will enable policymakers to evaluate the Financial Sector Blueprint 2011-2020's effectiveness in achieving its goals. By analysing the performance of the blueprint, policymakers can determine the strengths and weaknesses of the actualized policies. These insights will facilitate evidence-based decision making, allowing for the refinement of existing policies and the development of new strategies to increase the efficacy of Malaysian institutions. The study's recommendations, based on the evaluation of the previous blueprint's performance, provide policymakers with a valuable resource for future blueprint construction.
Literature Review
Methods for calculating and interpreting financial ratios are used in ratio analysis, which evaluates and monitors corporate performance. The income statement and balance sheet are the primary sources of data for ratio analysis (Gitman, 2009). Management accounting functions in any organisation rely significantly on ratios. The basic function of ratio analysis is to furnish data for choice-making (Madhura, 2009). Not only does it help identify and highlight areas of adequate and poor performance, but it also helps identify and highlight areas of exceptional performance (James, 2013). By highlighting areas of good and poor performance, ratios can help managers zero in on where they need to put more effort. When results from before and after an action are compared using a ratio, we may see whether or not that action was beneficial. Reference: (Luckham, 1982). Therefore, progressive ratios are necessary for analysing banks' financial statements.
An Australian study (Duncan & Elliott, 2004) found a strong correlation between customer service quality rankings and all financial performance criteria like interest margins, return on assets, and capital adequacy. Arzu and Gokhan (2005) looked at the practise of managing assets and liabilities during economic downturns. Asset and liability management in banking has received too much attention from academics. They argued that increasing profits was just as important as reducing and controlling risks in an asset-liability management plan. Additionally, their study provided evidence that shifts in public opinion might exacerbate crises.
Tarawneh (2006) analysed the financial results of commercial banks in Oman using multiple regression analysis and correlations. He manipulated the return on assets and interest income as performance proxies (dependent factors) and the bank's size, asset management, and operational efficiency as independent variables. He found a sizable positive correlation between financial performance and operational efficiency, as well as a moderate association between ROA and bank size. Almazari (2011) looked at the financial health of seven different commercial banks in Jordan. He used return on assets (ROA) as a performance criterion, with bank size, asset management, and operational efficiency all having a bearing on ROA. His research revealed a tangential relationship between return on assets (ROA) and operational efficiency in financial institutions and a tangential relationship between ROA and asset management ratio.
Ali et al. (2011) conducted a comprehensive study of Pakistani banks' profitability, and they found that asset management ratio, capital, economic growth, and ROA were all strongly correlated with one another. Operations efficiency, asset management, and economic growth were found to have a considerable impact on ROE. According to the research of Siddiqui and Shoaib (2011), "Measuring performance through capital structure in Pakistan," the size of the bank significantly affected the profitability of the bank as measured by return on equity. Furthermore, they used Tobin's Q as an alternative for evaluating bank performance and found that it is affected by the bank's size, leverage ratio, and investment choices.
Methodology
This study used secondary data which were collected from Bloomberg Terminal and Bursa Malaysia. The secondary data comprises of overall conventional banking sector as well as top nine conventional banks’ data in Malaysia. Description analysis, trends and ratio analyses were used to assess the performance analysis.
Analysis
Performances of banking sector before and after the blueprint
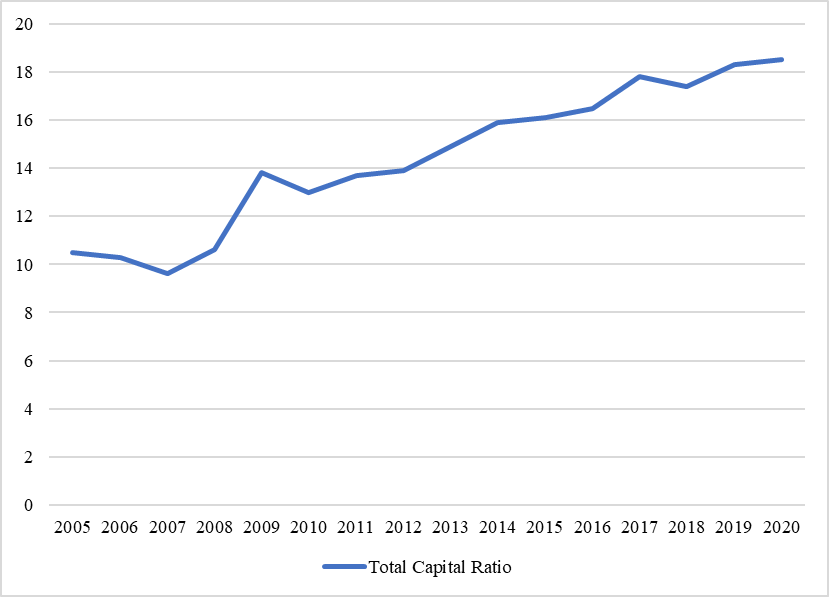
In 2005, the conventional banking sector’s total capital ratio is 10.5% and raise continuously until 18.5% in 2020. Before the Financial Blueprint 2011-2020, the total capital ratio obviously shows a lower percentage, it is quite good due to Basel II that the banks’ total capital ratio should not lower than 8%. While after the blueprint announced, the percentage of total capital ratio become higher which is above 13% from 2011 until 2020. The target of “Enhance the capacity of the financial sector to support the financing needs of domestic and regional large-scale projects with long gestation periods” under financial sector blueprint was achieved by enhance the regionalization of our country financial institutions to join in the mobilization and allocation of regional capital in addition to domestic savings. Figure 1 describe total capital ratio for conventional banking sector from 2005 to 2020.
The overall trend for return on assets (ROA) for conventional banking sector is fluctuating. Figure 2 shows the return on Assets for conventional banking sector from 2005 to 2020. The ROA for beginning of the trend (2004) is higher than the end of the trend (2020) because the overall ROA for banking sector in 2020 experienced downward trend due to the pandemic. ROA in 2005 recorded at 1.4%. The ROA before financial sector blueprint recorded the highest percentage at 1.5%. After the financial blueprint year, the return on assets raised at the highest percentage at 1.7% in 2012 then dropped to 1.4% and 1.1% in 2018 and 2020 respectively. The target of “Implement the Basel III reform package to promote a more resilient Malaysian banking system” need to be focus. So that banks can increase their profitability by using leverage and profits can be measured by return on assets. Because the major assets of a bank are the securities they hold and also the loans given to individuals, businesses, and other firms.
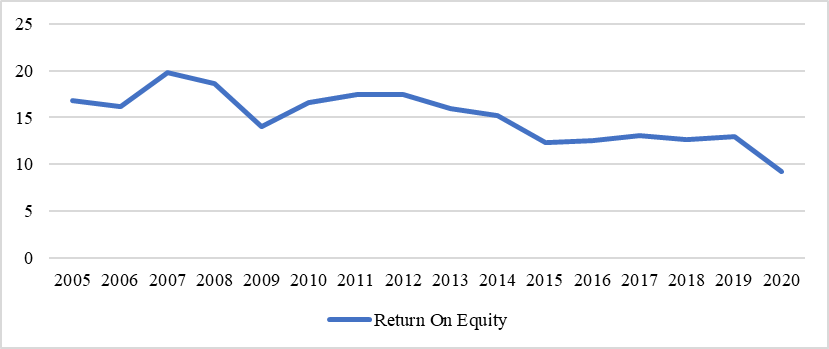
The trend of return on equity showed increase trend at the beginning but decrease at the end. Figure 3 shows the return on equity for conventional banking sector from 2005 to 2020. The return on equity reached the top at 19.8% in 2007 while it decreased to 9.2% in 2020 which the lowest between the 16 years. The target in the Financial Blueprint 2011-2020 “Enhance the financial sector’s capability to support high value-added activities. This includes supporting the financial needs of innovative enterprises throughout the life cycle, which will encompass the transition to the growth and expansion stages and facilitating efficient exit for earlier stage investors” was failed by promoting the role of financial institutions in developing profit- and risk-sharing investment and financing facilities. This will be complemented by sufficient safeguards to ensure that such activities are not funded by retail deposits in these financial institutions.
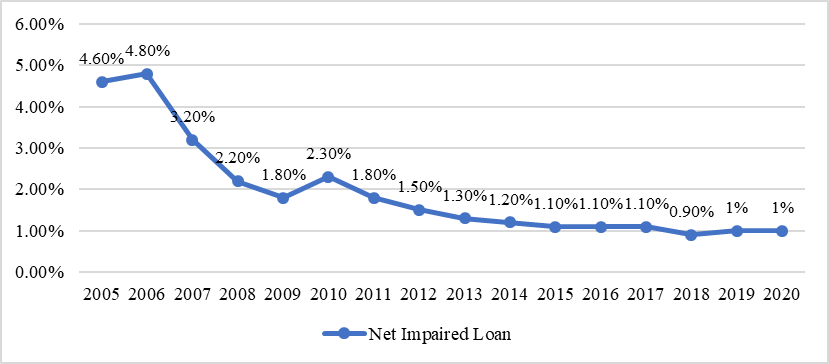
For Malaysia conventional banking sector, the net impaired loan show a down trend through 17 years. Figure 4 shows the Net impaired loan for conventional banking sector from 2005 to 2020. In 2005, the banking sector’s net impaired loan is 4.6%. It increased to 4.8% in 2006 and dropped continuously until 1.8% in 2009, then raise up again to 2.3% in 2010 and drop continuously until from 1.80% to 0.9% from 2011 to 2018. The net impaired loan ratio then increased to 1% in 2019 and 2020. Overall, the ratio has decreased from year to year after the financial sector blueprint. Before the financial Blueprint 2011-2020, the net impaired loan obviously shows a high percentage for this, it is bad if the percentage of net impaired loan become high means the banking sector faced more losses on their loan. After the blueprint announced, the percentage of net impaired loan become smaller which is below 2% from 2011 until 2020. Overall, the ratio has decreased from year to year after the financial sector blueprint. The target “Strengthen the foundations for a sound risk culture in the financial sector” in blueprint was achieved due to low net impaired loan ratio.
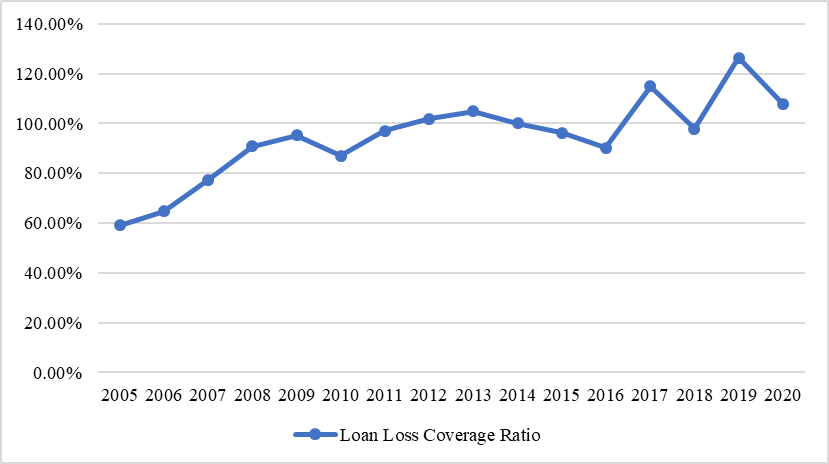
Loan loss coverage ratio represented the amount of loan loss that can be cover by the bank reserve. Figure 5 indicates the Loan loss coverage ratio for conventional banking sector from 2005 to 2020. The higher ratio means the higher ability to cover the loan loss. Before the Financial Blueprint 2011-2020, the loan loss coverage ratio was recorded at the lowest percentage at 59.2% in 2005 to the highest at 95% in 2009, then drop to 87% in next year and come back again to 97% in 2011. After the financial sector blueprint, the ratio continued to increase until 2013 then dropped to the lowest at 90.20% in 2016. After 2011, the loan loss coverage ratio reached the highest which is 126.40% in 2019. Compared to the years before the Financial Blueprint, the ratio performs well in these nine years, the banking sector are able to cover the most loan loss. The high affordability to the loan loss achieved the Blueprint target which is “Enhance avenues for risk management and instruments to manage risk exposures”.
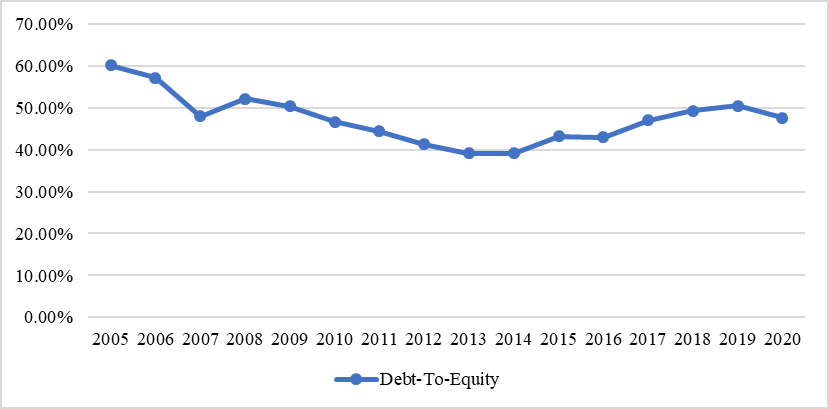
Figure 6 shows the Debt-to-equity ratio for conventional banking sector from 2005 to 2020. The overall trend for debt-to-equity ratio for conventional banking sector in 17 years show a decline trend from 2005 to 2013 then raise up slowly from 2014 to 2020. The debt-to-equity in 2005 is 60.1% with the highest result dropped to 48% in 2007. Next year, the ratio raised to 52.2% in 2008 then drop 44.4% in 2011. After the financial blueprint year, the debt-to-equity ratio drop continuously until 39.2% in 2014 and raise back to 50.50% in 2019 then slightly dropped to 47.60% in 2020. The ratio is analysis about the financial leverage level to the banking industry, the lower the ratio, the higher the banking sector can allocate their debt. The financial blueprint target “Strengthen the institutional structure of financial institutions to provide adequate safeguards against contagion risk and excessive leverage” may not too successful because of the debt-to-equity ratio raise up from 44.4% in 2011 to 47.60% in 2020.
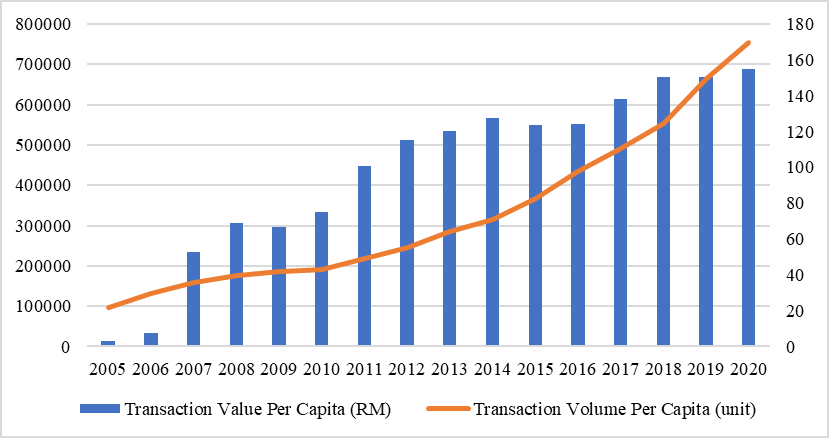
For the target “ Enhance the e-payments infrastructure through improvements and new services to further facilitate the adoption of e-payments” set by the Financial Blueprint 2011-2020, obviously this target has been achieved because the E-payment transaction value per capita in Ringgit Malaysia was increased continuously until the highest RM 687279 per capita in 2020 and the E-payment transaction volume per capita in unit also show a upward trend through 17 years analysis and reached the highest in 2020 with 169.9 unit per capita in the E-payment transaction. The result of increasing huge of the E-payment usage and transaction lead the electronic banking has been developed successfully. Figure 7 shows the E-payment for conventional banking sector from 2005 to 2020
The summary, on an average, Malaysia banking sector has a declining of Return on Equity, and Net Impaired Loan, and inclining of Total Capital Ratio, Debt-to-Equity and Transaction Value Per Capita (RM and Unit), while Return on Assets and Loan Loss Coverage Ratio is fluctuated (Table 1).
Ratio performance of top nine conventional banks
Table 2 indicates the summary data of ratios for top nine conventional banks. The table consists of the computation of five ratios, including dividend per share, earnings per share, total assets turnover, return on assets, and return on equity.
Dividend per share (DPS) can be defined as the number of declared dividend issued by a company for every ordinary share outstanding. DPS is calculated by dividing the total dividends paid out by a business, including interim dividends over a period of time, by the number of outstanding ordinary shares. Increasing in DPS indicates a strong performance to its shareholders. A consistent increase in this ratio gives confidence to the investors that the firm’s management team believes that its profit growth can be sustained. Before financial sector blueprint, BIMB Bank has the lowest DPS on average followed by Kenanga Investment Bank and Affin Bank. Maybank recorded the highest DPS at 0.58% in 2010. This is mainly due to the higher revenues in all key business segments supported by growth in loan. The improve achievement represent the success of Transformation journey implemented in 2008 that focus on 30 initiatives to improve their people, processes, and systems. After the issue of financial sector blueprint, it shows that almost all the banks have an increase in their DPS compared to before the blueprint although the DPS shows some decrease in 2020 due to the pandemic. The steady increase in DPS indicates that banks were having sound financial performance that allowed them to declare higher dividend to their shareholders. Figure 8 indicates the dividend per share for nine top conventional banks from 2005 to 2020.
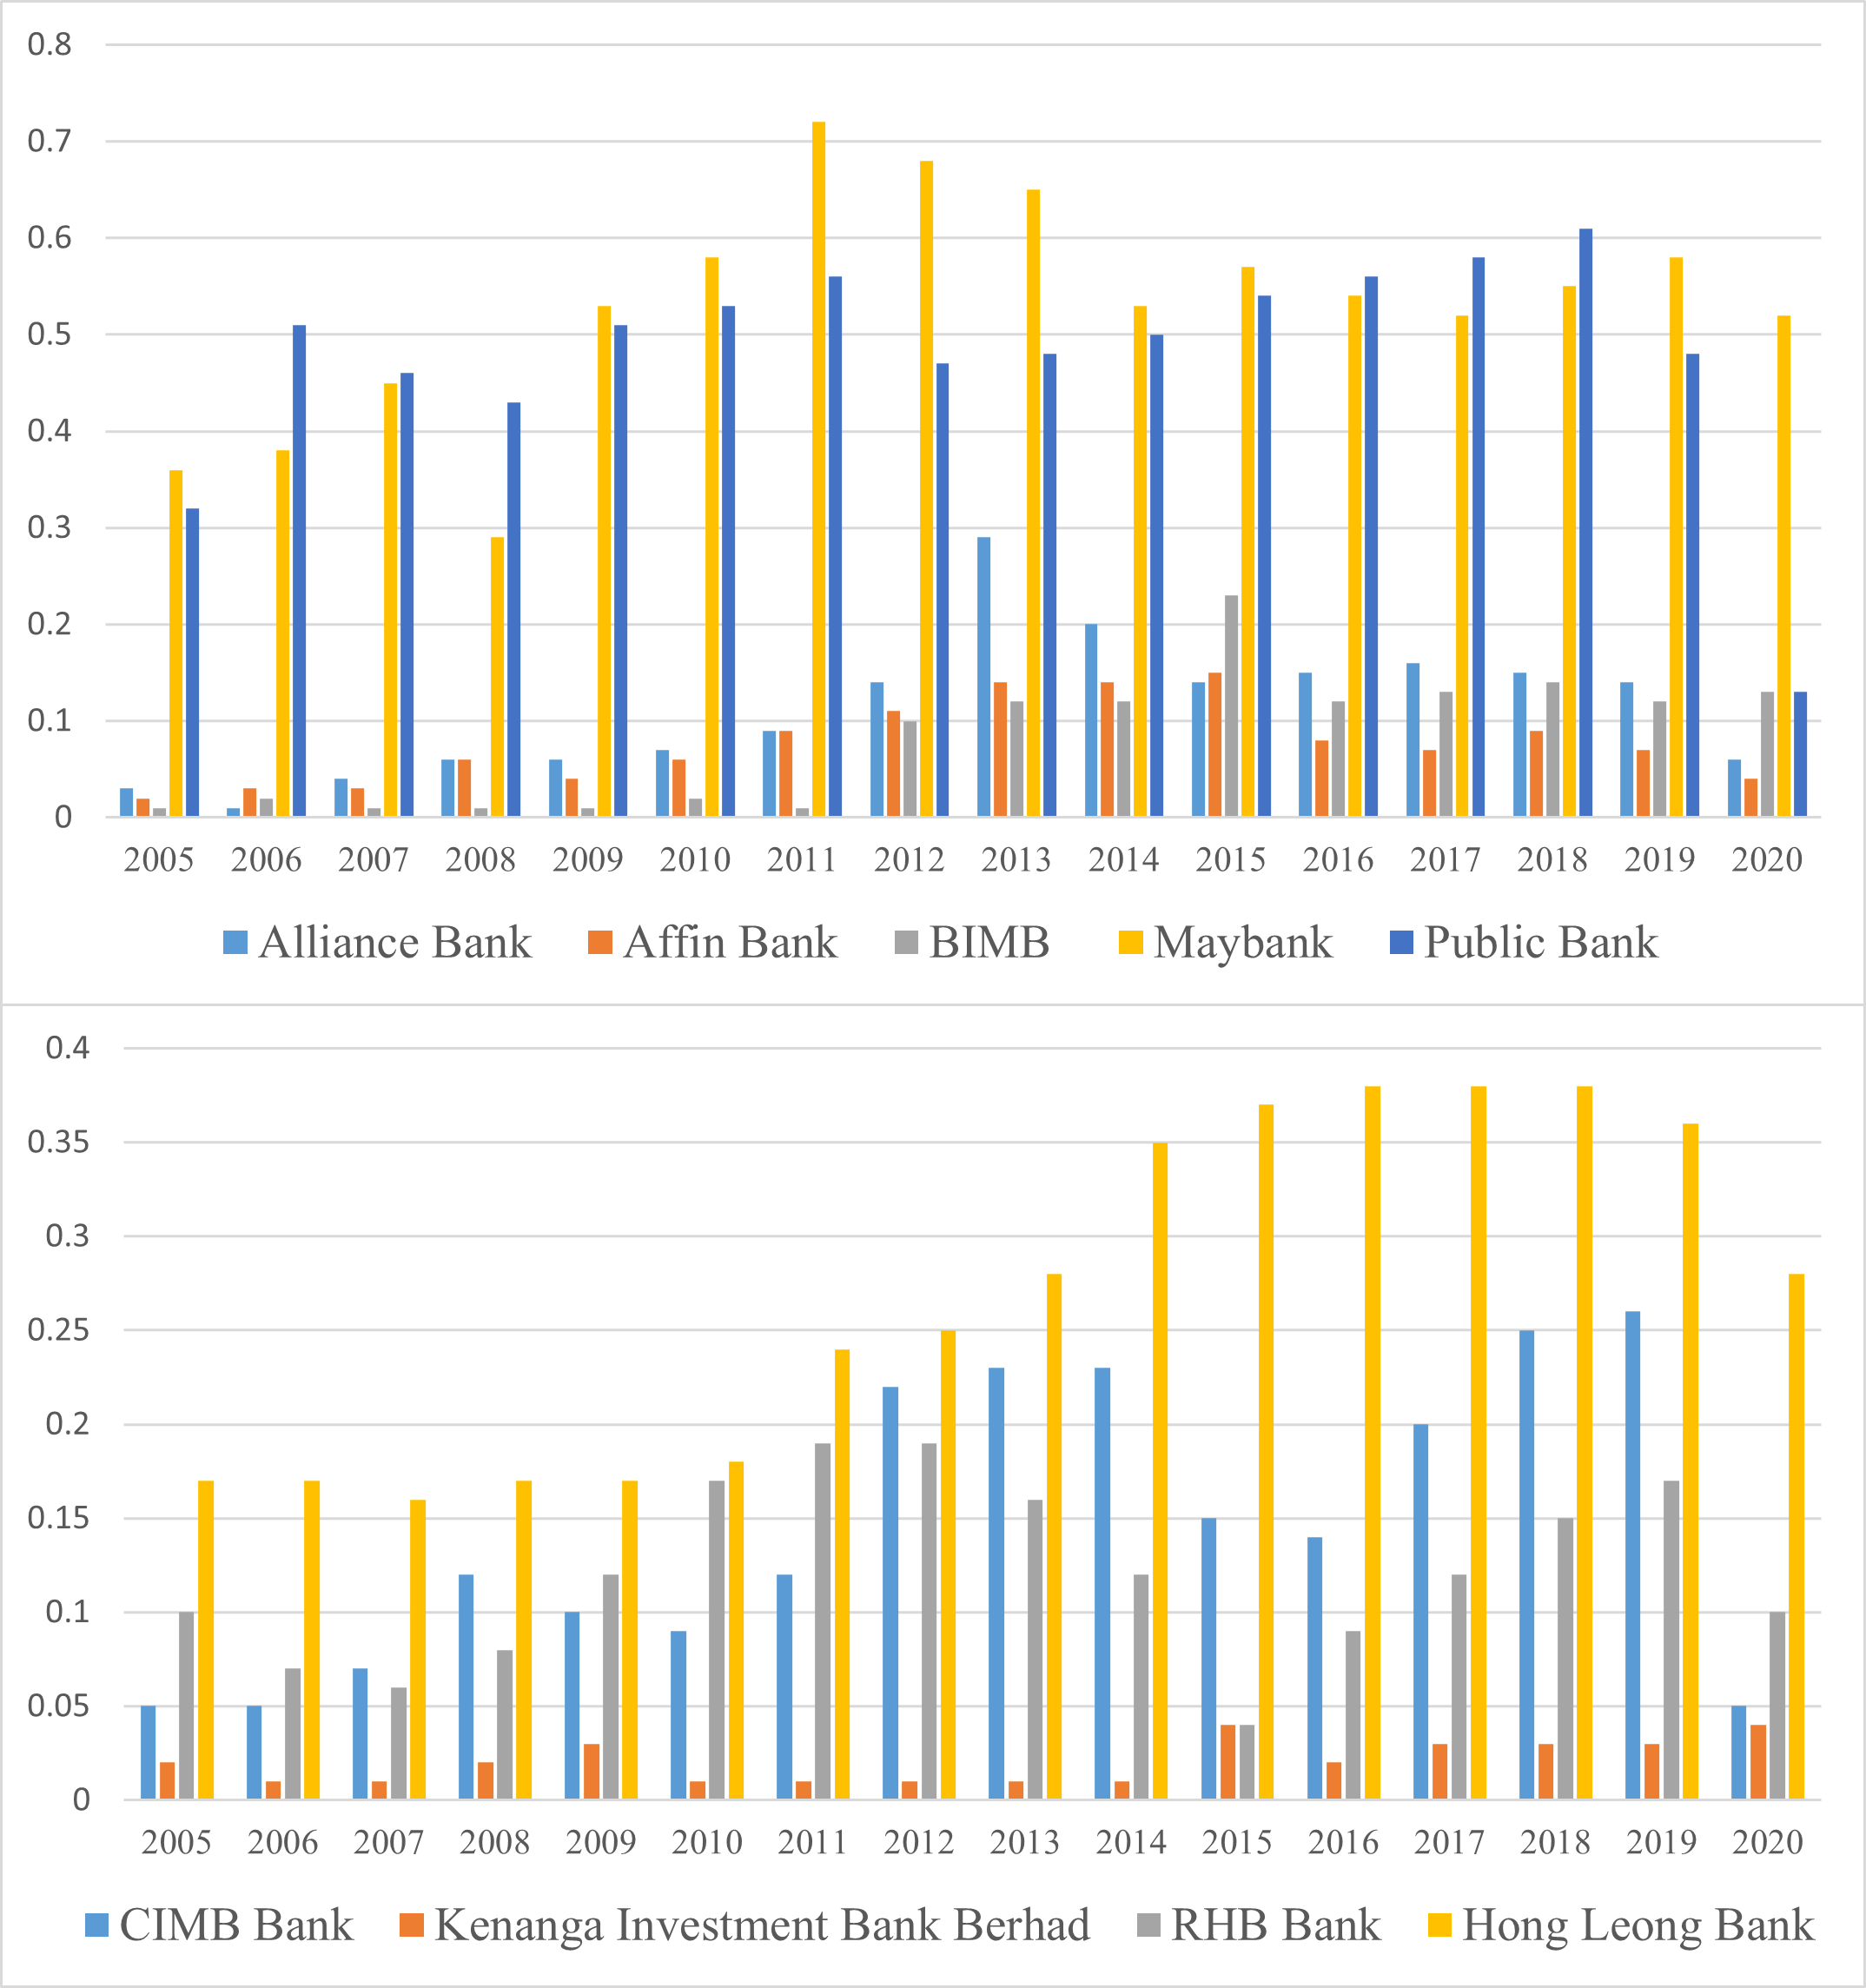
Return on Asset (ROA) can be defined as an indicator that show the profitability of the company earns in overall assets (Hargrave et al., 2019). This ratio measure about the efficiency of the company management to generate the profit from their company assets. Usually, it can be used to compare a company performance in term profit when comparing two or more company in similar size or same industry. When the return on assets shows a higher percentage, it shows the company is doing very well in managing their assets to generate more assets. Before financial sector blueprint from 2005 until 2010, return on assets for Alliance Bank, Affin Bank, Bank Islam Malaysia, Malayan Banking Berhad, Public Bank, CIMB Bank, Kenanga Investment Bank Berhad, RHB Bank, and Hong Leong Bank have a fluctuated ratio. Public Bank has the highest ratio of return on assets before blueprint in 2006 at 1.54% compared with other banks. This is because Public Bank struggle in their sales growth which make them have a higher return on asset. It also shows how the bank have a good team of management. However, Kenanga Investment Bank shows the lowest ROA in 2005 at -3.26%. This is due to the loss as a result of goodwill paid for acquisition. From 2011 until 2020, after the implementation of blueprint the return on assets show that all the bank has an increasing ratio because banks control their expenses. When banks earn more than expenses, then it can improve the return on assets of our banking sector. To control this situation all the banks must have a good approach to make an investment on the assets they hold. Figure shows the return on asset for nine top conventional banks from 2005 to 2020.
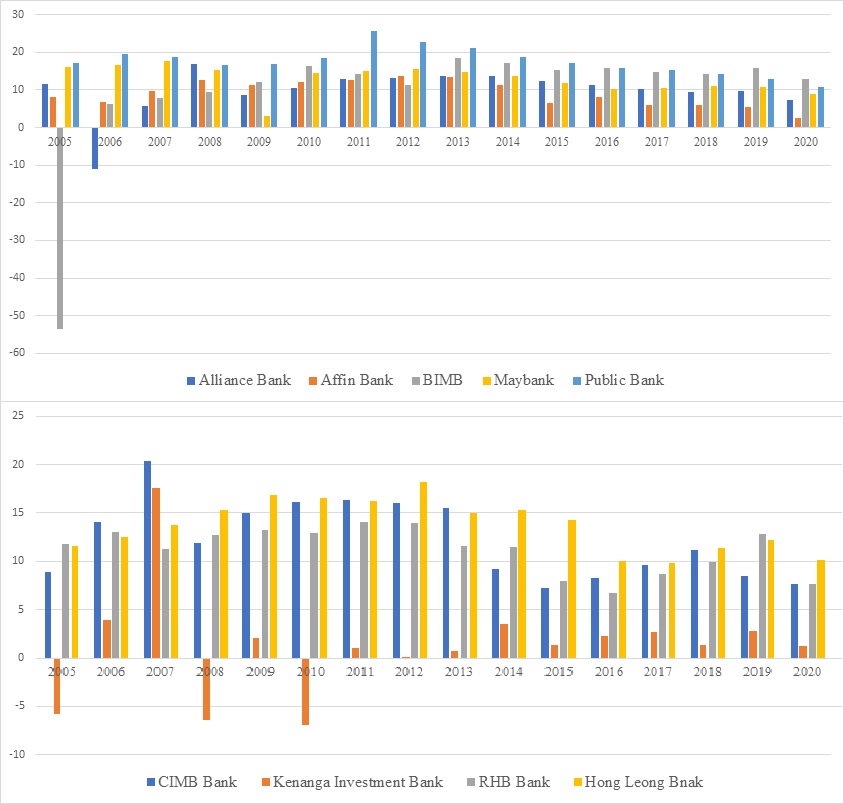
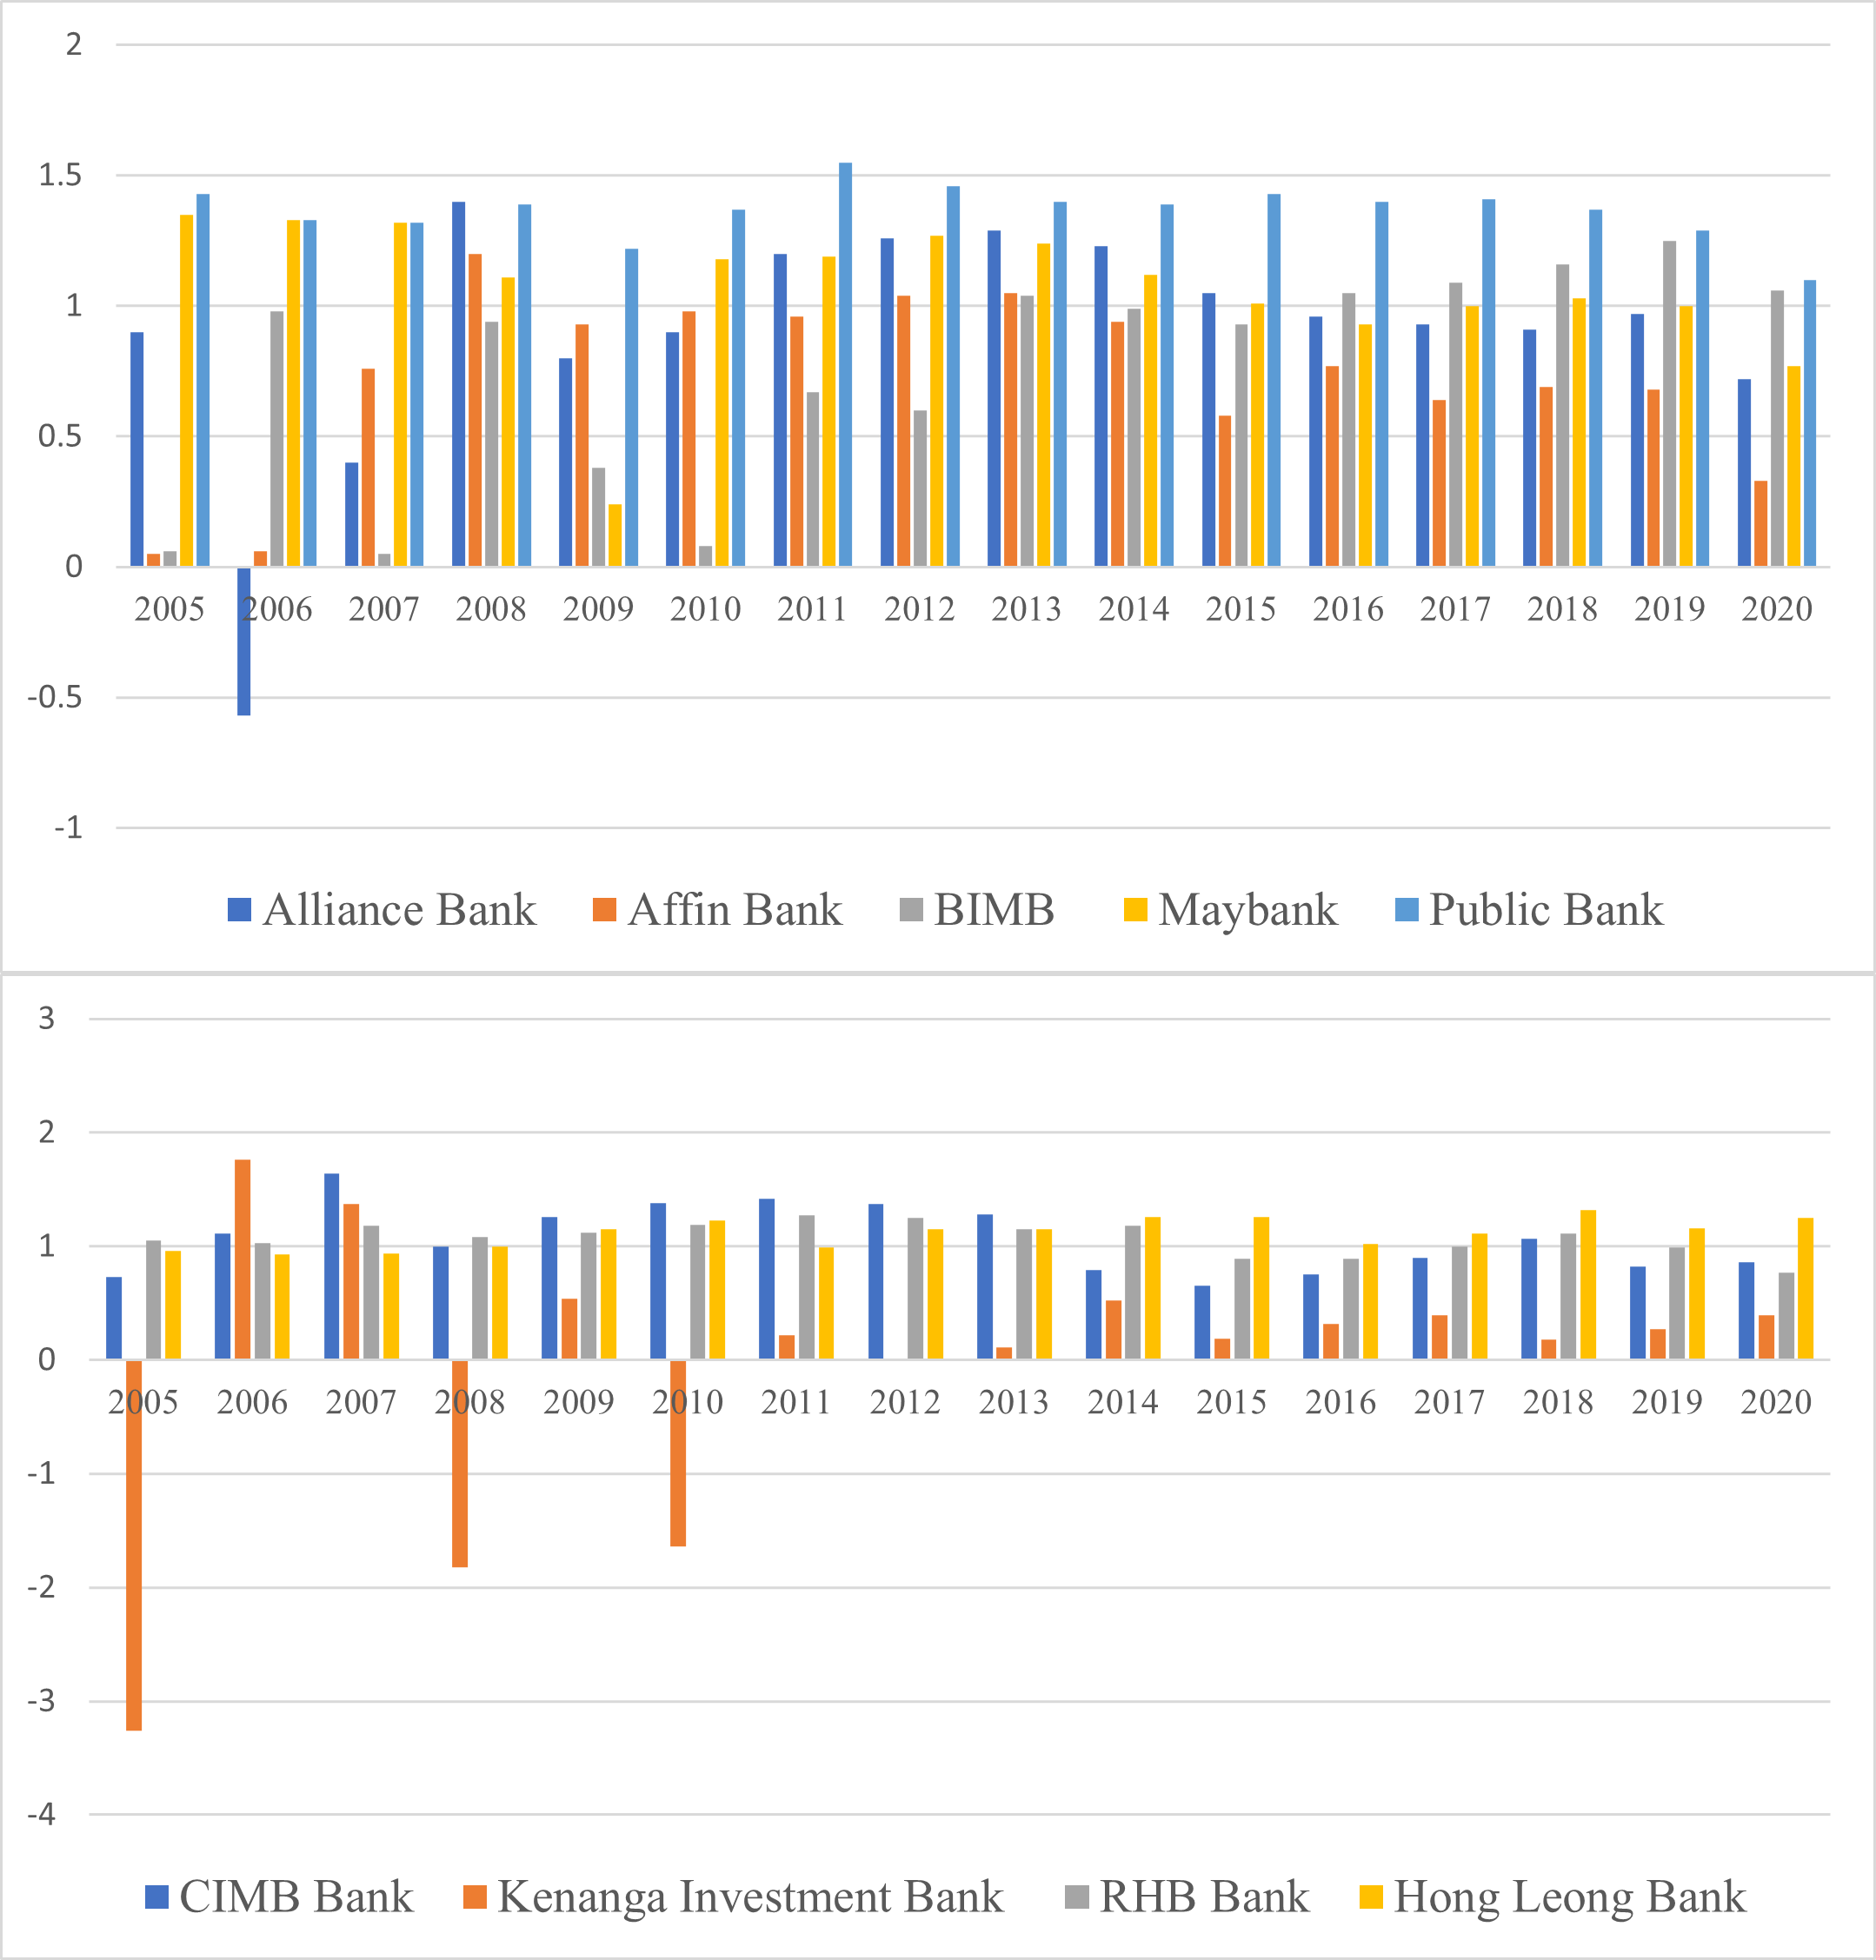
Return on Equity (ROE) is measured of the net income divided by shareholders’ equity. Normally it is shown as a percentage. ROE indicates how company is using its equity to grow the business. Higher ROE indicates the firm is good at generating shareholders’ value and increase productivity as well as profits. In contrast, poor ROE represents poor management decision on reinvesting capital. As shown above, Alliance Bank, BIMB, and Kenanga Investment Bank have relatively poor ROE performance from 2005 to 2010, before financial sector blueprint. BIMB has the lowest ROE at -53.64% in 2005 among the other banks. The bank registered a net loss of RM456.9 million during the year due to higher provision up to RM700.9 million allocated for non-performing financing by Bank Islam. After setting up a special purpose vehicle to cover the NPFs, it shows that ROE begun to recover in 2006. Alliance Bank recorded ROE at -10.90% in 2006 due to decline in operating profit as a result of lower large loans growth coupled with continuous pressure on lending margins and high loan and impairment losses due to prudent provisioning. From 2011 to 2020, all the banks show positive ROE which mean banks maintain their profits and shareholders’ funds and control their losses such as non-performing loan and impairment loss at the same time. A stable ROE increases public and investors’ confidence towards our banking sector.
Return on Equity (ROE) is measured of the net income divided by shareholders’ equity. Normally it is shown as a percentage. ROE indicates how company is using its equity to grow the business. Higher ROE indicates the firm is good at generating shareholders’ value and increase productivity as well as profits. In contrast, poor ROE represents poor management decision on reinvesting capital. As shown above, Alliance Bank, BIMB, and Kenanga Investment Bank have relatively poor ROE performance from 2005 to 2010, before financial sector blueprint. BIMB has the lowest ROE at -53.64% in 2005 among the other banks. The bank registered a net loss of RM456.9 million during the year due to higher provision up to RM700.9 million allocated for non-performing financing by Bank Islam. After setting up a special purpose vehicle to cover the NPFs, it shows that ROE begun to recover in 2006. Alliance Bank recorded ROE at -10.90% in 2006 due to decline in operating profit as a result of lower large loans growth coupled with continuous pressure on lending margins and high loan and impairment losses due to prudent provisioning. From 2011 to 2020, all the banks show positive ROE which mean banks maintain their profits and shareholders’ funds and control their losses such as non-performing loan and impairment loss at the same time. A stable ROE increases public and investors’ confidence towards our banking sector. Figure 10 shows the return on equity for nine top conventional banks from 2005 to 2020.

Discussion
The Financial Stability Board (FSB) announced in 2011 under the title 'Strengthening the Future' a goal to be achieved by the financial sector in terms of high value-added, which should improve its stability, effectiveness, and competitiveness in performing its intermediary function for economic growth to generate a high-income economy over the period. Continuing efforts of the banking sector to strengthen the financial system by enhancing their risk management and governance framework. Based on the data analysis performances of the conventional banking sector in Malaysia in terms of financial development, it can be seen that the trend of each selected conventional bank's financial position is volatile.
The financial performance of Alliance Bank improves as a result of the financial sector blueprint. Utilising its reputation for stability, the bank will transform into a growth-oriented enterprise in 2011. In 2018, the bank recorded a 7.0% increase in revenue, the highest increase in the previous five years. By emphasising the bank's fundamental strength, Alliance Bank continued to generate positive financial results. In accordance with the framework for the financial sector, Alliance Bank plays a vital role in driving our nation's transformation plan. They support government initiatives to strengthen Malaysia's position as an Islamic financial centre and to assist SMEs in becoming the engine of economic development by boosting the company's revenue growth. Expand Alliance Bank's transaction banking, wealth management, and investment banking in order to generate sustainable profit growth. Through risk-based pricing, stratification of mortgages into categories of risk segments, and increased collections capacity, the bank effectively strengthens their risk management, which is essential for the development of a competitive financial system.
Based on Affin Bank's data analysis from 2005 to 2020, the trends of financial development in terms of return on assets exhibit volatility with very small differences between years. Moreover, they have increased their network presence in order to facilitate a greater level of consumer engagement through the exercise of greater product and service customization. In 2020, Affin bank's profit before taxes decreased by 42.9% compared to 2019. This is primarily attributable to higher allowances for credit losses, higher operating expenditures, and an approximately RM80 million modification loss related to Covid-19 relief measures. In contrast, Affin bank's net income increased by 18.3% in 2020 compared to 2019 due to an increase in non-interest income, particularly from financial instruments. In 2021, the bank was anticipated to be generally stable in terms of financial and economic expansion.
Bank Islam Malaysia Berhad (BIMB) encountered a rise in their overall financial performance. The bank launched a new corporate strategic plan titled 'Hijrah to Excellence' the year following the blueprint for the financial sector in order to strengthen its foundations until 2015. BIMB has introduced new products, such as investment accounts based on Wakalah and Al-Awfar accounts based on Mudharabah, to satisfy the requirements of businesses that contribute to the growth of our financial system. To improve capital and liquidity management, they are attaining the optimal mix of deposits, accumulating sufficient high-quality liquid assets ("HQLA"), and maintaining stable cash flows from retail, SME, and corporate customers. In 2018, the bank's greatest pre-zakat and tax earnings surpassed RM1 million. In the same year, BIMB won awards such as 'Highest Growth in Profit After Tax Over Three Years'. BIMB has introduced two funds, BIMB-Arabesque Asia-Pacific and BIMB Sukuk, to promote innovation and impact within the social finance sector in accordance with the FSB.
Concerning Maybank's financial growth from 2005 to 2020, there are a number of accomplishments. Market capitalization strength and the balance sheet have contributed to the financial development that has improved the organization's fundamental performances, as evidenced by the addition of value to Maybank's 2018 results, which include an increase in net operating income, pre-provision operating profit, and net profit. In 2020, Maybank's net income decreased by 20.9% compared to 2019 as a result of higher net impairment losses. However, the losses were mitigated by increased NOI and decreased operating expenses. Due to the volatility of the financial market and commodity prices, it is progressively more difficult to predict the financial development. Maybank has adhered to the T.I.G.E.R value and function that supports decision making, balancing objectives to guarantee the sustainability of the services provided in the financial market, in order to add high value to its performances. As a result of the pandemic, the rate of economic growth slowed in 2020 compared to the previous year.
Before and after the publication of the financial sector framework, Public Bank's financial performance was relatively stable. Good asset quality by reducing the gross impaired loan ratio from 1.4% in 2007 to 0.9% in 2011 as well as robust balance sheet growth (stable loan/deposit ratio) and an increase in market capitalization from RM11 million in 2007 to RM13.38 million in 2011 have a positive effect on financial performance. As a consequence, the bank's financial ratios continue to improve. In accordance with the strategy for the financial sector, Public Bank prioritises cost-effectiveness initiatives in pursuit of higher productivity levels, which has enabled the bank to generate exceptional shareholder returns. The bank successfully doubled its net profit attributable to shareholders, loans, and consumer deposits in 2011. This accomplishment is followed by the bank's fee-based revenue strategy, which promotes greater regulatory capital efficiency and reduced capital costs. In 2019, the bank will maintain its competitive position by enhancing its cost efficiency and asset quality, thereby enhancing its financial health and effectively stabilising the Malaysian financial system.
From 2005 to 2020, CIMB Bank also displays a positive trend in their financial development. As a consequence of mergers and acquisitions that increased their franchise value, CIMB exhibited a strong performance in 2011. In 2018, CIMB Commercial Bank demonstrates a robust performance as a result of concerted efforts to re-calibrate the services by reducing operating expenses, while continuing to pursue high levels of sustainability to ensure that the economic environment and services value can be enhanced. The return on assets exhibits value volatility due to unanticipated market conditions, even as the bank increases its productivity and efficiency. In 2020, CIMB's performance declined as a result of the pandemic, higher provisions prompted by management overlays, and a higher provision across the region for its commercial banking division.
Prior to the financial sector blueprint, Kenanga Investment Bank's financial ratios were negative. After the establishment of the FSB, the bank's financial performance improved. Although the financial ratios are considerably lower than those of other institutions. 2013 saw the highest return on assets and return on equity, with respective results of 0.52% and 3.54%. In 2015, the greatest dividend per share was only 0.04%. Overall, the bank's financial status is sufficient to support its operations, but it does not meet the financial sector blueprint's objective of contributing to a high-value-added financial system and economy.
In terms of financial development, Hong Leong Bank has also made progress between 2005 and 2020 but has not yet met the target of a high value-added and high-income economy. According to the data analysis of Hong Leong Bank's financial position, the value of the return on assets ratio is volatile. Nonetheless, Hong Leong Bank's economy remains fundamentally sound and in excellent shape, supported by domestic demand and export growth. As for RHB Bank, this bank demonstrates that, in terms of financial development, value-adding activities are still ongoing in 2020 using a value-creating business model, whose primary objective is to address the most critical and material aspects in the. In terms of economic expansion, In general, RHB Bank's economic activities will be at a moderate level in 2020 compared to 2019, when large advanced economic activities grew at a rapid rate.
On the other hand, looking at the overall impact of the reforms on the conventional banking sector efficiency based on the study analysis, total capital ratio, net impaired loan, loan loss coverage ratio, E-payment transaction value and debt service ratio have achieved the financial blueprint target. However, ROA, ROE and debt-to-equity does not achieve the financial blueprint target. There are some effects of bank’s characteristics on efficiency can be drawn. In addition, the analysis indicate that banks’ capitalization (equity) is highly related with the efficient management of cost, technical, scale and allocation for conventional banks. The results also shows that an efficient bank use less leverage compared to other banks. This result is corresponded with the study of Ahmad Mokhtar et al. (2007) who believe that the ratio of equity to assets will positively affects technical and cost efficiency. Another study that agrees with positive relationship between equity and bank efficiency levels also found by Noor and Ahmad (2012).
The return on equity ratio of conventional banks did not meet the financial blueprint's objective because some commercial banks in Malaysia may have made poor reinvestment decisions or failed to generate sufficient income. A bank may acquire new assets with debt without repurchasing its stock. If net income increases, return on equity will also increase. However, when a bank repurchases its own shares, the debt can hinder the bank's performance and reduce return on equity to a halt. If the bank writes down its assets because they are overvalued, the return on equity will also increase. Consequently, as the total asset value of a bank decreases, so does the proprietors' equity. If the income remains unchanged, the bank's return on equity will increase despite the fact that the bank has not altered anything other than its recordkeeping. The study demonstrates a negative relationship in terms of ROA between conventional bank profitability and cost, technical, and pure technical efficiency. This is primarily due to the Malaysian pattern of efficacy levels (Mohd Zamil, 2007). Thus, the more efficient banks will experience a diminishing return on scale. As a result, the increased cost will reduce the profit of efficient institutions.
Technical efficiency is the primary factor influencing the cost-effectiveness of conventional Malaysian institutions. This demonstrates that the adoption of technology will generate profits but not an efficient use of resources. This indicates that the findings characterise explicitly how a company generates incomes using IT and electronic processes. However, conventional banks should use their resources more effectively to generate more income and enhance their international competitiveness. The results demonstrate a correlation between the size of conventional banks and their cost, technical, scale, and allocation efficacy. This indicates that the larger bank has a greater chance of obtaining greater efficiency. The logic behind this statement is that larger conventional banks will have more capital available to incorporate new technology that will increase their incomes and decrease their management expenses. This finding is consistent with those of Ahmad Mokhtar et al. (2008), who discovered a positive relationship between bank size and technical and cost efficacy.
According to the findings, conventional commercial banks' loan quality has a positive correlation with cost, technical, and pure technical efficiency. The findings suggest that conventional banks with a higher loan loss coverage ratio were more efficient. These results are comparable to those of Ahmad Mokhtar et al. (2008), who discovered a positive loan quality coefficient for cost and technical efficiency. The rise in write-offs would explain why nonperforming loans have not increased in tandem with loss provisions. A bank's net impaired loan rates can be reduced by aggressively writing off poor loans, which effectively reduces the numerator of the non-performing loan ratio.
Guidelines for the forthcoming Malaysian financial sector blueprint
On the basis of the study's discussion and findings, the following recommendations can be made for the forthcoming framework for Malaysia's financial sector in order to improve banking efficiency:
The study emphasises the significance of enhancing frameworks for risk management and governance in the financial industry. The forthcoming plan should emphasise the implementation of robust risk management practises, such as the effective surveillance of credit quality, the provisioning for potential losses, and the establishment of sound governance structures within banks (Said et al., 2016).
According to the study, institutions that emphasised sustainable profit growth had favourable financial outcomes. The forthcoming plan should encourage banks to implement revenue-generating strategies, such as expanding transaction banking, wealth management, and investment banking services. This can contribute to long-term profitability and increase the financial industry's overall efficiency.
The study highlights Bank Islam Malaysia Berhad's (BIMB) introduction of innovative products and services to support the expansion of the financial system. The forthcoming blueprint should encourage banks to develop and offer innovative Islamic financial products and services that address the changing requirements of businesses and contribute to the financial sector's overall growth.
The study emphasises the significance of cost-effectiveness initiatives in promoting higher levels of productivity. The forthcoming plan should encourage banks to prioritise cost effectiveness while maintaining a strong emphasis on asset quality. This can be accomplished by optimising operational processes, leveraging technology for automation, and instituting effective credit risk management practises, among other measures.
The findings indicate that mergers and acquisitions have a positive effect on financial performance. The upcoming blueprint should encourage collaboration and partnerships between banks to cultivate synergies, improve operational efficiency, and boost the banking industry's competitiveness. This can be accomplished through strategic alliances, joint ventures, and initiatives to share infrastructure.
The study indicates that the financial blueprint goal for e-payment transaction value has been met. The forthcoming plan should prioritise the promotion of digitalization and the adoption of e-payment solutions throughout the financial industry. This can contribute to the development of a modern and technologically advanced financial system by enhancing efficacy and decreasing transaction costs (Oladapo et al., 2022).
According to the research, banks with higher capitalization and equity levels tend to be more efficient. The upcoming plan should encourage banks to maintain healthy capital positions and increase their equity basis. This can be accomplished via prudent capital management, the maintenance of adequate capital buffers, and the attraction of investments that support growth and stability.
The study emphasizes the positive correlation between loan quality and efficiency. The forthcoming plan must emphasise the significance of maintaining high loan quality standards and adequate provisioning procedures. This can be accomplished through efficient credit assessment procedures, regular loan portfolio monitoring, and prompt provisioning for potential credit losses.
According to the findings, a competitive environment increases the efficiency of conventional institutions. Promoting competition in the banking sector, encouraging new entrants, and cultivating a level playing field should be the focus of the forthcoming plan. This can spur innovation, improve service quality, and increase the overall efficacy of a bank.
The study highlights the significance of monitoring and evaluating the performance of banks relative to the financial sector blueprint's objectives. The forthcoming plan should establish performance evaluation mechanisms, including key performance indicators and benchmarks. This will allow policymakers to evaluate the efficacy of policy reforms, identify areas for refinement, and inform the creation of future blueprints.
Therefore, by incorporating these guidelines into the upcoming blueprint for the Malaysian financial sector, policymakers and the government can work towards attaining improved banking efficiency, a robust financial system, and sustainable economic growth.
Conclusion
In conclusion, the purpose of this study was to evaluate the performance of the Malaysian financial sector blueprint from 2011 to 2020 in attaining bank efficiency. The analysis of the financial development of selected conventional banks revealed both positive and volatile trends in their financial positions. The study offers insightful information on the financial development and performance of a few Malaysian conventional banks, as well as how well they match with the goals outlined in the financial sector blueprint.
Based not the ratio analysis of this study, the financial performance of Alliance Bank improved, highlighting stability and revenue growth. They were instrumental in advancing the nation's transformation plan, supporting initiatives to strengthen Malaysia's position as an Islamic financial centre and aiding SMEs. Affin Bank's financial development was volatile in 2020, as the bank's profit decreased due to higher provisions for credit losses and operating expenses. Through strategic initiatives, product diversification, and enhanced capital and liquidity management, Bank Islam Malaysia Berhad (BIMB) exhibited improved financial performance. Maybank demonstrated success, but its net income decreased in 2020 due to a rise in impairment losses. The financial performance of Public Bank remained stable, with a focus on cost-effectiveness and asset quality. CIMB Bank demonstrated positive financial growth, despite the impact of market conditions on its performance. After the financial sector blueprint, Kenanga Investment Bank enhanced its financial performance, but fell short of contributing to a high-value-added financial system. Hong Leong Bank made financial development advancements, whereas RHB Bank continued its value-added activities. Therefore, certain indicators, such as total capital ratio, net impaired loan, loan loss coverage ratio, E-payment transaction value, and debt service ratio, met the objectives of the financial blueprint, according to the study. However, ROA, ROE, and debt-to-equity ratios did not meet expectations. Such bank characteristics as capitalization and leverage had a substantial impact on efficiency. Poor reinvestment decisions, decreased net income, and asset write-downs had a negative impact on the return on equity.
The implications of the study's findings for policymakers and institutions are discussed. Enhancing banking efficiency requires strengthening risk management and governance frameworks, concentrating on sustainable profit growth, promoting innovation in social finance, and enhancing cost efficiency and asset quality. Future research ought to investigate comparative analysis, the effect of digitalization, macroeconomic factors, customer-centric strategies, and green banking initiatives. It is essential to acknowledge the study's limitations, such as its narrow focus on selected institutions in Malaysia, the limited availability of data, and the need for more extensive samples and detailed data. Despite these limitations, the study provides valuable insights into the financial performance and evolution of Malaysian banks and contributes to improving banking efficiency and nurturing a robust financial sector.
Acknowledgement
We acknowledge the support of the Kolej Universiti Poly-Tech MARA for conducting this research, with funds provided by project grant (Grant No. KUPTM.DVCRI.RMC.15 (24)).
References
Abdurraheem, A. A., Alam, M. M., Oladapo, I. A., & Abdurraheem, I. I. (2023). Macro-Economic Environment and Credit Risk of Islamic Banking in a Dual Banking System: Evidence from Malaysia and Indonesia. International Journal of Business and Globalisation. Forthcoming.
Acharya, V. V., & Yorulmazer, T. (2007). Too many to fail—An analysis of time-inconsistency in bank closure policies. Journal of financial intermediation, 16(1), 1-31.
Alam, M. M., Hoque, M. N., & Muda, R. (2023). Assessment of the Sharīʿah requirements in the Malaysian Islamic Financial Services Act 2013 from the managerialism and Maqāṣid al-Sharīʿah perspectives. Journal of Islamic Accounting and Business Research.
Ali, K., Akhtar, M. F., & Ahmed, H. Z. (2011). Bank-specific and macroeconomic indicators of profitability-empirical evidence from the commercial banks of Pakistan. International Journal of Business and Social Science, 2(6), 235-242.
Allen, F., Carletti, E., Goldstein, I., & Leonello, A. (2015). Moral Hazard and Government Guarantees in the Banking Industry‡‡. Journal of Financial Regulation, 1(1), 30-50.
Almazari, A. A. (2011). Financial performance evaluation of some selected Jordanian commercial banks. International Research Journal of Finance and Economics, 68(8), 50-63.
Arzu, T., & Gokhan, G. (2005). Asset and Liability management in financial crises. The Journal of Risk Finance, 6(2), 35-49.
Bank Negara Malaysia. (2011). Strengthening Our Future. Financial Sector Blueprint Report 2011–2020. http://www.bnm.gov.my/files/publication/fsbp/en/BNM_FSBP_FULL_en.pdf
Brei, M., & Schclarek, A. (2013). Public bank lending in times of crisis. Journal of financial stability, 9(4), 820-830.
Calderon, C., & Schaeck, K. (2016). The effects of government interventions in the financial sector on banking competition and the evolution of zombie banks. Journal of Financial and Quantitative analysis, 51(4), 1391-1436.
Casu, B., & Molyneux, P. (2003). A comparative study of efficiency in European banking. Applied economics, 35(17), 1865-1876.
Duncan, E., & Elliott, G. (2004). Efficiency, customer service and financial performance among Australian financial institutions. International Journal of bank marketing, 22(5), 319-342.
Gitman, L. J. (2009). Introduction to managerial finance. Prentice Hall, a division of Pearson Education, Inc.
Gropp, R., & Vesala, J. (2004). Deposit Insurance, Moral Hazard and Market Monitoring*. Review of Finance, 8(4), 571-602.
Hargrave, J. M., Pearce, P., Mayhew, E. R., Bull, A., & Taylor, S. (2019). Blast injuries in children: a mixed-methods narrative review. BMJ paediatrics open, 3(1).
Hussien, M. E., Alam, M. M., Murad, M. W., & Wahid, A. N. M. (2019). The performance of Islamic banks during the 2008 global financial crisis: Evidence from the Gulf Cooperation Council countries. Journal of Islamic Accounting and Business Research, 10(3), 407-420.
James, K. (2013). What are the types of financial ratios used to analyze financial performance. African Journal of Business Management, 5(35), 235-269.
Luckham, W. R. (1982). Financial Ratio Analysis for Decision-Making. Arboriculture & Urban Forestry, 8(11), 296-301.
Madhura, J. (2009). Financial markets and Institutions (7th Ed.). USA: Thomson South Western.
Mohd Zamil, N. A. (2007). Efficiency of Islamic and conventional commercial banks in Malaysia (2000-2004): A data envelopment analysis (DEA) study. Unpublished Master Thesis). International Islamic University Malaysia, Kuala Lumpur.
Mokhtar, H. S. A., Abdullah, N., & AlHabshi, S. M. (2007). Technical and cost efficiency of Islamic banking in Malaysia. Review of Islamic Economics, 11(1), 5-40.
Mokhtar, H. S. A., Abdullah, N., & Alhabshi, S. M. (2008). Efficiency and competition of Islamic banking in Malaysia. Humanomics, 24(1), 28-48.
Noor, M. A. N. M., & Ahmad, N. H. B. (2012). The determinants of Islamic banks’ efficiency changes: Empirical evidence from the World banking sectors. Global Business Review, 13(2), 179-200.
Oladapo, I. A., Hamoudah, M. M., Alam, M. M., Olaopa, O. R., & Muda, R. (2022). Customers' perceptions of FinTech adaptability in the Islamic banking sector: comparative study on Malaysia and Saudi Arabia. Journal of Modelling in Management, 17(4), 1241-1261.
Said, J., Alam, M. M., & Khalid, M. A. (2016). Relationship between good governance and integrity system: Empirical study on the public sector of Malaysia. Humanomics, 32(2), 151-171.
Shoaib, A. (2011). Measuring performance through capital structure: Evidence from banking sector of Pakistan. African Journal of business management, 5(5), 1871-1879.
Tarawneh, M. (2006). A comparison of financial performance in the banking sector: Some evidence from Omani commercial banks. International Research Journal of Finance and Economics, 3(3), 101-112.
Widarjono, A., Alam, M. M., Atmadji, E., Suseno, P., & Artiani, L. E. (2023). The asymmetric exchange rate pass-through to inflation in the selected ASEAN countries. Bulletin of Monetary Economics and Banking, 26(1), 105-124.
Copyright information

This work is licensed under a Creative Commons Attribution-NonCommercial-NoDerivatives 4.0 International License.
About this article
Publication Date
15 November 2023
Article Doi
eBook ISBN
978-1-80296-130-0
Publisher
European Publisher
Volume
131
Print ISBN (optional)
-
Edition Number
1st Edition
Pages
1-1281
Subjects
Technology advancement, humanities, management, sustainability, business
Cite this article as:
Alam, M. M., Said, J., Ghapar, F., & Tahir, H. M. (2023). Assessment of Financial Sector Blueprint to Achieve Banking Sector Efficiency in Malaysia. In J. Said, D. Daud, N. Erum, N. B. Zakaria, S. Zolkaflil, & N. Yahya (Eds.), Building a Sustainable Future: Fostering Synergy Between Technology, Business and Humanity, vol 131. European Proceedings of Social and Behavioural Sciences (pp. 875-895). European Publisher. https://doi.org/10.15405/epsbs.2023.11.72