
Ideal Leverage via Machine Learning: Avoiding Financial Distress


Abstract
The capital structure stated the leverage ratio and the liquidity position of the company varies based on the economic or country-specific conditions and have a significant effect on the image and profit of the companies to avoid financial distress. Besides, age of the company and the marketing expense return to profit is still a dilemma. This study investigates the leverage ratio and liquidity as acid-test ratio and cash ratio besides the age and marketing expense effect on profit for the companies in food, chemistry, and metalware sectors listed on the Istanbul Stock Exchange (B.I.S.T.) for the period between Jun.2007-Sept.2022. The purpose of this study is to find out the realized leverage and liquidity ratios to ideal thresholds and the margin of company age and marketing expense/sales ratios for generating profit by using the supervised machine learning algorithm KNIME Analytics Platform (The Konstanz Information Miner). A successful model is conducted by using Random Forest Learner and Gradient Boosted Trees Learner Algorithms.
Keywords: Firm Performance, Financial Ratios, Firm Age, Marketing Expenses, Profit
Introduction
Financial distress is a big worry to every business since it is the severe symptom of bankruptcy. Thus, the main target of every business is to make profit from their operations to survive in the long run (Innocent et al., 2013). Profitability is also crucial for employees and society, where the business organization provides sustainability and stability for both. External users such as investors, creditors, tax authorities also benefit from profitability besides managers and shareholders. Therefore, it is very important to define the factors that affect profitability. Scant attention has been paid to these factors in developing countries since the emerging markets are more fragile than the developed ones (Alarussi & Alhaderi, 2018).
Profitability and the success of managerial decisions depend on the ability to identify elements that can be used to increase performance. Financial performance indicators, especially financial ratio analysis, have become important for company management and other stakeholders to evaluate financial productivity and profit potential (Lumbantobing & Salim, 2021). Leverage and liquidity are two important ratios subject to financial ratio analysis. The financial leverage determines the financial risk level of the firm and has a direct and significant effect on profit (Chang et al., 2019). When leverage is kept at its optimal level the cost of capital decreases at its minimum and the value of the company increases at its maximum level. However, firms rely on different optimal leverage ratios due to country specific and business specific factors (Segal & Ólafsson, 2023). Liquidity ratio needs a delicate balance to achieve profit like leverage ratio. The liquidity should be neither excessive nor inadequate. Excessive liquidity is the sign of idle funds, but inadequate liquidity hampers the image of the company in the market and may interrupt the production process (Vintilă & Nenu, 2016).
Institutional factors also effect profitability. Age of the company is one of the most controversial factors. It is suggested that companies have a life cycle like living organisms which is shared by Gardner in 1965 as life cycle analogy in which living organisms lose power when they get older. On the contrary, some researchers claim that older the company, more financial trace and market experience should be considered as benefits of the company (Ilaboya & Ohiokha, 2016). Another dilemma is the impact of marketing expenses on profit. Marketing expenses is expected to attract the customers by meeting their needs and desires. When marketing strategies and tools are not successful to do so, customers will lose interest to the firm’s products which reflects the sale turnover and results as decrease in profit (Valentyn & Pavlov, 2017). Percentage of marketing expenses to sales is mostly used to determine marketing budgets. Depending on the industry and company size marketing expense allocations can range from %1 to %30. New companies even can extend it up to %50 of sales for the first year (Tudose & Alexa, 2017). Since the effect of these factors on profit varies based on the country-specific factors, companies need to know the threshold values of these variables and their interaction with each other for better financial planning. The study will contribute to literature by extending the understanding of firm performance with a holistic approach.
Our study aims to determine the extent to which leverage ratio, liquidity ratio, marketing expense-to-sales ratio, and age of the company impact the profitability of listed manufacturing companies on the BIST (Istanbul Stock Exchange) in the food, chemistry, and metalware sectors. We analyze a total of 90 companies over the period from June 2007 to September 2022. Using artificial intelligence algorithms, we identify the threshold values of leverage, liquidity, and marketing expense-to-sales ratio that generate profitability, as well as the interaction between these variables.
The specific findings for these variables, as well as the impact of age on profitability, will serve as a benchmark for manufacturing companies in Turkey, in addition to contributing to the existing literature. It is important to note that the financial conditions of these companies may differ from those in developed countries, and thus, the results will provide valuable insights for decision-makers regarding the threshold values of these variables in developing countries.
This paper is organized as follows. Section 2 gives literature review, Section 3 describes the methodology, Section 4 reports the findings, Section 5 concludes.
Literature Review
Many studies related to effect of leverage and liquidity on profit have been conducted and conflicting results are obtained. Kalash (2023), Alarussi and Alhaderi (2018) found a negative relationship between leverage and profitability but Ripaluddin et al. (2023), Ansari (2020), Kartiningsih and Daryanto (2020) found that both leverage and liquidity have positive effect of profit. However Vintilă and Nenu (2016), Abdillah et al. (2016) found negative effect of liquidity on profit.
Firm age studies also have heterogeneous results. Ilaboya and Ohiokha (2016), showed a positive relation between firm age, firm size, and profitability. Akben-Selcuk (2016), Samosir (2018) found positive impact of firm age on profit but Coad et al. (2013) found negative relation between firm age and profitability. These studies show the relation between firm age and profit but the age of pooled firms and the margin of derivation for achieving profit is not considered.
Only a few researchers examined the interaction of Marketing Expense/Sales ratio with profitability. Aslan and Sığınç (2022), showed that marketing expenses have negative effect on sales margin, sales growth, and asset growth. Valentyn and Pavlov (2017) had a study on Ukranien banks. It is concluded that bank managers may evaluate the marketing expense amount by considering the financial position of the banks. Tudose and Alexa (2017) had research on automobile Dacia and found out that marketing spending from sales is %5-6.
Although authors have used some statistical techniques and models to extract correlations or patterns none of them (very few of them) have employed machine learning algorithms. Our study differs from the previous research;
With the methodology of artificial intelligence, we can not only find out how and in what direction the mentioned variables impact profit, but also their threshold values for generating profit. Previous studies have mostly focused on the relation of these variables with profitability.
The previous studies are mostly conducted for a period between five to ten years, but our study pools the data for sixteen years to get more accurate results.
Turkey has a fragile economy and volatile financial markets in comparison to developed countries. The threshold values of leverage, liquidity, marketing expense/sales per cent and the margin of companys’ age will contribute to the literature as providing a benchmark for Turkish manufacturing companies and also will give an insight on financial conditions of developing countries.
There have been a few studies conducted on the Turkish market to clarify the marketing expense/sales ratio for generating profit. However, these studies have focused on a single sector or brand. Our study considers 90 manufacturing companies from three different sectors to identify common patterns and provide a more generalized insight into marketing budgets for manufacturing companies.
Previous studies have looked for the relationship between independent variables and profit. Our study also shows the interaction of independent variables with each other in a holistic approach.
Research Methodology
Data and Sampling
Ninety-three manufacturing companies listed in Istanbul Stock Exchange (BIST) are examined for this research. They are from three different sectors as food (30), chemistry (32) and metalware (31). The object of the research is firm-level financial statements for the period June 2007(first half) to September 2022 (third quarter). Half-year profit/loss reports and balance sheets are used as financial statements, but third quarter figures are conducted for 2022 instead of second half reports since second half reports had not been realized in research period. Profit loss and balance sheets of the firms are provided from the official website of K.A.P. (https://www.kap.org.tr/tr/), which is the Public Disclosure Platform. This Platform has conducted for providing transparent and periodic information flow of listed companies periodically to public since 2009 according to the Capital Market Board's notification.
Listed company names, sectors and financial statements are provided from K.A.P. platform starting from 2009. 2007 and 2008 reports are provided from K.A.P. archive platform (https://www.borsaistanbul.com). Balance sheet and Profit loss items and establishment date were entered into an excel file. Half year audit reports are reviewed for qualified or unqualified opinion. If audit report gives repetitive fully qualified opinion, the company is taken off the research paper. Three companies out of ninety-three companies have taken of the research content due to have repetitive qualified audit opinion. You may find below screen shots of the data file.
The financial statements of the companies that are registered to Capital Market Board after 2007 cannot be provided for all research periods. These periods are left blank for the related companies. There are 3.103 rows for balance sheet and profit/loss items including the blank ones.
Variables
Our independent variables are, leverage ratio, liquidity ratios as acid-test ratio and cash ratio, firm age, and marketing expense to sales ratio as percent. A calculation sheet is added into the excel file for calculating the formulas. The data is taken from the balance sheet and profit/loss items. The rows of the companies with positive net profitability that means greater than zero were selected and marked as 1, other columns are marked as 2 and profit data was converted from a string to an integer for further examination in KNIME. The calculation sheet is copied to another excel file for inserting into KNIME for further processing. In this file the blank rows of the calculation sheet due to missing financial statements have been deleted. Missing columns are because of the differences in registration dates of the companies to Capital Market Board. The number of research rows becomes 2430 after the deletion of the blank rows.
Statistics of independent variables show average, minimum, maximum values of acid test ratio cash ratio, leverage ratio, firm age, marketing expense/sales ratio and their standard deviation based on the data of 90 companies for the period from June 2007 to September 2022.
Methods
The methodology section describes in detail the workflow created using KNIME, a powerful platform for data integration and predictive analytics. The program is particularly useful for documenting complex steps involved in pre-processing, statistical analysis, statistical modelling, and predictive analytics. KNIME has a wide range of nodes that are classified according to their functionality, such as I/O nodes that extract information from files or databases and export it in various formats, data manipulation nodes that pre-process input data, view nodes that allow for interactive data exploration, and mining nodes that perform common pattern recognition, dimensionality reduction, and feature reconstruction tasks using state-of-the-art data mining methods.
There are plenty of Machine Learning (ML) algorithms which have been proved to be good learners. In this study we preferred to use two ML algorithms. Here’s a brief explanation and comparison of two common machine learning algorithms: Gradient Boosted Trees and Random Forest. Figure 1 shows the overall training model. Figure 1 depicts the overall training model.
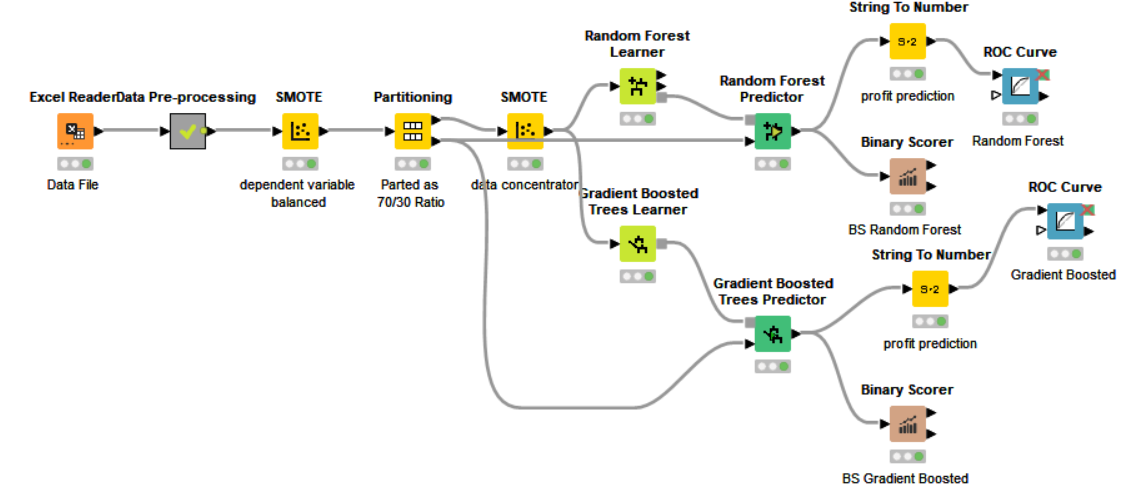
Gradient Boosted Trees, or Gradient Boosting, is an ensemble of learning method that uses multiple decision trees to make predictions. Each tree is built sequentially, with each subsequent tree aiming to correct the errors of the previous one. Gradient Boosting has been shown to be effective in many applications, including ranking and classification tasks (Friedman, 2001). Random Forest is a popular machine learning algorithm that uses an ensemble of decision trees to make predictions. It combines multiple decision trees, each trained on a subset of the data, and aggregates their predictions to improve accuracy and reduce overfitting. The algorithm randomly selects a subset of features at each node in the tree, allowing for a diverse set of trees to be created. It is widely used for classification and regression problems in a variety of fields, including finance, healthcare, and natural language processing (Aydin & Silahtaroglu, 2021).
Findings
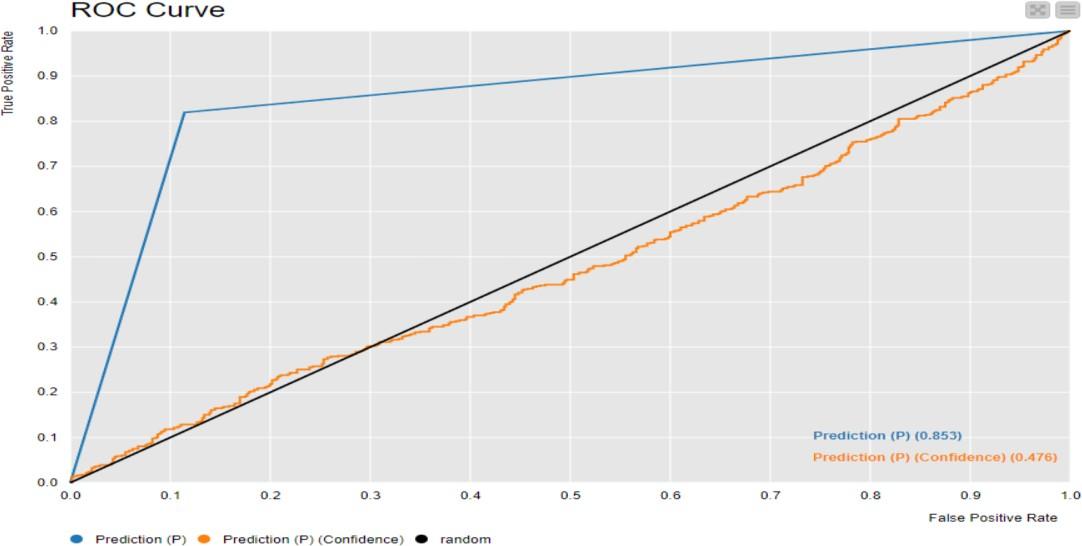
Two different algorithms are used for comparatively more accurate result. The accuracy of both algorithms is quite similar. Random Forest Learner has the accuracy of 0.856 and Gradient Boosted Learner has the accuracy of 0.853. We can suggest that we conduct a successful model. Based on this model the interacted values of interdependent variables on profit are listed in below table. According to the rules in table 6, the machine considers the age of the firm and leverage as the two most important variables out of five for making predictions. The rules imply that firms that are older can tolerate higher leverage values, with breakpoints of 0.83 and 0.88.
Random Forest Learner Algorithm;
Although the accuracy of two studied algorithms is over average the prediction confidence level of the algorithms is lower than usual which are 0.429 and 0.476 in order since these algorithms have low confidence level by nature. ROC Curve is attached below. Figure 2 shows the ROC Curve of Random Forest Algorithm.
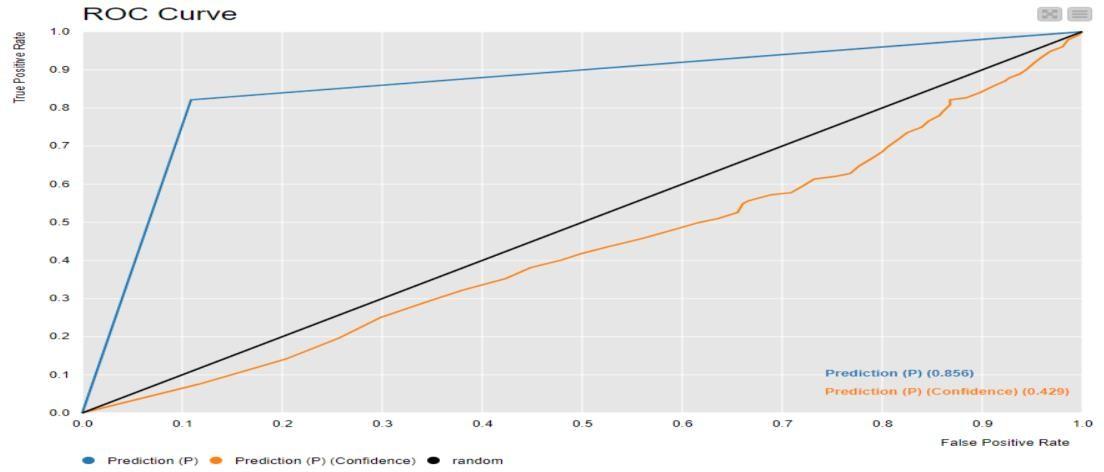
Gradient Boosted Learner
Gradient Boosted Learner ROC Curve is given below (Figure 3).
Conclusion
Companies need to maintain a balance between liquidity and leverage to ensure their financial health and profitability. In this paper we started to investigate 93 listed manufacturing companies from three sectors and end up with 90 companies by taking out three companies due to problematic financial statements. In this research, it is concluded that firm age has a significant effect on leverage ratio for generating profit. Older companies can tolerate higher debt ratio in their capital structure comparatively. We have 34 companies out of 90 with the age of 50 and above in this research. These companies have the most significant effect. It can be due to older companies have better access to finance since they have a long financial track. Besides, market experience and managerial abilities are important for overcoming the fragile and volatile financial conditions of emerging markets. They can also gain more returns by allocating loans effectively to better investment choices with lower cost of debt. However, when the leverage ratio is realized between 0.83 and 0.88, companies have generated loss inconsiderably from other variables. Likewise, when the marketing expense is bigger than 16% it becomes a big threat for profit for listed food, chemical and metalware sectors. It can be due to market conditions. Turkish market is highly competitive for these sectors and our case companies have mostly produced basic products for the consumers. For the niche products the ratio may vary. The impact of acid-test ratio and cash ratio depends on leverage ratio and has no significant effect on profit. Acid-test ratio is mostly realized between 0.64-0.68. There is no relation found between company age and liquidity as acid-test ratio and cash ratio. In research output it is observed that loss results are more accurate than profit results.
This research has some limitations. It is limited with manufacturing companies in three sectors that are listed in Borsa Istanbul Stock Exchange for the research period. Impact of other factors on profit such as macroeconomic conditions, sectoral differences, etc. are not considered. These factors can be researched for further studies for more detailed conclusion.
Acknowledgment
The authors are grateful to the Accounting Research Institute, (ARI- HICoE), Universiti Teknologi MARA, Shah Alam, Malaysia, and the Ministry of Higher Education for providing research funding.
References
Abdillah, R., Hosen, M. N., & Muhari, S. (2016). The determinants factor of Islamic bank's profitability and liquidity in indonesia. Knowledge Horizons. Economics, 8(2), 140.
Akben-Selcuk, E. (2016). Does firm age affect profitability. Evidence from turkey. International Journal of Economic Sciences, 5(3), 1-9. DOI:
Alarussi, A. S., & Alhaderi, S. M. (2018). Factors affecting profitability in Malaysia. Journal of Economic Studies, 45(3), 442-458. DOI:
Ansari, F. U. (2020). The Impact of Profitability, Leverage, Efficiency and Liquidity on Return on Equity: The Case of Indian IT Companies. IUP Journal of Accounting Research & Audit Practices, 19(2), 23-34.
Aslan, M., & Sığınç, H. (2022). Pazarlama Harcamalarının Firma Karlılık ve Büyüme Performansına Etkisi [The Effect of Marketing Expenditures on Firm Profitability and Growth Performance]. Dicle Üniversitesi Sosyal Bilimler Enstitüsü Dergisi, (30), 311-327. Dicle University Journal of Social Sciences Institute.
Aydin, G., & Silahtaroglu, G. (2021). Insights into mobile health application market via a content analysis of marketplace data with machine learning. PLOS ONE, 16(1), e0244302. DOI:
Chang, K., Zeng, Y., Wang, W., & Wu, X. (2019). The effects of credit policy and financial constraints on tangible and research & development investment: Firm-level evidence from China's renewable energy industry. Energy Policy, 130, 438-447. DOI:
Coad, A., Segarra, A., & Teruel, M. (2013). Like milk or wine: Does firm performance improve with age? Structural Change and Economic Dynamics, 24, 173-189. DOI:
Friedman, J. H. (2001). Greedy function approximation: A gradient boosting machine. The Annals of Statistics, 29(5). DOI:
Gardner, I. C. (1965). Observations on the fine structure of the endophyte of the root nodules of alnus glutinosa (L.) gaertn. Archiv für Mikrobiologie, 51, 365-383. DOI:
Ilaboya, O. J., & Ohiokha, I. F. (2016). Firm age, size and profitability dynamics: a test of learning by doing and structural inertia hypotheses. Business and Management Research, 5(1), 29-39. DOI:
Innocent, E. C., Mary, O. I., & Matthew, O. M. (2013). Financial ratio analysis as a determinant of profitability in Nigerian pharmaceutical industry. International journal of business and management, 8(8), 107.
Kalash, I. (2023). The financial leverage–financial performance relationship in the emerging market of Turkey: The role of financial distress risk and currency crisis. EuroMed Journal of Business, 18(1), 1-20. DOI:
Kartiningsih, D., & Daryanto, W. M. (2020). The effect of firm characteristics to profitability of food and beverage companies listed in Indonesia stock exchange. International Journal of Business, Economics and Law, 22(1), 69-76.
Lumbantobing, R., & Salim, S. (2021). Does the Leverage Ratio Mediate the Effect of Liquidity Ratios, Profitability Ratios, and Activity Ratios on Stock Prices? (Empirical Study of Food and Beverage Sub-Sector Companies Listed on the Indonesia Stock Exchange for the Period of 2015-2019). Enrichment: Journal of Management, 11(2), 535-543.
Ripaluddin, R., Pasulu, M., & Taufiq, A. (2023). The Effect of Liquidity and Leverage on Firm Value Through Profitability at PT. Indofood Sukses Makmur Tbk. Jurnal Economic Resource, 6(1), 47-55. DOI:
Samosir, F. C. (2018). Effect of cash conversion cycle, firm size, and firm age to profitability. Journal of applied accounting and taxation, 3(1), 50-57.
Segal, M., & Ólafsson, S. (2023). Design of a self-adaptive model for leverage. Finance Research Letters, 54, 103721. DOI:
Tudose, M. B., & Alexa, L. (2017). The effect of marketing expenses on car sales - an empirical analysis. MATEC Web of Conferences, 126, 04004. DOI:
Valentyn, K., & Pavlov, R. (2017). Relation between marketing expenses and bank’s financial position: Ukrainian reality. Benchmarking: An International Journal, 24(4), 903-933. DOI:
Vintilă, G., & Nenu, E. A. (2016). Liquidity and Profitability Analysis on the Romanian Listed Companies. Journal of Eastern Europe Research in Business and Economics, 1-8. DOI:
Copyright information

This work is licensed under a Creative Commons Attribution-NonCommercial-NoDerivatives 4.0 International License.
About this article
Publication Date
15 November 2023
Article Doi
eBook ISBN
978-1-80296-130-0
Publisher
European Publisher
Volume
131
Print ISBN (optional)
-
Edition Number
1st Edition
Pages
1-1281
Subjects
Technology advancement, humanities, management, sustainability, business
Cite this article as:
Yomralıoğlu, D., Çıtak, A. O. S., Baykal, E., Silahtaroglu, G., & Said, J. (2023). Ideal Leverage via Machine Learning: Avoiding Financial Distress. In J. Said, D. Daud, N. Erum, N. B. Zakaria, S. Zolkaflil, & N. Yahya (Eds.), Building a Sustainable Future: Fostering Synergy Between Technology, Business and Humanity, vol 131. European Proceedings of Social and Behavioural Sciences (pp. 335-345). European Publisher. https://doi.org/10.15405/epsbs.2023.11.27