
Exploring, Categorizing, and Prioritizing the ESG Factors for Organizational Sustainability


Abstract
Environment, social, and governance (ESG) concepts are becoming mainstream proxies for evaluating sustainability in organizations. Though the ESG provides materiality concepts, there is a lack of study to explore, categorize and prioritize the ESG factors to become the plausible guideline for the organizations and the factors are not always being quantifiable at the same time. Therefore, this study aims to address this gap by investigating and identifying the expectations and perceptions of Malaysian electricity utility customers regarding ESG pillars: environment, social, governance, and economy (EESG). A mixed-method approach was employed, combining quantitative and qualitative data from seven (7) experienced and significant stakeholders (customers) of Malaysian electricity providers. The data were collected from benchmarking analysis, literature review, focus group discussion (FGD) and questionnaire survey. And multiple stages of analysis are used like content analysis, analytic hierarchy process (AHP) and quality function deployment (QFD) due to the nature of research objectives. From the customers’ point of view, the results indicated that Malaysian electricity providers should focus on 22 factors of the environment under five categories, 28 factors of social under six categories, and, finally, 32 factors of governance and economics under six categories for their business sustainability. The findings are expected to provide plausible guidelines to the Malaysian electricity utility providers for enhancing their sustainability pillars based on the expectations of stakeholders, especially customers, to move forward to achieve a goal as one of the utmost electricity producing companies in the world.
Keywords: AHP, Customers’ Expectations And Perceptions, ESG, Malaysian Electricity Utility Provider, QFD, Sustainability
Introduction
Fulfilling the expectations and perceptions of stakeholders, notably customers, the rising focus on environmental (E), social (S), governance, and economy (G) (ESG) disclosure has become a vital step towards the integration of sustainable practices into the companies’ cultures. Introducing a sustainable business strategy into the organization’s culture is believed to fulfil the varied expectations of customers (Helfaya et al., 2023). The primary purpose of ESG from customers’ perspectives is to benefit the evaluation of the company’s performance and operations (Syed, 2017). According to research findings, using ESG factors in a company’s future sustainability strategy enhanced its customer access to improve customer needs, market affirmation and societal efficacy provided to the customers (Wan Mohammad & Wasiuzzaman, 2021).
Global warming and the emergence of the Sustainable Development Goals (SDGs) have increased the focus on ESG globally, where a company’s ESG performance has become a key criterion for evaluating its environmental and social responsibility (Zeng & Jiang, 2023). Additionally, ESG was initially developed to assess and incorporate company behavior into decision-making (Li et al., 2021). Customers consider ESG factors in the fundamental analysis of companies because companies that manage ESG concerns proactively outperform their competitors in terms of long-term tangible and intangible results. Managing ESG risks meeting customer expectations and perceptions has gained attention, and for companies, it is now an emerging part of their competitive strategy (Tarmuji et al., 2016).
The business and activities of providing utilities for electricity that includes distribution, transmission, and power generation, especially in Malaysia, impacts many customers as it plays a critical part in a country’s economic activities (Tavassoli et al., 2020). Thus, it is vital to evaluate the electricity sector’s performance and identify the policies shaping towards ESG that influence decisions about sustainable growth based on customers. This study aims to determine customers’ expectations and perceptions of ESG to add value and help them understand how these aspects affect economic, social, environmental, and governance issues. This industry significantly impacts the lives of many stakeholders and facilitates individuals to live comfortable lifestyles. In this context, businesses in the electricity utility sector are subject to stricter requirements for communicating any action or progress and engaging stakeholders (Alrazi et al., 2020a).
The Malaysian electricity utility company encounters obstacles in actively involving stakeholders and effectively addressing their concerns in order to maximize their benefits in a constantly changing environment. It is crucial to identify and analyze stakeholder requirements in advance, including key groups such as their customers, to foster productive collaboration and ensure sustainable business growth. On top of that, the electricity company fortified their aspiration in 2022 with the goal of becoming a leading provider of sustainable energy solutions in Malaysia and internationally. This initiative is crucial in keeping its current growth trajectory and continuously reinventing itself to align with the dynamic market landscape, thus ensuring the creation of long-term value for its stakeholders. The organization places great emphasis on meeting the requirements and interests of its customers, as well as providing transparent information about the company’s commitment to sustainability. Moreover, due to the industry’s environmental sensitivity, the utilities sector faces mounting pressure to enhance sustainability reporting (Zharfpeykan & Askarany, 2023).
This research aims to assess future sustainability by investigating how Malaysian electricity utility customers perceive the environment, social, governance, and economy (ESG) sustainability pillars. Customer expectations and perceptions of ESG factors were gathered through focus group discussions (FGD) and analyzed using the AHP and QFD methods. The study categorizes and prioritizes ESG factors according to Global Reporting Initiative (GRI) standards. Subsequently, a technical solution prioritization list is derived using the QFD method to meet customer expectations. This process leads to the development of a comprehensive organizational sustainability framework based on customers' requirements and proactive technical solutions.
Literature Review
Customer expectations and sustainability
Most industries have acknowledged that meeting customers’ expectations is vital for addressing sustainability issues that have become increasingly important to their success. Businesses ought to engage in strategic networks of customers to address the most difficult ESG issues and hazards (De Silva Lokuwaduge & De Silva, 2022). ESG reporting standards and indicators give objective sustainability performance data to communicate to customers. ESG measures and reporting have limited studies on customers’ sustainability perceptions, where customer support is vital for organizations’ sustainability efforts. Sustainability attempts that differ from customer demand will likely fail in decision-making towards future sustainability development (Aksoy et al., 2022).
The concept of sustainability is widely discussed among industry managers, practitioners, stakeholders, and customers. International and non-profit organizations like the Carbon Disclosure Project and Global Reporting Initiative emphasize the importance of measuring sustainability performance (Silva et al., 2019). Literature indicates that sustainability enhances a company’s competitive advantages and is rooted in ecological and environmental systems, capable of enduring or adapting to changing circumstances. Sustainable practices are crucial for current supply networks, especially in economic development (Rajesh, 2020). As environmental complexities grow, the notion of sustainable development becomes increasingly indispensable. The United Nations (UN) defined sustainable development in 1987 as meeting present needs without compromising future generations (Ardiana, 2019).
Sustainability data is commonly collected in corporate practice for sustainability reports. As a result, sustainability information is significant for customers and customer relationships with the company (Silva et al., 2019). Customer engagement may assist in the improvement of sustainability performance. Sustainability reporting practices share the idea that industry should acknowledge concerns about the environment, society, governance, and the economy when reporting to consumer groups. By incorporating sustainability concerns into strategy, governance, and operations, customer interaction aids reporting organizations in improving their business processes (Ardiana, 2019).
Overview of customer expectations in electricity industry
Assessing the sustainability of each nation’s electrical industry may be essential for economic development and success (Tavassoli et al., 2020). Electricity utility companies’ energy generation, transmission, and distribution affect the country’s environmental, social, governance, and economic activities. Customer expectations and perceptions through communication engagement in the electrical sector are crucial. Stakeholder engagement boosts corporate sustainability and competitiveness by delivering long-term value (Alrazi et al., 2020b).
A case study on project management research examining the effects of the Electricity Company of Ghana project involving stakeholder participation. Effects of poor economic growth, revenue loss, unemployment, cost escalation, and the collapse of local businesses are the consequences of a failed project on the key stakeholders (Adjabeng & Amoah, 2021). In another case study on Fukushima Nuclear Accident, electricity company TEPCO played an important post-accident recovery role and provided communication and customer engagement for expectations and perceptions as essential parts of the recovery process (Proehl et al., 2015).
Electricity companies’ operations have influenced many stakeholders, especially customers. Companies in the electricity sector are being held to higher standards on customer engagement and communicating any action or progress. Hence, it has become critical to overview the customer expectations and perceptions towards the electricity industry’s business and operation.
Development and initiation of Environment, Social, Governance and Economy
The term “ESG” was introduced in the book “Who Care Wins” in 2004, aiming to integrate ESG elements into the capital market. With increased awareness of corporate sustainability initiatives, more companies now disclose their ESG information publicly (Helfaya et al., 2023). ESG evaluates a company’s adherence to a framework encompassing environment (E), social (S), governance, and economy (G) components, originally designed to assess corporate decision-making behavior (Li et al., 2021). Currently, ESG factors are pivotal in measuring companies' sustainability and ethical impact.
ESG has gained significant prominence, engaging various stakeholders (Klarin, 2018). This approach is now widely adopted in global business practices across industries to foster sustainable development and cater to customer needs (Khovrak, 2020). ESG serves as a practical framework for sustainable marketing, offering viable strategies for enterprises. Bloomberg, for instance utilizes its ESG data service to assess companies’ ethical and social responsibility performance (Ferrell, 2021). Implementing ESG-aligned customer expectations through a robust framework leads to successful customer engagement (Dos Santos et al., 2019).
Methodology
Given the inherent nature and research objectives of this study, the data collection process is conducted in four phases, each necessitating diverse sampling techniques to fulfill the specific research goals. Moreover, the study employed two specific tools, namely Analytic Hierarchy Process (AHP) and Quality Function Deployment (QFD) for the analysis and final results. Detailed explanations of AHP and QFD are provided in dedicated sub-sections. The subsequent paragraphs provide a succinct overview of the four phases of the study’s data collection process.
The study commences with interviews of key executives from the Malaysian electricity utility company to evaluate current Environmental, Social, and Governance (EESG) practices. Feedback on ESG requirements is collected through FGD with customer stakeholders. Subsequently, a standardized set of ESG criteria is developed, incorporating inputs from both the electricity provider company’s practices and customer stakeholders.
A set of survey questionnaires is then created based on the synthesized customer’s requirements (CR) in the first phase. These questions are answered by the customers stakeholders that have participated in the FGD. To analyze the prioritized requirements by the customers, a popular multi-criteria decision-making (MCDM) tool, namely the AHP, is employed. The succeeding section provides an in-depth explanation of the AHP process.
Analytic Hierarchy Process (AHP)
The AHP method is the most well-known MCDM tool that requires some steps to follow as suggested by Saaty (2008):
Decompose the problem into a hierarchical structure of criteria, sub-criteria, and alternatives. Numerical values are also assigned to each element based on their relative importance or preference.
Create pairwise comparisons between elements of all criteria, sub-criteria, and alternatives to determine their relative importance using a scale of judgments to capture the weights of the elements.
Calculate the priority weights of the elements from the pairwise comparison matrix obtained in Step 2.
Synthesize all the local set of weights to obtain a set of overall or global weights for the alternatives. The form of the pairwise comparison matrix in Step 2 is as follow:
(3.1)
Where are the factors (either criteria or alternatives whose weights are to be determined), , for all and is the underlying weight vector for the factors. Each entry represents the comparative significance of criterion with respect to criterion. To compare the relative importance of these criterions (weakly or strongly more) with respect to one another, a ratio scale ranging from 1/9 to 9 is used (Saaty, 1987, 2008). For instance, if is strongly more dominant over , then . The interpretation of all the numerical judgments within the (1/9-9) scale is shown in Table 1 below:
Note: If any factor has importance strength over as any of the above non- zero numbers, then has the reciprocal importance strength with i.e., .
Thus, considering the given example, if is considered 5 times more significant than , then is proportionately 1/5 times more important than . The relationship between the elements of matrix, denoted as , has been defined as the ratio between the weights and . Performing a right multiplication of matrix, by the weight vector w results in the following outcome:
Saaty (1987) proposed the principal eigenvalue for weights and consistency measurement. Based on above equation, noted that is the eigenvalue for ratio matrix (which is matrix); meanwhile; is an eigenvector (which is matrix w). Due to the fact that sum of the eigenvalues of matrix are simply its trace, thus, . Also, is the only non-zero eigenvalue.
Noted that , which is known as cardinal consistency. In this case, a ratio scale of priorities can be measured only by a single row ofsince the rank of matrix is equivalent to 1. Hence, matrix is considered consistent only if , where is the largest eigenvalue, which is the underlying standard scale ratio (Klutho, 2013). However, AHP framework does not impose consistency. In this case, the equation is transformed into:
Here matrix is the perturbed value of where the consistency relation is violated at least once. For simplicity, an in-depth explanation of the AHP calculation will not be discussed further. In practice, Expert Choice software is used to compute the weights from the pairwise comparison matrices.
The technical solution (TS) list is gathered in this stage. Multiple sources are used to collect the TS including six benchmark utility companies, selected Malaysian public-listed companies, an extensive literature review, as well as with the company’s feedbacks and inputs. Thus, an additional engagement with the management team of the electricity utility company is also being conducted.
In the fourth and conclusive phase of data collection, distinguished participants, including the management team of Malaysian electricity utility company are engaged in completing the QFD framework to discern the interconnection between CR and TS. The data analysis for this segment is conducted by employing SigmaZone software, enabling the acquisition and subsequent ranking of results for all TS.
Quality Function Deployment (QFD)
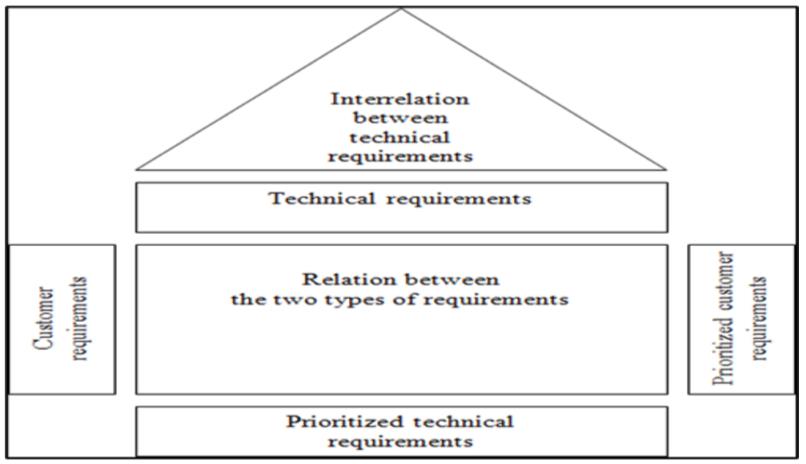
The Quality Function Deployment (QFD) method systematically translates customer requirements into engineering characteristics, aligning product development with customer needs. It captures the ‘voice of the customer’ through surveys, interviews, and focus groups, integrating prioritized requirements into design and development stages. This fosters effective communication and collaboration among cross-functional teams, resulting in high-quality products that exceed customer expectations. The House of Quality matrix is the most well-known and widely used QFD method to integrate customer’s wants and provides a visual means of prioritization and correlation (Hauser & Clausing, 1988; Shrivastava, 2016).
Based on the below Figure 1, the prioritized CR are listed in the left-side of the matrix, meanwhile, all the prioritized TS are listed on the top of the house. To establish the relationship between CR and TS, the weights of their interdependence are determined based on the measurements indicated in the Table 2 provided below:
In instances where a TS is unrelated, the corresponding cell within the grid matrix is left unpopulated. Subsequently, the weights for all the TS are determined by employing the following formula after identifying all potential relationships between each pair of CR and TS:
(3.2)
where;
= weights of the technical requirements
= weight of the customer requirements (in the present study this is determined by using AHP)
= weight of the relationship between customer requirement and technical requirement. ( = 0 or 1or 3 or 6 or 9)
m = number of customer requirements
n = number of technical requirements
Findings
After completing the first phase of data collection, a standard set of ESG criteria required by stakeholders is synthesized accordingly. The ESG factors list collected from the FGD is categorized and synthesized based on the Global Reporting Initiative (GRI) guidelines.
AHP results
Utilizing AHP, weightage scores are derived from survey questionnaire responses using a 9-point scale as shown in Table 1 above to rank ESG factors according to customer stakeholders’ requirements. Subsequently, a prioritization list, illustrated in subsequent figures, is developed based on the weightage scores and categorized into three ESG criteria sets: environmental, social, and governance and economy.
Environmental Domain
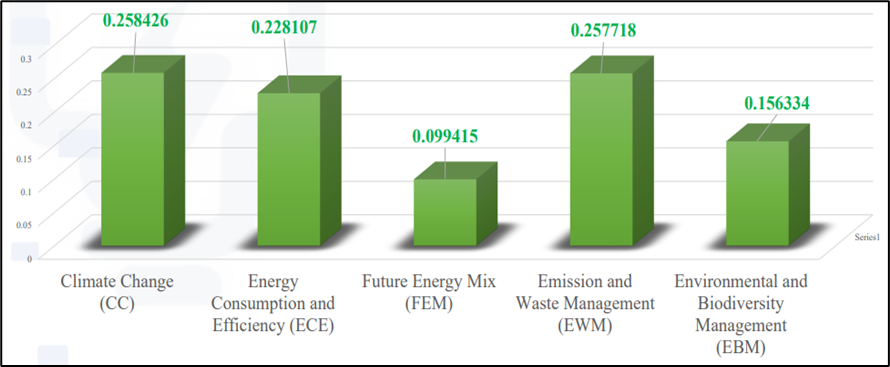
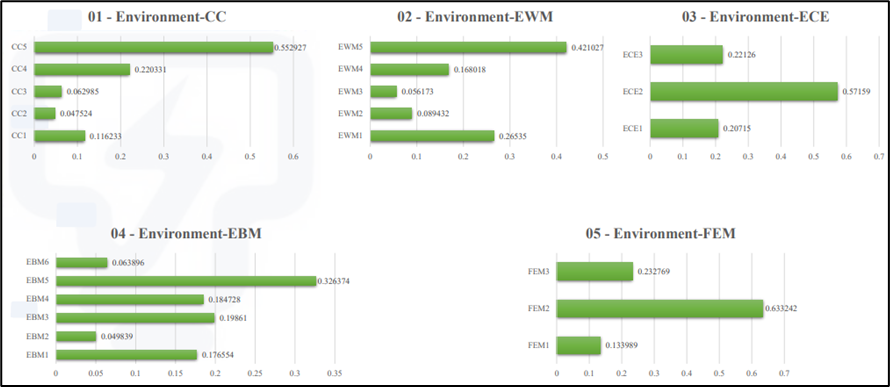
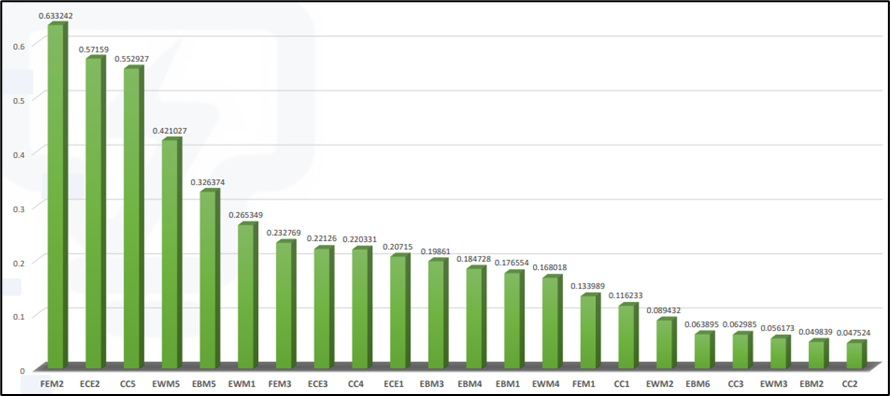
Figure 2 reveals that customer stakeholders prioritize ‘Climate Change’ (0.258426) among the five GRI categories, while ‘Future Energy Mix’ scores lowest (0.099415). Figures 3 and 4 further breakdown the 22 factors, showing customer concerns center on ‘Emphasizing on RE’ (FEM2) with an AHP score of 0.633242 and ‘Implementation of energy-efficient equipment and a transparent tariff and billing system’ (ECE2) with a slightly lower AHP score of 0.571590.
The ‘Future Energy Mix’ category received the lowest score among the five GRI categories, indicating that customers prioritize other sustainability aspects over the composition of future energy sources. This could be due to a lack of awareness or understanding of the concept. Customers tend to prioritize immediate and tangible concerns such as climate change, which has gained significant attention. The utility company can address this by educating customers about the benefits and implications of a diversified energy mix to increase engagement and align priorities.
Social Domain
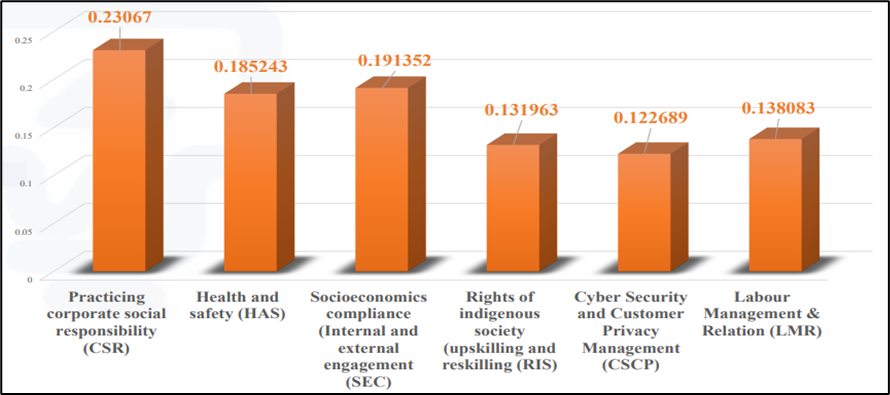
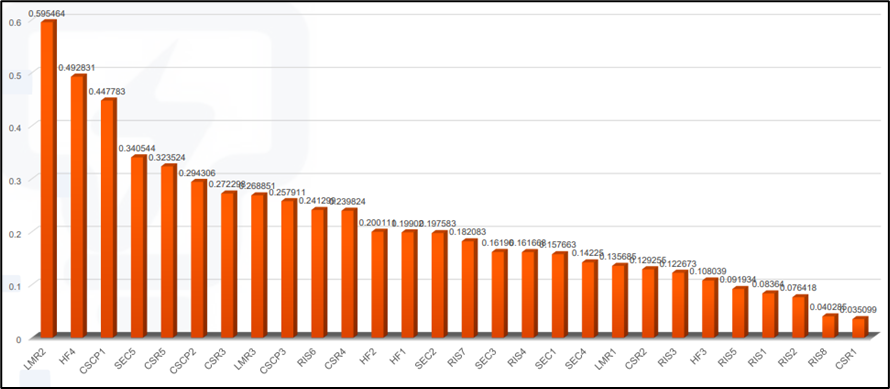
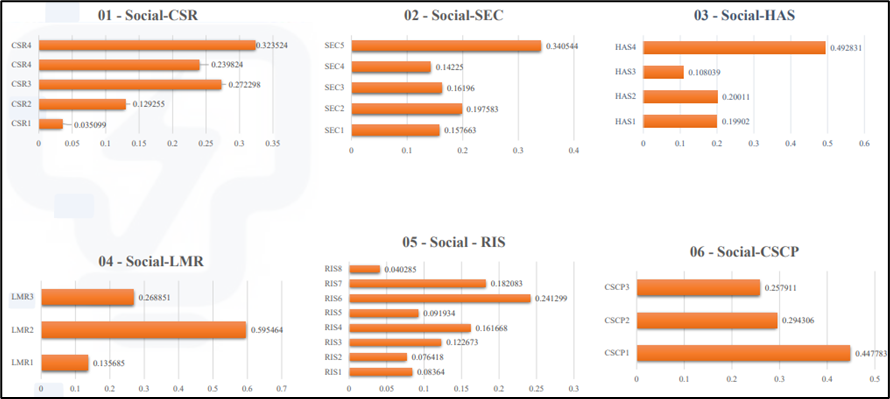
The presented data as shown in Figure 5 highlights the highest priority of the ‘CSR’ category in the social domain, scoring 0.23067. Remarkably, scores across all six social categories are closely clustered, with a mere 0.11 difference between the lowest (0.122689) and highest score. Analyzing all 28 factors, customers particularly emphasize labor and employability standards, with the factor ‘Establishing labor standards’ (LMR2) receiving an impressive AHP score of approximately 0.6. Furthermore, within the ‘CSR’ category, the factor ‘Income and employment (reducing unemployment)’ (CSR5) achieves the highest score of 0.323524, as depicted in Figures 6 and 7.
These findings highlight the significance of labor-related considerations for customers. The focus on labor standards suggests that customers prioritize fair and ethical treatment of employees, as well as the creation of employment opportunities. By addressing these concerns, the utility company can enhance its CSR initiatives and strengthen its reputation as a socially responsible organization.
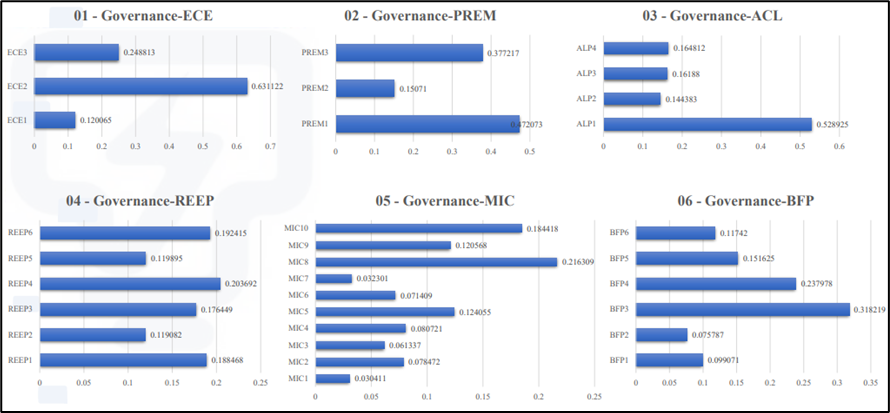
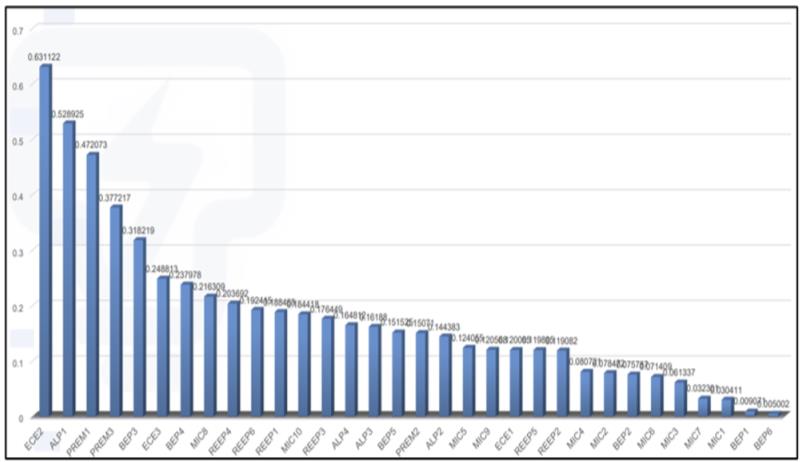
Governance and Economy Domain
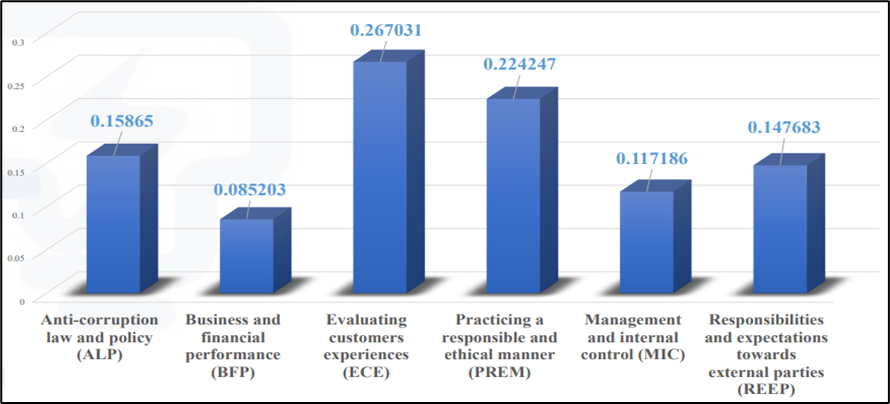
Within this domain, the results underscore the importance of customer-centric considerations. Customers prioritize initiatives that empower them to make sustainable energy choices and reduce their environmental impact, aligning with the global focus on consumer behavior for positive change and energy conservation. As expected, the ‘Evaluating customer experience’ category holds high priority among customer stakeholders with AHP score of 0.267031 (Figure 8). Particularly, the factor ‘Influencing consumer lifestyle on energy consumption’ (ECE2) obtained the highest priority score with 0.631122 points (Figure 10). In contrast, the ‘Business and financial performance’ category scored the lowest with 0.085203. Additionally, its factors ‘Implementing new systems and innovative technology’ (BFP1) and ‘Concentrating on the immediate marketplace and broader economy’ (BFP6) received the least priority as shown in Figures 9 and 10.
QFD matrix results
Subsequent to obtaining the CR prioritization list, the TS prioritization list is derived through the utilization of the QFD method. The construction of the TS list in this study involves a comprehensive approach that integrates various reference sources, including six benchmark utility companies, selected Malaysian public-listed companies, an extensive literature review, as well as with some aid of the organization’s feedbacks and inputs. To further assess the TS, a QFD method is structured using the House of Quality matrix (from both CR and TS list) according to the ESG criteria. Finally, a holistic ESG framework is established by incorporating the priority scores rankings from the TS prioritization list, as depicted in Table 3 below.
The QFD score analysis from the table indicates that the highest significance lies in ‘Aligning business operations with the community, employee, and customer’s expectations.’ This involves meeting customer needs, ensuring employee satisfaction, and considering broader public interests in decision-making. Enhancing electricity services through public involvement and collaboration is also highlighted. Conversely, smart grid and smart mobility initiatives received the lowest rating, as customers prioritized other aspects over technological advancements. Prioritizing customer interests over research and development (R&D) and upholding employee integrity were deemed essential, aligning with customer preferences and labor standards in the utility company’s social domain.
This analysis stresses the importance of considering customer input and aligning business strategies accordingly. By placing emphasis on the areas that matter most to customers’ stakeholders, the Malaysian electricity utility company can ensure that their efforts and resources are directed towards meeting customer expectations and delivering value. Hence, by focusing on meeting customer expectations on climate change, CSR, and customers experience, then appropriately addressing their needs, the organization can build stronger relationships and enhance customer satisfaction, while ensuring the business sustainable growth.
Conclusion
According to the sustainability pillar of ‘ESG,’ altogether 17 categories were developed under the GRI standard. From the first pillar ‘Environment’ the study concluded five categories namely climate change, energy consumption and efficiency, discovering the future energy mix for ensuring green electricity production, emission and waste management and environmental and biodiversity management. Hence, altogether, 22 factors were also prioritized. For the second pillar ‘Social,’ six categories were finalized which are; practicing corporate social responsibility, health and safety, socioeconomics compliance (internal and external engagement), rights of indigenous society (upskilling and reskilling), cyber security and customer privacy management, and labor management/ relation. Also, altogether 28 factors were prioritized. Furthermore, under the last pillar of ‘Governance and Economy,’ six GRI categories were developed, and 32 factors were recognized and prioritized. The categories are; anti-corruption law and policy, business, and financial performance, evaluating customers experiences, practicing a responsible and ethical manner, management and internal control, and responsibilities and expectations towards external parties.
The study is significant in assisting the Malaysian electricity utility company to leverage this analysis in shaping their strategies and prioritize efforts that associate with customer expectations. By centering on enhancing the customer experience and promoting sustainable energy consumption practices, the organization can improve customer satisfaction and engagement. Additionally, while financial performance and technological advancements within the company remain important, finding a balance between business objectives and customer-centric initiatives is essential to meet stakeholders' evolving demands. Thus, by understanding the priorities articulated by the customers, organizations can make informed decisions and allocate resources effectively to meet their needs. Future research can build upon these findings by exploring strategies to bridge the gap between R&D initiatives and customer requirements, ensuring a well-balanced approach that considers both innovation and customer satisfaction. Overall, this study provides a comprehensive analysis of priority scores using AHP and QFD methods, offering a valuable ESG framework for the utility company’s decision-making in the context of business operations and customer-centric approaches. Hence, the Malaysian electricity utility company can materialize a comprehensive framework for organizational sustainability, with a specific focus on positioning itself as a foremost provider of sustainable energy solutions globally.
Acknowledgments
The research presented in this paper was funded by the Energy Transition Grant (202204004ETG) provided by the Innovation and Research Management Center (iRMC) at Universiti Tenaga Nasional.
References
Adjabeng, J. K., & Amoah, P. (2021). Assessing the effects of projects implementation failures of electricity company of Ghana (ECG) [Doctoral dissertation].
Aksoy, L., Buoye, A. J., Fors, M., Keiningham, T. L., & Rosengren, S. (2022). Environmental, Social and Governance (ESG) metrics do not serve services customers: a missing link between sustainability metrics and customer perceptions of social innovation. Journal of Service Management, 33(4/5), 565-577. DOI:
Alrazi, B., Abd Jamil, A. R., Husin, N. M., Jaaffar, A. H., Khalid, F. M., & Zainol, Z. (2020a). Stakeholder engagement disclosures by electric utilities in Malaysia: An exploratory research. Journal of Energy and Environment, 12(2).
Alrazi, B., Abd Jamil, A. R., Husin, N. M., Jaaffar, A. H., Khalid, F. M., & Zainol, Z. (2020b). A preliminary longitudinal stakeholder engagement analysis of the largest power company in south east asia. Global Business and Management Research, 12(4), 214-226.
Ardiana, P. A. (2019). Stakeholder Engagement in Sustainability Reporting: Evidence of Reputation Risk Management in Large Australian Companies. Australian Accounting Review, 29(4), 726-747. DOI:
De Silva Lokuwaduge, C. S., & De Silva, K. M. (2022). ESG risk disclosure and the risk of green washing. Australasian Accounting, Business and Finance Journal, 16(1), 146-159.
Dos Santos, P. H., Neves, S. M., Sant’Anna, D. O., De Oliveira, C. H., & Carvalho, H. D. (2019). The analytic hierarchy process supporting decision making for sustainable development: An overview of applications. Journal of cleaner production, 212, 119-138. DOI:
Ferrell, O. C. (2021). Addressing socio-ecological issues in marketing: environmental, social and governance (ESG). AMS Review, 11(1-2), 140-144. DOI:
Hauser, J. R., & Clausing, D. (1988). The House of Quality. Harvard Business Review, 66(3), 63–73.
Helfaya, A., Morris, R., & Aboud, A. (2023). Investigating the Factors That Determine the ESG Disclosure Practices in Europe. Sustainability, 15(6), 5508. DOI:
Khovrak, I. (2020). ESG-driven approach to managing insurance companies' sustainable development. Insurance Markets and Companies, 11(1), 42-52. DOI:
Klarin, T. (2018). The Concept of Sustainable Development: From its Beginning to the Contemporary Issues. Zagreb International Review of Economics and Business, 21(1), 67-94. DOI:
Klutho, S. (2013). Mathematical Decision Making: An Overview of the Analytic Hierarchy Process. https://www.whitman.edu/Documents/Academics/Mathematics/Klutho.pdf
Li, T.-T., Wang, K., Sueyoshi, T., & Wang, D. D. (2021). ESG: Research Progress and Future Prospects. Sustainability, 13(21), 11663. DOI:
Mohammad, W. M. W., & Wasiuzzaman, S. (2021). Environmental, Social and Governance (ESG) disclosure, competitive advantage and performance of firms in Malaysia. Cleaner Environmental Systems, 2, 100015. DOI:
Proehl, G., Balonov, M., Al-Masri, M., & Howard, B. J. (2015). The Fukushima Daiichi Accident. Technical volume 5/5 Post Accident Recovery. Austria: International Atomic Energy Agency.
Rajesh, R. (2020). Exploring the sustainability performances of firms using environmental, social, and governance scores. Journal of Cleaner Production, 247, 119600. DOI: 10.1016/j.jclepro.2019.119600
Saaty, R. W. (1987). The analytic hierarchy process—what it is and how it is used. Mathematical Modelling, 9(3-5), 161-176. DOI:
Saaty, T. L. (2008). Decision making with the analytic hierarchy process. International Journal of Services Sciences, 1(1), 83. DOI: 10.1504/ijssci.2008.017590
Shrivastava, P. (2016). House of Quality: An Effective Approach to Achieve Customer Satisfaction & Business Growth in Industries. International Journal of Sciences and Research, 5(9), 1365–1371.
Silva, S., Nuzum, A.-K., & Schaltegger, S. (2019). Stakeholder expectations on sustainability performance measurement and assessment. A systematic literature review. Journal of Cleaner Production, 217, 204-215. DOI:
Syed, A. M. (2017). Environment, social, and governance (ESG) criteria and preference of managers. Cogent Business & Management, 4(1), 1340820. DOI:
Tarmuji, I., Maelah, R., & Tarmuji, N. H. (2016). The impact of environmental, social and governance practices (ESG) on economic performance: Evidence from ESG score. International Journal of Trade, Economics and Finance, 7(3), 67.
Tavassoli, M., Ketabi, S., & Ghandehari, M. (2020). Developing a network DEA model for sustainability analysis of Iran's electricity distribution network. International Journal of Electrical Power & Energy Systems, 122, 106187. DOI:
Zeng, L., & Jiang, X. (2023). ESG Risk Disclosure and the Risk of Green Washing. Australasian Business, Accounting and Finance Journal, 16(1), 146-159. DOI:
Zharfpeykan, R., & Askarany, D. (2023). Sustainability Reporting and Organisational Factors. Journal of Risk and Financial Management, 16(3), 163. DOI:
Copyright information

This work is licensed under a Creative Commons Attribution-NonCommercial-NoDerivatives 4.0 International License.
About this article
Publication Date
15 November 2023
Article Doi
eBook ISBN
978-1-80296-130-0
Publisher
European Publisher
Volume
131
Print ISBN (optional)
-
Edition Number
1st Edition
Pages
1-1281
Subjects
Technology advancement, humanities, management, sustainability, business
Cite this article as:
Islam, M. K., Zulkifli, N. H., Mohamed, E. F., Jaaffar, A. H., & Radzi, H. M. (2023). Exploring, Categorizing, and Prioritizing the ESG Factors for Organizational Sustainability. In J. Said, D. Daud, N. Erum, N. B. Zakaria, S. Zolkaflil, & N. Yahya (Eds.), Building a Sustainable Future: Fostering Synergy Between Technology, Business and Humanity, vol 131. European Proceedings of Social and Behavioural Sciences (pp. 220-236). European Publisher. https://doi.org/10.15405/epsbs.2023.11.18