
The Cost Of Export Flows: Spline-Modeling And Factor Analysis


Abstract
When examining the value of export flows, it is important to assess the impact of two key factors – export volumes and export prices. The subject of the study is a factor analysis of the value of export flows. The aim is to evaluate the effectiveness of spline modeling in the factor analysis of the cost of flows. The methods of factor analysis of export flows refer to economic indices. The discreteness of indices limits the effectiveness of the analysis of the cost of flows in case of strong fluctuations in export prices and (or) export volumes, which is characteristic of the dynamics of oil export flows. Modeling without smoothing the empirical dynamics retains information about velocity fluctuations; after that, differentiation can be used to change in the analysis and operational management of trends in the cost of flows. The required accuracy can be achieved by data processing in the Maple 17 computer mathematics system, which performs calculations without rounding errors. The method of factor analysis showed the possibility to study the dependence of trends in the cost of export flows on fluctuations in the speed of export prices and export volumes. The methods of spline modeling and factor analysis of flow cost trends are effective, determine the impact of factors at nodal points and at any arbitrary time within the interval under study.
Keywords: Analysis, flow, oil export, spline modeling
Introduction
Factor analysis of the cost of flows in the context of digitalization should take into account the need for adaptive management of processes in economic systems. The methods of factor analysis use discrete data on the impact of factors on the value of the export flow. Improving the efficiency of adaptive control can be achieved by local corrective actions. The impact should also take into account changes in the dynamics of the cost of flows – slowdowns or accelerations. This requires a transition from models of flow dynamics with discrete time to continuous models that describe the dynamics of increments or the instantaneous rate of changes in the cost of flows. This will allow the use of quantitative indicators in the analysis that continuously evaluate fluctuations in flow rates, detecting regression switching. Continuous models will also allow assessing the degree of influence of factors on the increase in the cost of flows within short time periods.
Problem Statement
When studying the dynamics of economic flows, discrete quantitative indicators – economic indices – are widely used (Baburina, 2018; Filimonova et al., 2018). In particular, indices are used to study fluctuations in the dynamics of the cost of flows under the influence of two key factors – changes in prices and physical sales volumes. At the same time, being discrete indicators, indices are not effective enough in the analysis of flows during strong fluctuations in prices and (or) sales volumes. The disadvantage of indices is the impossibility of a local study of flows within short intervals. It becomes an urgent task to develop continuous quantitative indicators that can observe trends in the cost of flows within short intervals. Of particular interest is the analysis of the value of export flows, structurally consisting of two components – the physical volume of exports and the export price. export volumes and export prices show a close inverse relationship, acting as factors in managing international trade.
Research Questions
The subject of the study is to evaluate the effectiveness of spline modeling in the analysis of growth factors in the cost of export flows, namely:
1. Analysis of the efficiency of spline modeling of flow dynamics without approximation errors
2. Evaluation of the analytical potential of derivatives in modeling flow rates
3. Examining the Accuracy of Spline Models in Factorial Cost Analysis of Flow
Purpose of the Study
The aim of the study is to evaluate the models of oil export flows by cubic splines and analyze their effectiveness in factorial analysis of the cost of flows.
Research Methods
Within short intervals, it is important to observe the dynamics of absolute growth (or declineand fluctuations in the growth rate. Mathematically, changes in velocity fluctuations can be described by first derivatives of continuous models of economic dynamics. The transformation of the flow model into its velocity model can be done by differentiation. With regard to the problem of analyzing the speed of export flows, the new model should be decomposable – the dynamics of the rate of fluctuations in export prices and the dynamics of the rate of changes in the physical volumes of exports. The differentiability of spline models makes it possible to involve economic analogues of physical movement in the analysis of flows – speed, acceleration, momentum, etc. (Bezuglov et al., 2017; Botasheva, 2012).
The tools and methods of classical econometrics are often unable to preserve small changes in the model dynamics, observing the process smoothed within a certain interval. Approximation of the dynamics distorts the information about real increments or the growth rate of the cost of the flow. The study of dynamics within short intervals requires accurate preservation of real values at the nodal points of the model. In mathematics and physics, absolutely accurate data preservation is achieved by cubic spline interpolation (Vygodchikova et al., 2017; Banker et al., 2020). However, the use of splines in modeling processes in the economy has not yet found wide application. At the same time, spline interpolation can become a tool for analyzing the “latent” correlation of accelerations or decelerations (Ilyasov, 2021).
Findings
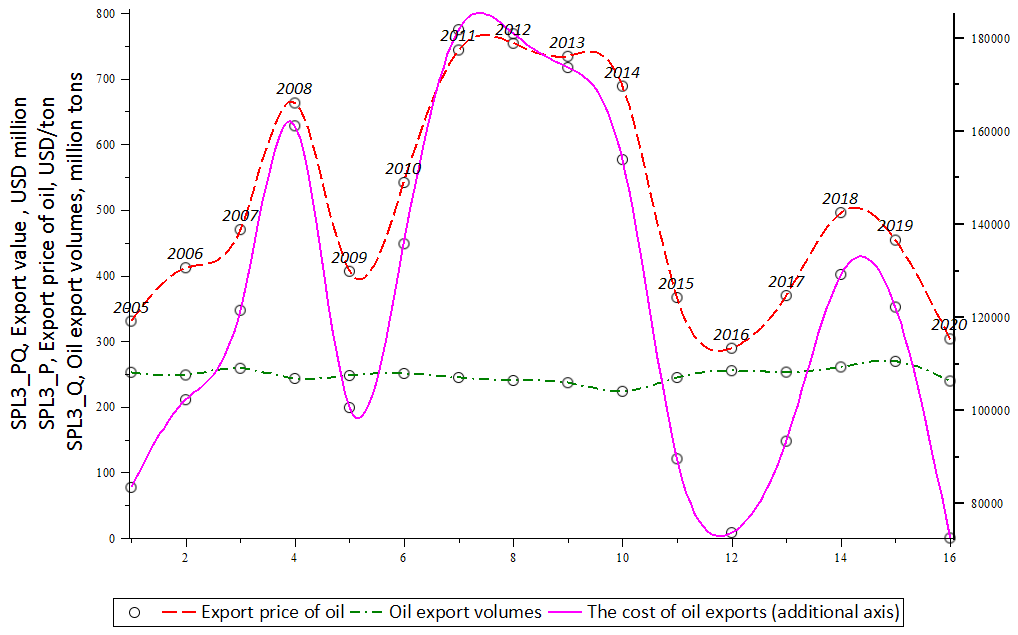
Individual indices, calculated as time series, are effective enough to reflect the long-term dynamics. However, for operational flow control, it is important to observe real trends and accurately detect regression switches. The discreteness of the indices limits the possibility of consistently comparing the impact of factors on the rate of growth in the cost of flows. The solution is to interpolate the flow dynamics with cubic splines (Cui et al., 2020; Edwards & Parry, 2018; Gao & Meng, 2018), followed by the use of flow velocity models (Figure 01).
The c spline models allow for using the models of the rate of changes in export oil prices, the volume of oil production and the cost of oil exports. This allows you to analyze the impact of factors at an arbitrary point in time, which is important for the operational management of the flow cost. The curves of the first derivative of the spline-interpolation models of the dynamics of export prices, volumes of exports and the value of oil exports describe the instantaneous rate of their changes. Being informative indicators of growth or decline trends, the derivatives make it possible to evaluate successive changes in the impact of factors on the process under study. The continuity and accuracy of the spline models ensure that the method is not critical to the variability of the time interval under study. By interpolating additional points of spline curves, the restrictions of classical econometrics on the length of time series in regression analysis are also removed (Hill & Scholz, 2018; Kılıç & Kartal, 2021; Kirkby & Deng, 2019).
By analogy with the well-known relationship between the indices of export value, export prices and physical volumes of exports, we formalized the relationship between their trends – fluctuations in instantaneous speed. This should allow for managing trends in the value of the export flow, analytical, quantitative and graphical presentation of factors – the rate of fluctuations in export prices and the rate of change in export volumes. Introduce the notation for spline models:
- spline model of the dynamics of export oil prices, USD/ton;
- spline model of the dynamics of oil export volumes, million tons/year;
- spline model of the value of the export flow, mln USD/year;
- spline model of the instantaneous rate of changes in export oil prices, USD/ton;
- spline model of the instantaneous rate of changes in oil export volumes, million tons/year;
- spline model of the instantaneous rate of changes in the value of the export flow, mln USD/year.
The transition from the model of the cost of the export flow to the model of the rate of changes in value will be performed by the formula for differentiating the product of functions D1_SPL3_PQ:
D1_SPL3_PQ = D1_SPL3_P*SPL3_Q+SPL3_P*D1_SPL3_Q (1)
The instantaneous rate of changes in the value of the export flow in (1) is equal to the sum of the product of the instantaneous rate of change in export prices by the volume of exports and the product of the export price by the instantaneous rate of change in the volume of exports. The representation of the additive-multiplicative model 1 allows us to quantify the "economic impulse" of two factors that affect the speed of the value of the export flow:
1. D1_SPL3_P*SPL3_Q – instantaneous rate of changes in export prices for oil, multiplied by export volumes;
2. D1_SPL3_Q*SPL3_P – the instantaneous rate of change in export volumes, multiplied by the export price.
To interpret the "economic impulse" use the analogy of physical movement. The instantaneous rate of changes in oil export prices multiplied by export volumes can be interpreted as the “economic impulse” of export prices (Botasheva, 2012). The unit of measurement of the "economic impulse" of the export price will be the instantaneous rate of increase in the value of exports – million dollars per year. At each time t, the momentum of the export price is determined by the instantaneous growth rate of the export price for given export volumes. The "economic impulse" of the physical volumes of exports at time t is determined by the instantaneous growth rate of exports multiplied by the export price at time t and is expressed in the same units of measurement – in million dollars per year. The instantaneous speed of the value of the export flow is determined by the additive impact of the impulses of the export price and export volumes (Figure 02).
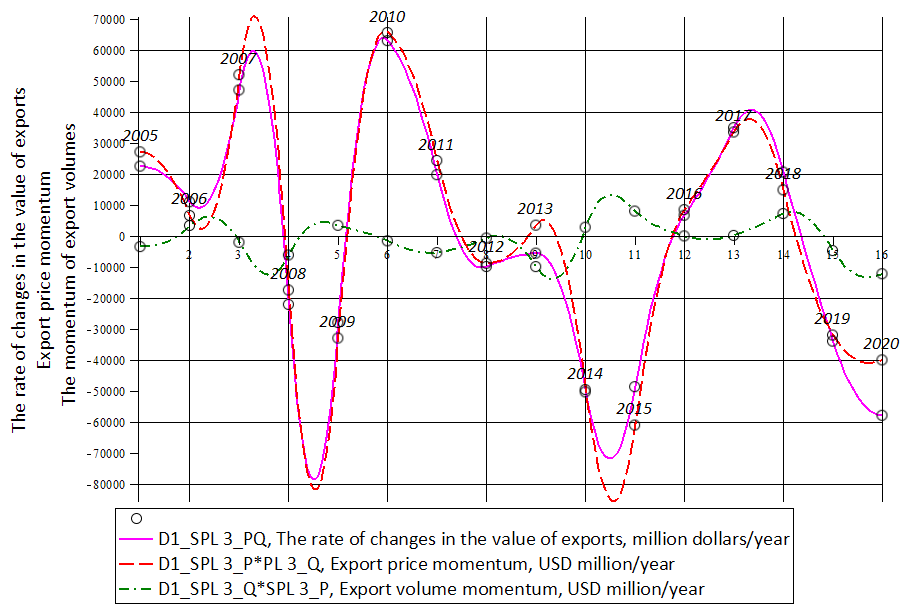
Spline models make it possible to graphically, analytically and quantitatively analyze the impact on the instantaneous speed of the cost of exports of "economic impulses" – the impulse of the export price and the impulse of export volumes. As follows from equation 1, the instantaneous growth rate of the value of exports at each time t is given by the sum of the momentum of the export price and the momentum of export volumes. For example, calculations in the Maple system accurately determine the impact of factors on the increase in the value of the export flow at nodal points and at any point in time (Table 01).
This means that in mid-2008, at nodal point 4.5, the rate of decline in the cost of oil exports was maximum – the cost fell by 77454.696 million dollars, including due to the negative impact of the "economic impulse" of the export price, it fell by 81165.611 million dollars. The positive impact of the "economic momentum" of export volumes corrected the fall by only 3710.915 million dollars. By the dynamics of the first derivatives, it is possible to determine the intervals within which the additive effect of factors led to the highest growth rate in the value of exports – we observe this at the nodal point 6 in 2010. At this nodal point, we observe the strongest impact on the growth of the cost of oil exports from the impulse of the export price. An increase in the value of oil exports for 2010 amounted to 64372.884 million dollars, including due to the impact of the "economic impulse" of the export price by 65813.108 million dollars and due to the negative impact of the "economic impulse" of export volumes by 1440.224 million dollars. The behavior of the curves of "economic impulses" of export prices and export volumes follows the well-known law of supply and demand, when export prices rise with a decrease in export volumes. The spline velocity models make it possible to observe market changes in the supply-demand law in the oil market. For example, in 2019-2020, we observed the behavior which is not typical of the energy market – the cost of oil exports fell under the simultaneous negative impact of the export price impulse and the impulse of export volumes. At nodal point 16, a decrease in the cost of the oil export flow amounted to 52164.010 million dollars, including due to the negative impact of the "economic impulse" of the export price by 39977.614 million dollars, and due to the negative impact of the "economic impulse" of export volumes by 12186.396 million dollars. According to the curves of the first derivatives, the extremes in the dynamics of the value of the export flow can be determined visually.
Conclusion
The method of factorial analysis of the cost of export flows turned out to be effective – spline modeling accurately determines the degree of influence of factors not only at the nodal points, but also at any arbitrary point in time within the interval under study (Rich, 2020; Richards, 2020; Shahbaz et al., 2020). According to the growth rate curves, one can observe changes in market conditions when the degree of influence of factors changes. The accuracy of the results obtained should allow for efficient management of flows, adapting the impact in accordance with the current market conditions. More attention is paid to the dynamics of local changes, which can be analytically presented by models of the speed of economic movement. A linguistic understanding of the similarity of economic movement with the physical one should find the possibility of an analytical, graphical and quantitative study of flows. This makes it possible to use the quantitative characteristics of physical movement – speed, acceleration, momentum, etc.
The spline interpolation of the dynamics removes a number of limitations of classical econometrics related to the requirements for the length of the time series (Vaid & Arora, 2019; Zaynidinov et al., 2020). Refusal to smooth the real process preserves information about slowdowns and accelerations of the development – valuable sources of knowledge about the local impact of factors. The continuity of the models is useful, if necessary to observe the development at the nodal points of the process and at any arbitrary point in time.
References
Baburina, O. N. (2018). Analysis of the determinants of the global oil market and their impact on the financial results of tanker fleet companies. National interests: priorities and security, 12(369), 2340–2355. DOI:
Banker, R. D., Byzalov, D., Fang, S., & Jin, B. (2020). Operating asymmetries and non-linear spline correction in discretionary accrual models. Review of Quantitative Finance and Accounting, 54(3), 803–850. DOI: 10.1007/s11156-019-00808-5
Bezuglov, D. A., Krutov, V. A., & Shvachko, O. V. (2017). Signal Differentiation Method Using Spline Approximation. Basic research, 4(1), 24–28. https://fundamental-research.ru/ru/article/view?id=41429
Botasheva, F. B. (2012). Economic images of archetypes of physical dynamics. European Social Science Journal, 8(24), 364–373.
Cui, Z., Kirkby, J. L., & Nguyen, D. (2020). Nonparametric Density Estimation by B-Spline Duality. Econometric Theory, 36(2), 250–291. DOI: 10.1017/S0266466619000112
Edwards, J. R., & Parry, M. E. (2018). On the Use of Spline Regression in the Study of Congruence in Organizational Research. Organizational Research Methods, 21(1), 68–110. DOI: 10.1177/1094428117715067
Filimonova, I. V., Eder, L. V., Larionov, V. G., & Komarova, A. V. (2018). Rating of oil companies in terms of sensitivity of the tax burden to macroeconomic and industry factors. Economic analysis: theory and practice, 12(483), 1430–1443. DOI:
Gao, G., & Meng, S. (2018). Stochastic claims reserving via a Bayesian spline model with random loss ratio effects. ASTIN Bulletin, 48(1), 55–88. DOI:
Hill, R. J., & Scholz, M. (2018). Can Geospatial Data Improve House Price Indexes? A Hedonic Imputation Approach with Splines. Review of Income and Wealth, 64(4), 737–756. DOI:
Ilyasov, R. Kh. (2021). “Latent” correlations of flows in the economy: spline analysis. Proceedings of the St. Petersburg State University of Economics, 1(127), 35–41. https://cyberleninka.ru/article/n/latentnye-korrelyatsii-potokov-v-ekonomike-splayn-analiz
Kılıç Depren, S., & Kartal, M. T. (2021). Prediction on the volume of non-performing loans in Turkey using multivariate adaptive regression splines approach. International Journal of Finance and Economics, 26(4), 6395–6405. DOI: 10.1002/ijfe.2126
Lars Kirkby, J., & Deng, S.-J. (2019). Swing option pricing by dynamic programming with b-spline density projection. International Journal of Theoretical and Applied Finance, 22(8), 1950038. DOI: 10.1142/S0219024919500389
Rich, J. (2020). A spline function class suitable for demand models. Econometrics and Statistics, 14, 24–37. DOI:
Richards, S. J. (2020). A Hermite-spline model of post-retirement mortality. Scandinavian Actuarial Journal, 2020(2), 110–127. DOI: 10.1080/03461238.2019.1642239
Shahbaz, M., Khraief, N., & Mahalik, M. K. (2020). Investigating the environmental Kuznets’s curve for Sweden: evidence from multivariate adaptive regression splines (MARS). Empirical Economics, 59(4), 1883–1902. DOI: 10.1007/s00181-019-01698-1
Vaid, M. K., & Arora, G. (2019). Solution of second order singular perturbed delay differential equation using trigonometric B-spline. International Journal of Mathematical, Engineering and Management Sciences, 4(2), 349–360. DOI: 10.33889/IJMEMS.2019.4.2-028
Vygodchikova, I. Yu., Gusyatnikov, V. N., & Vysochanskaya, E. Yu. (2017). Method of spline approximation of economic processes with an unstable trend. Bulletin of Saratov State Socio-Economic University, 4(68), 110–115. https://cyberleninka.ru/article/n/metod-splayn-approksimatsii-ekonomicheskih-protsessov-s-neustoychivym-trendom
Zaynidinov, H., Bakhromov, S., Azimov, B., & Makhmudjanov, S. (2020). Comparative analysis spline methods in digital processing of signals. Advances in Science, Technology and Engineering Systems, 5(6), 1499–1510. DOI:
Copyright information

This work is licensed under a Creative Commons Attribution-NonCommercial-NoDerivatives 4.0 International License.
About this article
Publication Date
25 November 2022
Article Doi
eBook ISBN
978-1-80296-127-0
Publisher
European Publisher
Volume
128
Print ISBN (optional)
-
Edition Number
1st Edition
Pages
1-742
Subjects
Sociolinguistics, linguistics, semantics, discourse analysis, translation, interpretation
Cite this article as:
Ilyasov, R. K. (2022). The Cost Of Export Flows: Spline-Modeling And Factor Analysis. In D. Bataev, S. A. Gapurov, A. D. Osmaev, V. K. Akaev, L. M. Idigova, M. R. Ovhadov, A. R. Salgiriev, & M. M. Betilmerzaeva (Eds.), Social and Cultural Transformations in the Context of Modern Globalism (SCTCMG 2022), vol 128. European Proceedings of Social and Behavioural Sciences (pp. 310-317). European Publisher. https://doi.org/10.15405/epsbs.2022.11.43