Researching Of Trends In The Development Of The Current Geopo-litical Situation
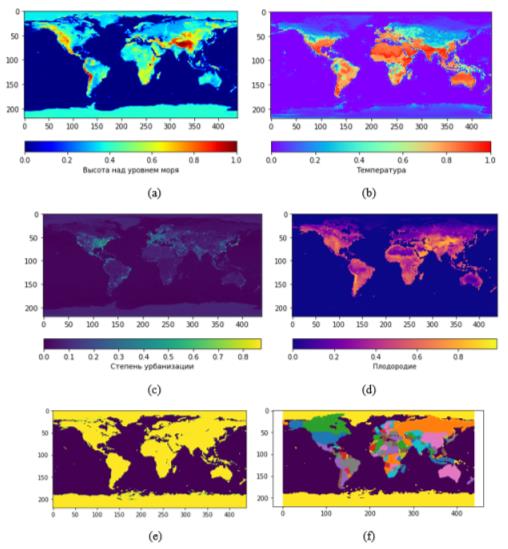
Figure 1: Empirical data: a) the relief map of the earth's surface is scaled in conventional units of height: the value 1 corresponds to the height of 9 thousand km above sea level; b) the map of the average annual temperature of the Earth's surface is scaled in conventional units: the value 0 corresponds to – 60 C, the value 1 corresponds to 60 C; c) Map of the degree of urbanization of the surface scaled in conventional units: the value 0 corresponds to low urbanization, 1 – high; d) the fertility (capacity) map of the surface is scaled in conventional units: the value 0 corresponds to low fertility, 1 – high; e) Land map and mine (light color – land, dark - water); f) Political map
< Back to article