
Researching Of Trends In The Development Of The Current Geopo-litical Situation


Abstract
One of the forecasting tools in geopolitics is mathematical models. In this article, we have presented our own spatial model of geopolitical interactions. The model is based on the models of the geopolitical of the geopolitical position of Arzruni-Komlas and the meta-ethnic borderland of P. Turchin. For empirical verification of the proposed modifications, spatial data describing various properties of the planet Earth were collected and processed. These data include information about the relief of the Earth's surface, temperature, soil fertility capacity, degree of urbanization, land and sea surfaces, political affiliation. The results of modeling these geopolitical interactions on the example of a map of Europe with the inclusion of a part of North Africa have a very average nature of approximation to historical reality. Over the course of several hundred iterations, we managed to get very conditionally closer to the outlines of the political borders in this region. Obtaining more accurate results requires a better selection of model parameters and its possible refinement. The spatial model of geopolitical interactions we have built has proved to be quite workable. The model clearly demonstrated the influence of geographical and climatic data on the territorial distribution of the borders of state agencies. Due to the complexity and non-linearity of the considered problem of territorial dynamics of each particular state, it is difficult to assume how the position of borders will change in reality.
Keywords: Geopolitics, mathematical models demographics, world-system analysis, spatial models
Introduction
An important aspect in making decisions in geopolitics, such as the conclusion of alliances and the identification of opponents, is to identify their features based on their characteristics. As shown in (Avila et al., 2019; Arzimbekov et al., 2020; Malafeyev et al., 2020; Nemnyuginet al., 2020), this problem has many complexities and requires taking into account many details. This article discusses the problem of mathematical modeling of states in context of real geographical conditions. In a series of works (Back, 2018; Huang et al., 2020; Bayer et al., 2020), a cluster analysis was carried out. For illustration purposes, the study’s results were visualized and an overview of the composition of the final clusters (Pichugin, 2018). The current work is a development and improvement of the previous one (Smirnov et al., 2021).
Problem Statement
This article is devoted to the study of geopolitical interactions as complex systems. The proposed model is built in accordance with the idea of morphogenesis formulated by A. Turing. According to it, global evolution is determined by local interaction: the structural organization of the entire World-System is set by a number of local rules of close interaction of the elements forming the system. The research of this problem was based on the works of many researchers. Korotaev and Grinin (2009), Turchin and Gavrilets (Turchin & Gavrilets, 2009), Turchin (2003) Chernavsky et al. (2010a); Chernavsky et al., (2010b), Korotaev et al. (2007a), Korotaev et al. (2007b), Malkov (2004) and many others, which consider various types of spatial and mathematical modeling of internal and interstate dynamics. Based on the analysis and synthesis of individual properties of models in these studies, two modifications of the considered models were proposed.
Research Questions
Our research question is to model the current geopolitical dynamics. We will build a spatial mathematical model based on real empirical data. Then we visualize the results and get the dynamics of changes for each state.
Purpose of the Study
The main purpose of this study is to build an adequate geopolitical picture of the world based not on subjective preferences and political views, but on empirical data and scientific method.
Research Methods
Empirical Data
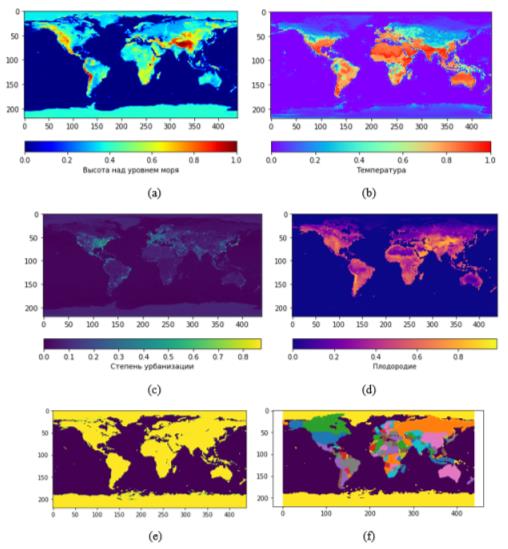
For empirical verification of the proposed modifications, spatial data describing various properties of the planet Earth were collected and processed. These data include information about the relief of the Earth's surface (see Figure 1a), temperature (see Figure 1b), soil fertility capacity (see Figure 1c), degree of urbanization (see Figure 1d), land and sea surfaces (see Figure 1e), political affiliation (See Figure 1f).
The Model of Geopolitical Interactions
Our model is based on the theory of the geopolitical position of Arzruni-Komlas (Artzrouni and Komlos, 1996) and the meta-ethnic borderland of Turchin (2003). It is a cellular automaton. The model space is a field divided into cells on which the action takes place. Each cell represents a geographical area with a certain value of its own strength (so-called asabia as the degree of cohesion of people, internal solidarity) and may belong to one of the empire states or without a state region. Also, the rules of the model take into account such spatial and geographical features of the terrain as its belonging to land or sea and its relief (mountains, plateaus, plains, rivers). Thus, the model assumes three spatial levels: resource, political and relief.
Before starting the model, data on the geographical relief (altitude above sea level) and the belonging of the site to land or sea, the political affiliation of the territory and the degree of urbanization are loaded into it. For land plots, the value of their resource is also determined, corresponding to the level of fertility according to Figure 1d. The territories of the States were projected on the field (See Figure 1f). One of the differences between this model and the frontier model is that the center of the empire becomes not the arithmetic mean coordinates of all points, but the point with the highest value of urbanization. For the convenience of perception, territories belonging to one state are painted with an individual shade of color. It was also possible to display the resource values of individual cells (the larger the resource, the lighter the color. During the implementation of the model, the cells captured by any empire are assigned its index. Cells belonging to a stateless space have an affiliation index of 0 and are colored in a neutral uniform gray color.
The value of the resource at each point corresponds to its asabia (internal solidarity) represents the degree of collective solidarity among the population either in relation to the empire to which they belong, or to itself, if the cell does not belong to any of the states. The dynamics of changes in the resources of each cell belonging to an empire is determined by its position within that empire.
If the cell is located inside the empire (all the surrounding cells have the same index other than 0), then its asabia gradually decreasing:
(1)
Where is time, isasabia reduction coefficient.
If a cell is located on the border of an empire (any of the four surrounding cells belongs to another state or stateless area), then its internal asabia increases according to the logistic equation:
(2)
It is important to note here that only four cells (two vertically and two horizontally) are considered neighboring cells.
The empire states themselves are characterized by an average value of asabia at each step of the simulation:
(3)
where is also time, – empire-state index, are spatial coordinates.
After receiving data on the average asabia of all empires, each of the border cells of the state attempts to attack neighboring cells. The result of the attack depends on the strength of the attacker and defending cells respectively, which are calculated as follows:
(4)
where is average level of asabia of i-th the empire to which the cell belongs; d is the distance from this cell to the center of the empire; h is the degree of weakening of the cell's strength with increasing distance from it to the center of the empire; R is the height of the relief; r is the coefficient of significance of the relief for the strength of the cell. At the same time, the conditional center of the empire remains static. If the difference between the attacking and defending cell exceeds some minimum required value :
(5)
then the attacked cell is assigned the index of the attacking cell. The level of asabia in the captured cell is calculated as the average between the value of its asabia before capture and the asabia of the attacking cell. If the attack was unsuccessful, then nothing happens. The order in which the attack of neighboring cells occurs is random.
The results of modeling these geopolitical interactions on the example of a map of Europe with the inclusion of a part of North Africa have a very average nature of approximation to historical reality. Over the course of several hundred iterations, we managed to get very conditionally closer to the outlines of the political borders in this region. Obtaining more accurate results requires a better selection of model parameters and its possible refinement.
Findings
During the computer experiment, computer programs corresponding to the models and algorithms described in this article are implemented, applied to the corresponding data from the Section of the Empirical Data. The solution of the problem was carried out using the program code on the machine AMD Phenom(tm) II X3 720 Processor 2.80 GHz, RAM 14,0 Gb, 1.333 MHz ОЗУ в среде Windows 7 64-bit. The software implementation of algorithms and mathematical models was developed in the high-level programming language Python 3.5 using the Anaconda editor. Figure 3 provides examples of the implementation of the model.
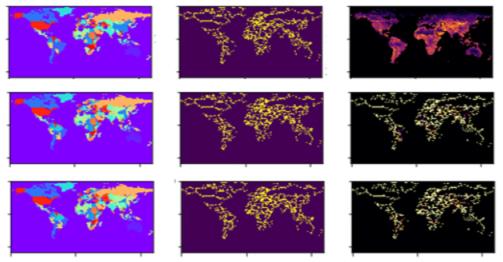
As can be seen from the simulation results, the territories of such large states as the USA, Canada and partly Russia. In the latter case, the author was alarmed by the loss of a significant part of the territory of the Russian Federation in the southwest in the area of the Black and Caspian Seas and in the south in the area between Omsk and Yekaterinburg.
The territories of the Central European countries also remained unchanged, because due to the scale of the model, the countries of this region almost immediately received the maximum level of asabia, which eventually led it to a stationary state. The disappearance of a large territory of China under the influence of expansion from Mongolia, North Korea and Malaysia turned out to be extremely unexpected, which indicates the incorrectness of the model and the need for a more careful selection of its parameters. Unfortunately, the large scale of the model and the insufficient computing power of the equipment did not allow enough experiments to be carried out for better tuning of the model. Nevertheless, the proposed model allows us to work out a large number of different scenarios for the development of geopolitics in the future.
Conclusion
The spatial model of geopolitical interactions we have built has proved to be quite workable. The model clearly demonstrated the influence of geographical and climatic data on the territorial distribution of the borders of state agencies. Due to the complexity and non-linearity of the considered problem of territorial dynamics of each particular state, it is difficult to assume how the position of borders will change in reality. The authors see it as very promising to track the dynamics not of individual states, but of their groups, economic unions or military blocs (Golubkov & Krugliakv, 2010; Heligman & Pollard, 1980; Schoen, 1988). The future will show how adequate our forecasts will be.
References
Artzrouni, M., & Komlos J. (1996). The formation of the European state system: a spatial “predatory” model. Historical Methods 29, 126-134. https://artzroun.perso.univ-pau.fr/FilesHP/Papers/EuropeanStateSystem.pdf
Arzimbekov, A., Malafeyev O., Redinskikh, N., Zaitseva I., & Shuvaev, A. (2020). Non-cooperative game of participant choice in a public private partnership using a compromise solution. Proceedings 2nd International Conference on Control Systems, Mathematical Modeling, Automation and Energy Efficiency. DOI:
Avila, X. S., Massias, H., & Quisquater J.-J. (2019). Design of a secure timestamping service with minimal trust requirements. In 20th Symposium on Information Theory in the Benelux.
Back, А. С. (2018). Hashcash — a denial of service counter-measure. Retrieved on May 04, 2022, from http://www.hashcash.org/papers/hashcash.pdf
Bayer, D., Haber, S., & Stornetta, W. S. (2020). Improving the efficiency and reliability of digital timestamping. In Sequences II: Methods in Communication, Security and Computer Science. DOI:
Chernavsky, D. S., Chernavskaya N. M., Malkov S. Yu., & Malkov A. S. (2010a). The struggle of conditional information. History and synergetics: Mathematical models of social, economic and cultural dynamics. KomKniga.
Chernavsky, D. S., Chernavskaya N. M., Malkov S. Yu., & Malkov A. S. (2010b). Geopolitical processes as an object of mathematical modeling. History and synergetics: Mathematical models of social, economic and cultural dynamics. KomKniga.
Golubkov, V. V., & Krugliakv, C. V. (2010). Construction of the prognostic two-parametric age fertility model by Russian data, Dynamics of heterogeneous systems. Proceedings ISA RAN.
Heligman, L., & Pollard, J. H. (1980). The age pattern of mortality. Journal of the Institute of Actuaries 107(1). DOI:
Huang, J., Qiu, J., & Simos, T. E (2020). Symmetric seven-stages multistep perfect in phase embedded pairs. AIP Conference Proceedings 2293(1), 112-119. DOI:
Korotaev, A. V., & Grinin L. E. (2009). Mathematical model of the influence of the interaction of the civilizational center and the barbaric periphery on the development of the World-System. History and Mathematics: Models and theories / Ed. L.E.Grinin, A.V.Korotaev, S.Yu. Malkov. Book House "LIBROCOM".
Korotaev, A. V., Malkov A. S., & Khalturina D. A. (2007a). The laws of history. Age-old cycles and millennial trends. Demography, economics, wars. KomKniga, 2007.
Korotaev, A. V., Malkov A. S., & Khalturina D. A. (2007b). The laws of history. Mathematical modeling of the development of the World-System. Demography, economy, culture. URSS, 2007.
Malafeyev, O., Zaitseva, I., Shkrabak, V., Shkrabak, R., & Onishenko, V. (2020). Model of multi-agent interaction between financial service providers and consumers. AIP Conference Proceedings 2293(1), 412-425. DOI:
Malkov, S. Y. (2004). Mathematical modeling of historical dynamics: approaches and models // Modeling of socio-political and economic dynamics. RGSU.
Nemnyugin, S., Malafeyev, O., Zaitseva, I., Shlaev, D., & Temmoeva, S. (2020). Interdisciplinary Approach to Social-Economic Simulation, Proceedings. 2nd International Conference on Control Systems, Mathematical Modeling, Automation and Energy Efficiency DOI:
Pichugin, Yu. (2018). Notes on using the principal components in the mathematical simulation. Polytechnical University Journal: Physics and Mathematics 11(3), 74-89. https://physmath.spbstu.ru/userfiles/files/articles/2018/3/ENG_07_56-69_11(3)2018.pdf
Schoen, R. (1988). Modeling Multigroup Populations. Plenum Press. DOI:
Smirnov, I. A., Malafeyev, O. A., Smirnova, T. E., Yakovets, Yu. V., & Strekopytov, S. A. (2021) The Problem of Clustering Countries of the World on the Geopolitical Data. IOP Conference Series: Materials Science and Engineering 1079(5), 62-66. DOI:
Turchin, P. & Gavrilets, S. (2009). Evolution of Complex Hierarchical Societies. Social Evolution & History 8(2), 167-198.
Turchin, P. V. (2003). Historical dynamics. On the way to theoretical history. LKI.
Copyright information

This work is licensed under a Creative Commons Attribution-NonCommercial-NoDerivatives 4.0 International License.
About this article
Publication Date
29 August 2022
Article Doi
eBook ISBN
978-1-80296-126-3
Publisher
European Publisher
Volume
127
Print ISBN (optional)
-
Edition Number
1st Edition
Pages
1-496
Subjects
Economics, social trends, sustainability, modern society, behavioural sciences, education
Cite this article as:
Malafeyev, O., Smirnov, I., Zaitseva, I., Smirnova, T., Strekopytov, S., & Orlov, V. (2022). Researching Of Trends In The Development Of The Current Geopo-litical Situation. In I. Kovalev, & A. Voroshilova (Eds.), Economic and Social Trends for Sustainability of Modern Society (ICEST-III 2022), vol 127. European Proceedings of Social and Behavioural Sciences (pp. 391-398). European Publisher. https://doi.org/10.15405/epsbs.2022.08.44