
Business Administration Based On Assessments Of Total Industry Competitiveness


Abstract
A developing company moves through all life cycle stages, requiring a constant monitoring of the level of competitiveness in order to choose a further development strategy. Based on a modern interpretation of competitiveness as a multifactorial process of nurturing competitive relations, it should comply with the most important condition for its full implementation – competitiveness-oriented business management. In the most general form, competitiveness-oriented management is a conscious human impact on objects and processes with a view to calling the tune to economic development and achieving the desired effect. The paper discusses the stages of implementing a methodology for assessing the competitiveness of an industry enterprise. It primarily focuses on adapting universal metrics of competitiveness to industry and developing the most integrated calculation option. Obtaining total sectoral competitiveness is necessary for a more detailed assessment of the phenomenon, which necessitates the implementation of such comprehensive stages as calculation and conversion of simple metrics into relative values; calculation of group competitiveness indicators; construction of a polygon of industry competitiveness; integral assessment of competitiveness. The subject of research is a container terminal and the details of assessing its competitiveness. The proposed methodology for assessing competitiveness is focused on the industry practices and provides for the calculation and assessment of five groups of metrics: competitiveness of production base; competitiveness of production processes; competitiveness of financial processes; efficiency of sales and promotion; competitiveness of services. The paper proposes to use a model of managerial impact with an appropriate level of intensity, focused on total business competitiveness.
Keywords: competitiveness, simple metrics, polygon of competitiveness, integral index, managerial impact
Introduction
In a highly competitive transport market, the focus of industry management on the use of science-based approaches to assessing and strengthening competitiveness is becoming increasingly important.
Foreign and Russian authors studied the issues of competitiveness (Azoev & Chelenkov, 2000; Mescon, Albert & Khedouri, 1993; Porter, 2005; Fatkhutdinov, 2005; Hamel, 2002; Yudanov, 2001; Learner, 1984). M. Porter defined competitiveness as the ability of a certain object or subject to meet the needs of those interested in comparing it with other similar subjects or objects (Porter, 2005). M. Mescon called competitiveness a relative characteristic that recognizes the level of development of a given firm relative to competing firms in terms of customer satisfaction and the efficiency of production and economic operations (Mescon, Albert & Khedouri, 1993). According to R. Fatkhutdinov, competitiveness is a property of an entity, characterized by the degree of real or potential needs to be satisfied as compared with similar entities on the market (Fatkhutdinov, 2005).
Problem Statement
However, these definitions of competitiveness, as well as other definitions proposed by the above authors, do not sum up the processes characteristic of the transport industry, nor do they essentialize the phenomenon of competitiveness at such a special form of transport company as a container terminal.
A poorly depicted portrait of container terminal in defining the concept of competitiveness in scientific literature is accordingly a poor guide to the choice of industry criteria for its assessment. The existing methods for assessing the competitiveness of a transport company showed that they all have certain shortcomings questioning their application to assess the performance of container terminals. Firstly, some of the methods require a lot of information that businesses do not always have. Secondly, some individual competitiveness metrics duplicate production and financial indicators, but are calculated in non-comparable values and therefore cannot be assessed in an integrated way. Thirdly, the methods are not adapted to the container transshipment industry, they are universal, so service quality indicators are insufficiently elaborated and are not very informative.
Research Questions
A container terminal operates as a transshipment (stevedoring) facility and is a geographically designated point featuring a set of transport vehicles and structures for performing operations related to arrival-departure, loading-unloading, import-export, sorting and temporary storage of containers, as well as commercial and technical services to maintain these operations.
The competitiveness of a container terminal as a phenomenon has been little described in the scientific literature. However, the following definition can be found saying that it is a relative attribute indicating the ability of a terminal operator to meet full customer’s transshipment requirements within the end-to-end supply chain, to retain current cargo flows, and to win new by competing in both domestic and foreign markets at the expense of quality improvements and in response to external conditions (Abolentseva, 2008).
Purpose of the Study
The paper aims to develop a system for assessing the competitiveness of container terminals and use it to guide managerial actions on enhancing the level of competitiveness;
Research Methods
The following scientific methods were used, namely: analysis (including economic, systemic), synthesis, comparison, description, method of scientific abstraction, model building, expert methods, etc.
Findings
Development of a modern methodological approach to assessing the competitiveness of container terminals.
Having explored a list of shortcomings found to be present in universal methods for evaluating the competitiveness of an enterprise, it is necessary to highlight the main requirements for the system to be developed to assess the competitiveness of a container terminal (Radionova, 2019). The assessment system should be based mainly on quantitative methods, which will reduce as far as possible any subjective slanting in evaluation; the system of indicators should be adapted to the activities performed by container terminals; competitiveness is a complex characteristic, so it should be expressed through a system of generalizing metrics – simple, group, integral; the system of indicators should be visual, so, along with quantitative assessments, graphic evaluation methods should be used.
In accordance with the approach proposed, the competitiveness of a container terminal should be assessed in four stages, as shown in Fig. 01.
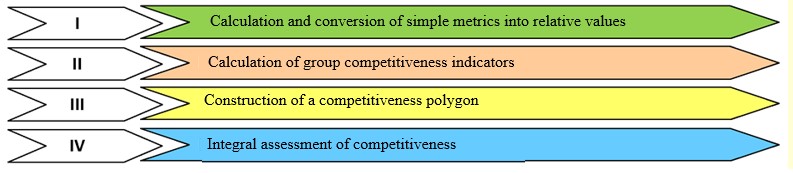
For a detailed consideration of the algorithm, we highlight the main sequential stages to be taken in assessment.
Stage 1. All simple metrics coming under different groups are calculated. The author offers five groups of metrics. For the most part, the simple metrics in groups 1-4 are universal and many of them are consistent with the theory of effective competition. Since today the competitiveness of a container terminal is largely attributed to its infrastructure available, it is also proposed to evaluate the indicators characterizing the competitiveness of production base, including production capacity of freight terminals, peak capacity of railways, area of warehouses, availability of transshipment equipment and road trains.
Competitiveness metrics and formulas are shown in Table 01.
The following metrics are advised to assess the competitiveness of services provided by container terminals:
1. Rate. Since companies providing transshipping services are toughly competing, rate policy is of great importance for attracting and retaining clientele. The rate is the price per unit of hauling operations, adapted to the cost of transshipment operations, as well as profitability defined as the profit-to-cost ratio.
2. Product mix width and completeness. Today, clients using cargo terminals seek to receive a full transshipment cycle, handling as much cargo as possible, on the one hand. On the other hand, customers find it relevant to know a whole range of cargo, services and operations performed therewith. For this reason, the product mix width should be assessed by the ratio of the number of goods handled by the terminal and the number of goods offered by the market, with competing terminals in mind, whereby completeness – by the ratio between the number of services offered by the terminal and the market.
3. Reliability of a container terminal measures its ability to fulfill orders on time and in full.
4. Loss and damage of a package shows the proportion of orders completed with damage or loss of a package during transportation or loading and unloading operations in the total annual number of orders completed by the container terminal.
5. Timeliness measures the share of on-time, i.e. non-disruptive, orders in the total number of orders executed by the container terminal throughout a year.
6. Promptness characterizes the share of urgent orders completed throughout a year in the total number of orders.
To convert simple metrics into relative values, they are compared with a baseline. The following can be used as a basis for comparison: the industry average; the performance of any competing or market leader; and the past performance of the company being evaluated.
To convert the metrics into relative values, a 15-point scale should be used. A 5-point scale is defined as an indicator with a value worse than the baseline value; a 10-point scale is equal to the baseline value; a 15-point scale is better than the baseline value.
Stage 2. Group metrics are comprehensive characteristics that measure the competitiveness of certain activities performed by container terminals. The group metrics basically can be calculated by the point method (Abramova, 2017):
(1)
where is the weighting coefficient of a metric (criterion); is the score in relative values assigned to a metric (criterion); is the number of criteria, i 1,...n and j 1,...n.
Below are the formulas for calculating the group metrics, where the numerical coefficients are the weights of the criteria defined by the expert method. The competitiveness of the production base:
, (2)
where C is production capacity available; is railway front capacity; C is warehouse area available; C is reloading equipment and road trains available.
Competitiveness of production processes:
, (3)
where is production costs per unit of transport products; is return on assets; product profitability; is workforce productivity.
Competitiveness of financial processes:
, (4)
where is company’s equity; is financial sustainability; is cash ratio; is sales to working capital.
Organization of sales and promotion:
, (5)
where is capacity utilization; С is return on sales; is effectiveness of advertising and sales promotion.
Competitiveness of transport services:
(6)
where is rates; is product mix width; is product mix completeness; С is company’s reliability; is loss and damage to cargo; С is timeliness; С is promptness.
Stage 3. It involves using one of the graphic methods for assessing competitiveness. For example, a competitiveness polygon. It is a vector-axe graphical representation of assessments connecting the position of the terminal and competitors in the most significant areas of activity. The facets of the polygon characterize the competitiveness of the container terminal each in a particular way, based on 22 simple metrics, or on 5 group criteria.
Stage 4. Total company competitiveness () is calculated (Abramova, 2017):
, (7)
where are the weights assigned to the indicators (criteria); is the score in relative values assigned to an indicator (criterion); is the number of criteria, n = 5.
The weighted values of the metrics are determined by one of the expert methods – the method of paired comparisons. The expert “weighs in twos” the parameters in a paired-comparison matrix, answering the question: “Which of the two parameters has a greater impact on competitiveness metrics?” and line by line in the matrix indicates: “How many times the “weight” of the parameter in row i is greater than the “weight” of the parameter in column j”.
There are a number of approaches to decide on the number of experts. It is recommended to involve 10-30 people in an expert survey to solve various classes of problems (Beshelov & Gurovich, 1980), which corresponds to the size of a group of experts composed of 15 people. The experts were managers working at container terminals (8 people), forwarding companies in the container shipping market (3 people), operators of container lines (2 people), academia (2 people).
The methods of paired comparison of criteria should start with composing a square matrix, in which the number of columns and rows is equal to the number of parameters. The table should be filled in in the following order (Abramova, 2017): first, the cells above the diagonal consisting of values equal to 1 are filled in the table: expert values are put into the cells of rows i and columns j above the diagonal in accordance with the scale; second, the cells below the diagonal are filled in, into which values are put that are equal to the reciprocal of the values in the cells above the diagonal, symmetrically arranged.
The paired comparison matrix is filled with the coefficients as per the condition in the formula:
In this case, the following condition must be fulfilled: = 2 for
When the criteria corresponding to the condition are ranked, after filling the paired comparison matrix with the coefficients, we obtain that the importance factors for the criteria ( = 1,…) are members of a decreasing arithmetic progression with a step: = 1.5 – 0.5 = 1
The following expressions take place (Beshelov & Gurovich, 1980):
1 = ( – 1) · 1.5 + 1 ; = ( – 1) · 0.5 + 1; =1 – (– 1) · Δ
The cumulative importance is calculated by the formula (Spiridonov, 2017):
(8)
The cumulative importance can be calculated as a sum of the members of this arithmetic progression using the following formula:
, (9)
The weight coefficients of thei criteria are calculated by the formula (Spiridonov, 2017):
, (10)
where is the cumulative importance of the criteria.
After substituting the values of and into formula (10), we obtain the following formula for calculating the weight coefficients of the criteria (Spiridonov, 2017):
, (11)
where is the reference number of an ith criterion (the reference position in the matrix).
Table 02 is filled in line with the above algorithm.
The paired comparison matrix is compiled by assigning reference numbers to the criteria: 1 criterion – the competitiveness of the production base; 2 criterion – the competitiveness of production processes; 3 criterion – the competitiveness of financial processes; 4 criterion – sales efficiency; 5 criterion – competitiveness of transport services.
The rank of a metric is determined by the sum of the values in each row of the matrix. The criterion with the highest sum of values ranks first. In our case, this is the fifth criterion (competitiveness of transport services). Then the places are sequentially assigned to each of the criteria. The weighting coefficients are calculated for each of the five criteria as follows:
Based on the known weighting coefficients and five parameters, we obtain a formula for calculating total competitiveness of a container terminal:
, (12)
where is company competitiveness; C is competitiveness of the production base; C is competitiveness of production processes; is competitiveness of financial processes; is the effectiveness of sales and promotion on the market; C is competitiveness of transport services.
Container terminal management model based on the results of assessing total competitiveness
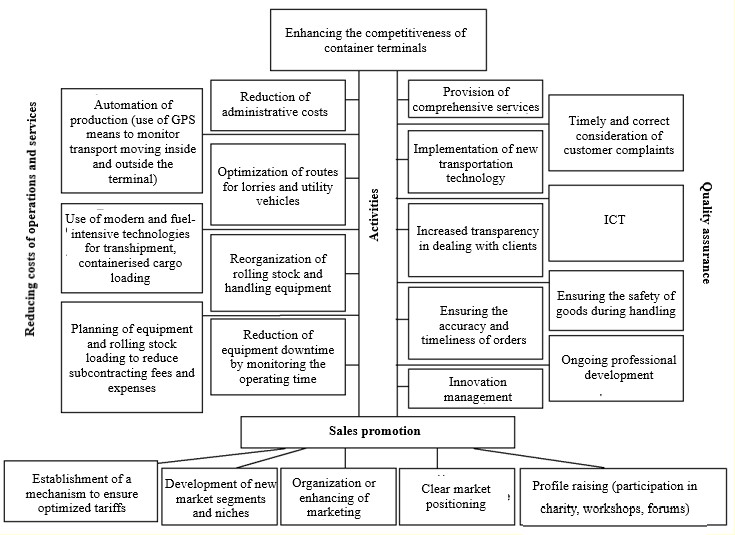
The main goal of measuring and analyzing total competitiveness of a container terminal is a subsequent managerial impact aimed at enhancing the competitiveness. The managerial impact should be expressed as a set of measures that strengthen the position of a company in external and internal environment. A list of measures to enhance the competitiveness of the container terminal is concentrated in the main problem areas: they are geared to reduce costs of operations and services provided by the terminal, promote sales and improve the quality of work. Each of the problem areas calls for terminal administration to implement a set of tactics aimed at improving it. A list of possible actions within problem areas is shown in Fig. 02.
Managerial impacts can have different intensity. There can be a different number of actions for measures implemented, both per unit of time and by the totality of simultaneously covered problem areas. A 15-point scale can also be used to measure the intensity of managerial impact. A 5-point scale should be used to rate intensity at a level lower than the past performance of the company being evaluated; a 10-point scale should rate intensity for the previous years; and 15 points – a higher intensity than the past performance of the company. Based on the proposed grading of management intensity, the dependence of the latter on the level of detected total competitiveness can be as follows (Table 03).
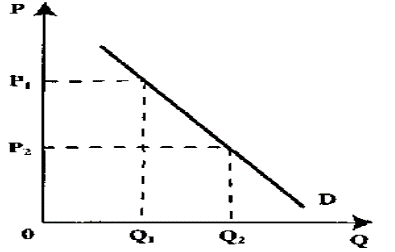
Based on the inverse correlation between the degree of managerial actions and the level of integral competitiveness derived during the analysis, the model of this correlation may have the following graphic form shown in Fig. 03, where P is the intensity of measures implemented to enhance competitiveness (intensity of management impact); Q is the level of total competitiveness.
Conclusion
Tougher competition in transport services forces container terminals to pay greater attention to measuring the level of their own competitiveness in comparison with economic rivals. However, adapting versatile approaches to assessing the level of specific industry competitiveness is quite relevant.
The proposed method for assessing competitiveness is tailored to specific characteristics of container terminals. The author’s method used for assessing the level of competitiveness on a practical example has shown its flexibility, efficiency and informative value.
The analysis and assessment of integral competitiveness should be followed by corresponding managerial actions. The model proposed by the author based on integral competitiveness shows the inverse correlation between the intensity of managerial actions and the level of competitiveness.
References
Abolentseva, N. O. (2008). Methods for assessing and improving the competitiveness of marine container operators: [Thesis]. Admiral Ushakov Maritime State University.
Abramova, I. G. (2017). Assessment of product competitiveness. Samara State Aerospace University.
Azoev, G. L., & Chelenkov, A. P. (2000). Competitive advantages of the company. JSC Typography “Novosti”.
Beshelov, S. D., & Gurovich, F. G. (1980). Mathematical and statistical methods of expert assessments. Statistics.
Fatkhutdinov, P. A. (2005). Organizational competitiveness management: textbook. Eksmo.
Hamel, G. (2002). Competing for the Future. Building the markets of tomorrow. JSC Olymp-Business.
Learner, E. E. (1984). Sources of International Comparative Advantage: Theory and Evidence. MIT Press, 3.
Mescon, M. H., Albert, M., & Khedouri, F. (1993). Management. Delo.
Porter, M. E. (2005). Competitive Advantage: Creating and Sustaining Superior Performance. Alpina Business Books.
Radionova, V. A. (2019). Research and assessment of the competitiveness of transport companies in the Russian Federation. Modern scientific research and innovation, 3. http://web.snauka.ru/issues/2019/03/88861
Spiridonov, S. B. (2017). Analysis of approaches to the selection of criteria weighting coefficients by the paired comparison method. Science Studies, 6. https://naukovedenie.ru/PDF/16TVN617.pdf
Yudanov, A. Yu. (2001). Competition: theory and practice. Gnome and D.
Copyright information

This work is licensed under a Creative Commons Attribution-NonCommercial-NoDerivatives 4.0 International License.
About this article
Publication Date
31 March 2022
Article Doi
eBook ISBN
978-1-80296-124-9
Publisher
European Publisher
Volume
125
Print ISBN (optional)
-
Edition Number
1st Edition
Pages
1-1329
Subjects
Freedom, philosophy, civilization, media, communication, information age, globalization
Cite this article as:
Ilyina, M. S. (2022). Business Administration Based On Assessments Of Total Industry Competitiveness. In I. Savchenko (Ed.), Freedom and Responsibility in Pivotal Times, vol 125. European Proceedings of Social and Behavioural Sciences (pp. 684-694). European Publisher. https://doi.org/10.15405/epsbs.2022.03.82