
Food Consumption Patterns In Yakutia Based On The Analysis Of State Statistics


Abstract
Over the past decades, industrial development, urbanization, globalization, as well as economic development and socio-economic crises have caused rapid changes in diet and lifestyle of the population of Yakutia. According to existing international statistics, quality of diet has a significant impact on health and life expectancy of population. The article is concerned with specific features of food consumption patterns in Yakutia as a region, as well as with compliance of energy and nutritional value of the food consumed with the recommended standards. The study is based on a summary of state statistics data starting from the mid-1990s, which allowed one to compare the behaviour and structure of food consumption with the key socio-economic indicators of living standards. The study showed that the share of food expenditures in consumer spending pattern, as well as purchasing power for various types of food, is qualitative indicators of the living standard. The share of food in consumer spending pattern in Russia has consistently been high compared to other countries for over a decade, which is indicative of the persistent poverty rate. Yakutia shows higher consumption of bread, meat, and sugar, and a lower consumption of vegetables, milk, eggs, and vegetable oil compared to the regions of Russia’s Far East and Russia as a whole. This is a consequence of both the sustainability of traditional food patterns and the underdeveloped healthy lifestyle skills.
Keywords: Consumer spending pattern, food consumption, Yakutia
Introduction
State statistics data describing the structure and behaviour of incomes and expenditures of population, including sample surveys of household budgets, being undertaken since the mid-1990s, make it possible to assess the progress of social processes and track changes in the quality and style of life over a fairly long period of time. In accordance with the current Rosstat methodology, personal consumption expenditures include 4 major groups: purchase of food (for which a break-down by commodity group is available), purchase of alcoholic beverages, purchase of non-food products, and payment for services.
Food consumption, being a basic need, is closely related to food security. It exists when all people, at all times, have physical and economic access to safe and nutritious food that meets their dietary needs and food preferences in quantity sufficient for an active and healthy life (Food and Agriculture Organization of the United Nations, 1996). Existing international statistics show a strong correlation among food availability and diet, and life expectancy. In accordance with the Food Security Doctrine of the Russian Federation, approved by Decree No. 20 of the President of the Russian Federation dated January 21, 2020, physical availability of food means availability of a set of basic food commodities in each local market, in such volume and range that correspond to the recommended reference consumption rates. Individual studies show that due to natural-climatic and ethno-cultural diversity, as well as disparities in the living standards and quality of life, Russia is distinguished by significant regional variations in food consumption (Agbalyan & Kolesnikov, 2018; Fatkullina & Karimov, 2019; Vaskin & Korosteleva, 2020). According to a number of authors, the physical availability of food in Russia shows primarily its availability in the required volume and range in places of residence, and only secondly – the possibility of purchasing food through retail network. This is due to the fact that the country has northern and other remote territories, uneven distribution of industries, underdeveloped food delivery logistic chains, as well as due to contribution of private subsidiary plots to the country’s food supply situation (Botkin et al., 2017, p. 13).
Problem Statement
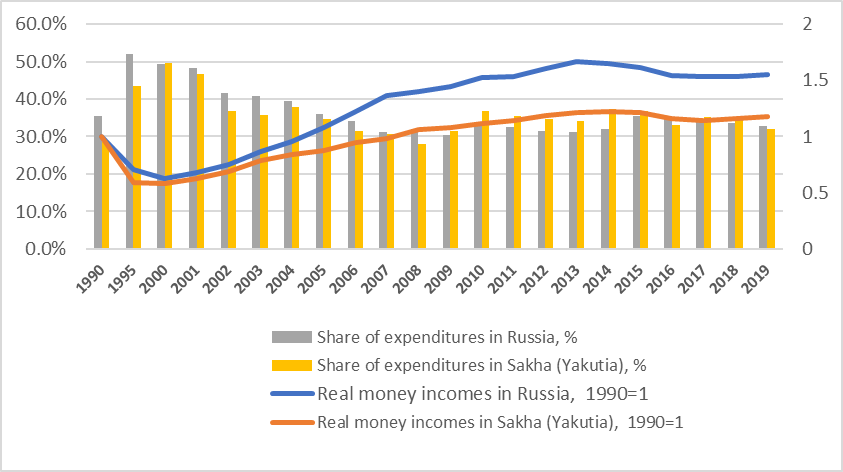
The share of food expenditures in the consumer spending pattern is one of the key indicators of the living standard. Reduced proportion of food expenditures indicates a transition to a higher quality consumer model and improvement of the living standard (Ovcharova et al., 2014). This is confirmed by data in Fig. 1, which shows that growth of real monetary incomes was accompanied by a relative reduction of food and non-alcoholic beverages segment in consumer spending patterns in the Sakha Republic (Yakutia) and in Russia as a whole. At the beginning of perestroika, in 1990, the share of food expenditures made 28.6% in the Sakha Republic (Yakutia), and 35.5%. in the Russian Federation. Market reforms that followed shortly, accompanied by galloping inflation, food shortages, and declining living standards, led to 43.5% and 52.0% increase in food expenditures in 1995, respectively. Rise in living standards in the 2000s allowed one to gradually return to pre-reform values; the most favourable situation was observed in 2008, when the share of food expenditures made 28% in Yakutia, and 32% - in Russia as a whole.
After the financial crisis of 2008-2009, the values of this indicator increased, which reflects a long-term trend towards a fixed poverty rate in Russia against the background of slight but stable economic growth. “The first decade of the 21st century was a ‘golden era’ during which the standard of living in Russia was sustainably and steadily growing. Economic growth made it possible to balance a steep downfall in living standards, observed in the 1990s at transition to market economy. But the national poverty rate continues to be one of the highest in the world, which does not correspond to the role and weight of the country in international politics and world economy” (Gavrilyeva et al., 2019, p. 39). In 2020, the share of food expenditures in Russia reached 29.7%. In terms of the share of food in household spending Russia ranks 31st among 40 European countries. “Luxembourg is ranked first. The residents of the country spend only 8.4% of their expenses on food. Next come the Netherlands and Great Britain with 10.6% of expenditures... In general, the top positions of the rating are occupied by economically developed Western European countries. Citizens of the former Soviet Union countries and Eastern European states account for the most significant share of food expenditures in their total consumer spending. The last place is occupied by Kazakhstan; here people spend the largest share of expenses on food out of all countries in the rating – 49.4%” (RIA, 2020, p. 1). Thus, the behaviour of the share of food expenditures qualitatively reflects the behaviour of the living standard, which makes it possible to use it for comparative intercountry and interregional analysis.
However, proper understanding of the consumer spending pattern and regional characteristics of food consumption by the residents of the Sakha Republic (Yakutia) is still lacking. This paper aims at filling this research gap.
Research Questions
The article is concerned with specific features of food consumption patterns in Yakutia as a region, as well as with compliance of energy and nutritional value of the food consumed with the recommended standards. In this paper we answer the following questions: what are the dynamics of changes in the structure of food consumption in Yakutia over the past decades; which features distinguish consumer spending patterns and the purchasing power of households in Russia and in Sakha (Yakutia); which factors affect consumer food preferences in Yakutia?
Purpose of the Study
The purpose of the study is to identify the regional characteristics of food consumption by the residents of the Sakha Republic (Yakutia) based on the analysis of state statistics data available starting from the mid-1990s.
Research Methods
The study is based on generalization of state statistics data starting from the mid-1990s; standard statistical methods were used for the analysis.
Findings
Food in consumer spending pattern
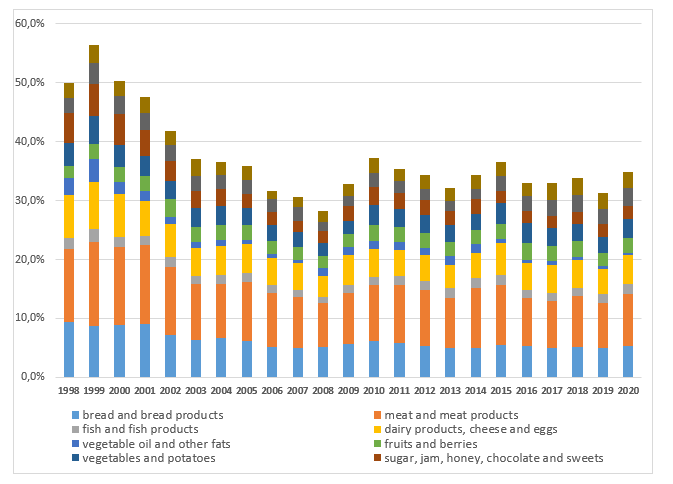
In the Sakha Republic (Yakutia), the share of food expenditures, including alcoholic beverages and tobacco products, in the consumer spending pattern decreased from 47.4% in 1998 to 32.7% - in 2019 (Fig. 2). In the context of commodity groups, a relative reduction of expenses for purchasing bread, meat, sweets, vegetable oil, dairy products and fish, vegetables and potatoes can be observed, while expenditures on fruits and berries, tea, coffee and non-alcoholic beverages, as well as on alcohol and tobacco products, have increased. Goods that account for increased expenditures, as a rule, are imported from other regions of Russia and from abroad; some of these are excisable goods. Accordingly, this behaviour fairly reliably reflects the outstripping growth in prices for certain commodity groups due to increased excise taxes, transport costs, etc. Therefore, the analysis of consumer spending should be combined with the behaviour of food prices, which were growing unevenly for individual commodity groups in the period under review.
Consumer purchasing power
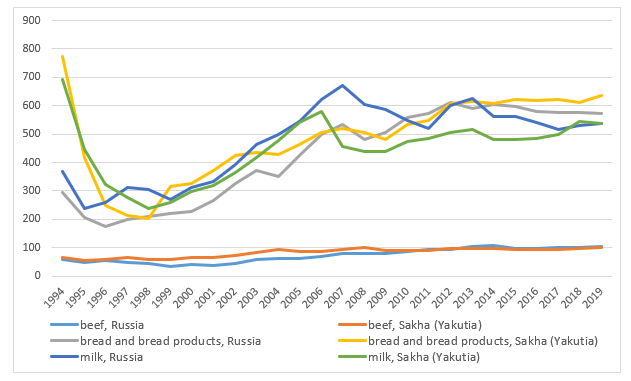
Purchasing power of average per capita income of the population of the Russian Federation and the Sakha Republic (Yakutia) is also sensitive to the living standard and prices for basic consumer goods. The 1990s saw a sharp decline associated with the crisis; over the past 10 years, from 2008-2009, a stabilization is observed as for the staple food (Fig. 3). At the same time, similar to the food expenditure share indicator, the stability of this indicator reflects the persistence of poverty in Russia. A distinctive feature is a sharp drop in case of the northerners relative to Russia as a whole. In 1994, the purchasing power of their incomes was significantly higher than that in the country on average – almost twice for some food groups (bread, milk). Starting form 1996, this advantage has been practically leveled out. Growing food prices, among other, due to transportation costs, “absorbed” the northern guarantees. “The Far Eastern regions of the Russian Federation are distinguished by significant transportation distances, high cost of energy resources and electricity, resulting in increased cost of living. Meanwhile, wages and other incomes of the population are comparable to those of residents of the central regions of Russia. The role of northern allowances and regional premium rates as incentives to attract active-age population decreased, as well as amounts thereof due to abolition of regional 30% premiums of the Soviet period” (Naberezhnaya, 2017, p. 170).
In 2019, for such product groups as eggs, the purchasing power of Yakutia’s population was 14% lower than Russia’s average (4,981 eggs against 5,797), for sugar – 22% lower (667.3 and 860.7 kg, respectively), for potatoes – 42% lower (767.7 and 1,317.2 kg, respectively), for wheat flour – 8% lower (901.2 and 976.4 kg, respectively), for beef (except for boneless meat) – 3% lower (100.5 and 104 kg, respectively). The purchasing power of Yakutians is 28% higher for fish (232.2 and 181.9 kg, respectively), 30% for butter (78.5 and 60.4 kg, respectively), 5% for sunflower oil (370, 4 and 352.9 kg, respectively), 5% for bread and wheat flour bakery products (635.2 and 573.4 kg, respectively).
If we examine the purchasing power of population in terms of availability of the main food groups, the following specific features shall be seen. The availability of beef remains stable, but in the period from 1996 to 2011 the purchasing power of average per capita income in the Russian Federation was slightly lower than that in the Sakha Republic (Yakutia). Availability of bread fluctuated the most compared to other food groups. From the mid-1990s to 1998, there was a sharp decline of the purchasing power in the Sakha Republic (Yakutia). While in the mid-1990s it was almost 2.5 times higher than Russia’s average, in 1998 the availability of bread for the population of the Sakha Republic (Yakutia) dropped below the nation’s average. This was followed by a gradual growth until 2007, and a slight decline from 2007 to 2009; since then, it was growing steadily without critical fluctuation. From the mid-1990s to 1998, the availability of milk in the Sakha Republic (Yakutia) decreased sharply, but in the period from 1998 to 2006 there was a significant increase in purchasing power, which, however, did not reach the level of the mid-1990s. In 2006-2007, the purchasing power of the Sakha Republic (Yakutia) population fell sharply, followed by slow growth to the present day with a slight decline in 2013-2014. Thus, the purchasing power of average per capita income of Yakutia’s population is currently at approximately the same level with Russia as a whole.
Staple food consumption
State statistics data give an opportunity to assess staple food consumption profiles in Russia as a whole, as well as broken down by its federal districts and subjects of the federation. As shown in Table 1, the actual consumption in the region does not correspond to the reference consumption rates that meet up-to-date requirements of a healthy diet, approved by order No. 614 of the Ministry of Healthcare of the Russian Federation dated August 19, 2016. These reference rates represent average per capita consumption values of the main food groups, as well as range thereof, in kilograms per capita per year; they take into account chemical composition and energy value of food products and provide an estimated average per capita need for nutrients and energy, as well as variety of food consumed. It should be noted that reference consumption rates are regularly adjusted. Thus, in 2010, by order No. 593n of the Ministry of Health and Social Development of the Russian Federation dated August 2, 2010, the reference consumption rates were reduced and brought closer to the actual level of food consumption. The consumption rate of milk and dairy products decreased by 13.3%, eggs – by 11.0%, meat – by 7.4%, sugar – by 31.7%, potatoes – by 9.9%... Currently, there are acting recommendations on reference consumption rates, approved by order No. 614 of the Ministry of Healthcare of the Russian Federation dated August 19, 2016, which envisage a further reduction in food consumption rates. Analyzing the recommended consumption rates by type of meat, it can be concluded that they are linked to the actual production volumes (Botkin et al., 2017, p. 13).
The World Health Organization (WHO) does not give specific recommendations as for reference consumption rates for food groups mentioned in the order of the Ministry of Healthcare of the Russian Federation, except for the amount of vegetables and fruits per day. According to the WHO, a healthy diet for adults includes at least 400 g of fruits and vegetables per day (i.e. 145.6 kg per year), except for potatoes, sweet potatoes, cassava, and other starch-containing root vegetables. The WHO also recommends that adults with normal weight consume less than 18.2 kg of free sugars per year, free sugars being all sugars added to food or beverages by manufacturer, cook, or consumer, as well as sugars naturally contained in honey, syrups, fruit juices, and concentrates thereof. The rest of the WHO recommendations do not relate to consumption of certain food groups, but focus on the balance of proteins, fats, carbohydrates, and micronutrients in personal diet at different stages of life. For example, the WHO Study Group Report on Diet, Nutrition and the Prevention of Chronic Disease published in 2003 (Geneva) lists the following range of nutritional goals for the population: total fats – 15-30% of total energy value, total carbohydrates – 55-75% of total energy value, proteins – 10-15% of total energy value, unless otherwise specified. The recommended range should be considered in light of the Joint WHO/FAO/UN Expert Consultation, held in Geneva on April 9-16, 2002 (World Health Organization, 2003).
“Yakutia demonstrates some peculiarities in food consumption. Thus, average per capita consumption of meat and meat products exceeds nationwide standards (by 59-73.7 kg for working-age population), and as for other food products, the level of actual consumption per capita per year is insufficient” (Government of the Sakha Republic (Yakutia), 2019 par. 5, p. 11). In 2019, per capita consumption of meat and meat products in Yakutia was 20% higher than the reference rates, sugar – 50% higher, bread – 40% higher.
At the same time, consumption of milk and dairy products was lower by 14%, eggs – by 12%, vegetable oil – by 25%, potatoes – by 6%, vegetables, melons and gourds – by 51%, which was caused by a drop in consumption of these products occurring since 1990. Consumption of staple food in the Far Eastern Federal District, in general, is “something in between” the Sakha Republic (Yakutia) and Russia as a whole. Thus, the regional differentiation in food consumption is quite significant.
Considering the data on actual consumption from 1990 to 2019, the following changes will be noted in the eating behaviour of Yakutia’s population. Bread consumption per person per year has grown by 23% since the 1990s, and currently significantly exceeds the rate of bread consumption in the Far Eastern Federal District and in Russia as a whole. At the same time, “people started consuming less bread and cereal products (including cereals, which is key from the point of view of nutritional value) than in 1990 in 36 constituent entities of the Russian Federation, and in 9 of them the decrease was significant – by 23-25 %” (Aizinova, 2014, p. 52). This can be explained by the fact that bread has a higher purchasing power, it is more affordable for the poor than other products. Researchers specify that excessive consumption of bread and cereal products (pasta, cereals, flour) replenishes the caloric content of a diet (Borisova et al., 2020).
On the other hand, the analysis of historical trends, carried out in “The problem of valorization and mainstreaming of food culture of the peoples of the North in contemporary conditions (case study of Yakutia)” collective monograph, shows that in the late 19th - early 20th centuries local diet was dominated by the traditional range of products associated with the hunting/reindeer-breeding economic-cultural type (meat-fish diet). The local set of unprocessed food was then supplemented by imported products, the range of which expanded in the middle of the 20th century. Since then, the diet was being improved based on the traditional one. Evolvement of a modern diet based on the traditional pattern can also explain the high rate of meat consumption in the population of the Sakha Republic (Yakutia) (Borisova et al., 2020). In addition, a number of works in the field of nutritional hygiene, nutritional status, and assessment of the actual nutrition of the population of Yakutia show that healthy lifestyle habits and food culture are underdeveloped in the region, and the quality of food has been deteriorating. Insufficient consumption of such food as dairy, fish, meat products, including those of local origin, and ethnic dishes was revealed. It was substantiated that in winter the diet of inhabitants of the Far North has a low energy value, and lacks vitamins and minerals (Lebedeva et al., 2017; Neustroeva & Lebedeva, 2012; Shestakova et al., 2020).
Individual studies demonstrate that eating behaviour of inhabitants of the Arctic regions differs significantly due to the culture of “seasonal” diets, associated with the physical availability of food and a greater contribution of gathering, fishing, and hunting products in the diet. But there are still no scientifically based estimates of the share of local products in food provision patterns of Arctic residents. One cannot ignore the fact that fruits and vegetables, including melons and gourds, are often unavailable in isolated settlements, due to high costs and complex logistics, which complicates transition to modern food culture.
Energy and nutritional value of consumed food
According to Fig. 4, in 1994 the amount of calories consumed per day in the Sakha Republic (Yakutia) was lower than Russia’s average by 12% and in 1997 – by 21% (proteins by 18%, fats by 16%, carbohydrates by 21%), but gradually became on par with the nation’s average by 2019. It will be noted that data on energy and nutritional value are calculated based on food balances for the region as a whole. Therefore, research on the diets of various social and ethnic groups is required; this task is associated not only with the system of sensible nutrition, but also with the system of “northern deliveries” – the annual shipping of food to the Arctic regions of Yakutia.
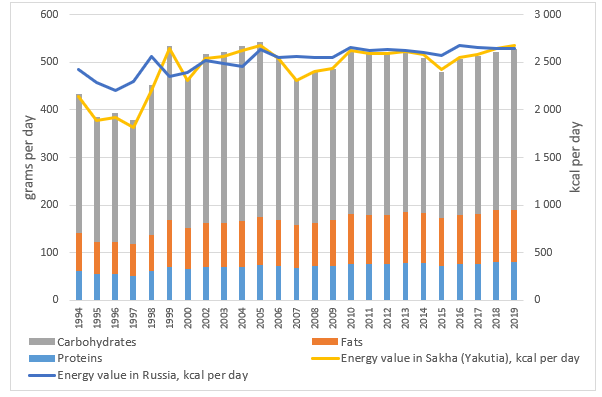
Despite the fact that in recent years the nutrition profile of the Sakha Republic (Yakutia) has generally improved, and nutritional and energy value of food has increased, it is still far behind the world standards, in particular the recommendations of the UN Food and Agriculture Organization and the World Health Organization. Thus, in 2013, the average calories per person per day (kcal) in the countries of the WHO European Region made 3,353 kcal, while in the CIS countries it was 3,175 kcal (World Health Organization, 2019). The energy value of the diet in Yakutia (2,675 kcal in 2019), as well as the Russian Federation as a whole (2,644 kcal in 2019), is 20-21% lower due to objective socio-economic factors (high poverty level, expensiveness and physical inaccessibility of certain food products).
Conclusion
The study showed that the share of food expenditures in consumer spending pattern, as well as purchasing power for various types of food, is qualitative indicators of the living standard. As real money incomes of the population grow and poverty rate drops, purchasing power increases and the share of food expenditures decreases. The share of food in consumer spending pattern in Russia has consistently been high compared to other countries for over a decade, which is indicative of the persistent poverty rate. Growing prices for imported and excisable goods during the years of reforms outweighed the “northern guarantees” introduced during the Soviet period. A regional specific feature of Yakutia as for consumption of food is discrepancy thereof with the reference consumption rates that meet modern requirements for a healthy diet, approved by the federal government. The region shows higher consumption of bread, meat, and sugar, and a lower consumption of vegetables, milk, eggs, and vegetable oil compared to the regions of Russia’s Far East and Russia as a whole. This is a consequence of both the sustainability of traditional food patterns and the underdeveloped healthy lifestyle skills; furthermore, imported food can be inaccessible for residents of isolated settlements both physically and pricewise. Despite the fact that in recent years nutrition of the Sakha Republic (Yakutia) population has generally improved, approaching average nationwide indicators, there is still an energy value gap of 20-21% relative to global standards.
Acknowledgments
The reported study was performed under the e-Asia Climate Call and funded by RFBR, project number 21-55-70104.
References
Agbalyan, E. V., & Kolesnikov, R. A., (2018). Dynamics of Consumption of Basic Food Products by the Population of the Yamalo-Nenets Autonomous Area. Bulletin of Tyumen State University - Ecology, 4(3), 6-21.
Aizinova, I. M. (2014). Food consumption in regions of Russia. Studies on Russian Economic Development, 6(147), 44-59.
Borisova, I. Z., Borisova, A. A., Bianquis, I., Vinokurova, A. A., Vinokurova, D. M., Dokhunaeva, A. M., Lebedeva, U. M., Petrova, M. N., & Pesteil, P., (2020). The problem of valorization and popularization of the food culture of the peoples of the North in modern conditions (on the example of Yakutia. Prioritet.
Botkin, O. I., Sutygina, A. I., & Sutygin, P. F. (2017). Socio-economic factors of food security in regions. Bulletin of Udmurt University - Economics and Law, 27-3, 12-20.
Fatkullina, G. R., & Karimov, A. G., (2019). Consumer spending of households as the key indicator of quality of life in the Republic of Bashkortostan. Sociodynamics, 6, 70.
Food and Agriculture Organization of the United Nations (1996). The Rome Declaration on World Food Security and the World Food Summit Plan of Action.
Gavrilyeva, T., Naberezhnaya, A., Ivanova, M., & Nikiforov, F., (2019). Poverty Factors in the Republic of Sakha (Yakutia). Living Standards and Quality of Life, 1(211), 38−47.
Government of the Sakha Republic (Yakutia), (2019). Order of October 3, 2019, N 1266-r “On the approval of the methodological recommendations "On the methodology for forming the balance of food resources of the Republic of Sakha (Yakutia) for 2019 - 2032, taking into account regional characteristics"
Lebedeva, U. M., Stepanov, K. M., Lebedeva, A. M., Platonova, R. I., Petrova, M. N., & Borisova, I. Z. (2017). Food culture in Yakutia: current state, problems, and prospects of development. Vestnik of North-Eastern Federal University - Medical Sciences, 4(09), 55-58.
Naberezhnaya, A. N. (2017). Research of the Impact of Sociodemographic Factors on Living Standard of the Population in a Region. Living Standards and Quality of Life, 2(204), 169–174.
Neustroeva, T. S., & Lebedeva, U. M. (2012). About the deficient of the nutriciency of the people in the winter in Yakutia and the method its optimization correction. Pulse, 14, 3.
Ovcharova, L. N., Biryukova, S. S., Ter-Akopov, S. A., & Vardanyan, E. G., (2014). What has changed in the income, spending and consumption of the Russian population, 2, 42.
RIA (2020). Ranking of European countries by the share of household spending on food. Retrieved from https://riarating.ru/infografika/20201215/630192506.html
Rosstat (2021a). Database “Regions of Russia. Socio-economic indicators". Retrieved from https://gks.ru/bgd/regl/B07_14p/Main.htm
Rosstat (2021b). Household Food Consumption Database. Retrieved from https://gks.ru/bgd/regl/b20_101/Main.htm
Sakha (Yakutia) Stat. (2021). Official Statistics "The Living Standards". Retrieved from https://sakha.gks.ru/folder/32339
Shestakova, J. R., Barabanova, M. M., Varlamova, M. A., Semenova, Yu. D., Fedulova, A. G., & Ivanova, D. F. (2020). Hygienic assessment of the nutritional status of the population of the Republic of Sakha (Yakutia). International Research Journal of Medical Sciences, 4(94), 101-104.
Vaskin, V. F., & Korosteleva, O. N., (2020). Food consumption and composition of expenditures for food of residents of the Bryansk region. Bulletin of the Kursk State Agricultural Academy, 2, 47.
World Health Organization (2003). Diet, nutrition and the prevention of chronic diseases: report of a joint WHO/FAO expert consultation. Retrieved from https://apps.who.int/iris/bitstream/handle/10665/42665/WHO_TRS_916.pdf?sequence=1&isAllowed=y
World Health Organization (2019). Average number of calories available per person per day (kcal). Retrieved from https://gateway.euro.who.int/ru/indicators/hfa_440-3200-average-number-of-calories-available-per-person-per-day-kcal/
Copyright information

This work is licensed under a Creative Commons Attribution-NonCommercial-NoDerivatives 4.0 International License.
About this article
Publication Date
01 February 2022
Article Doi
eBook ISBN
978-1-80296-123-2
Publisher
European Publisher
Volume
124
Print ISBN (optional)
-
Edition Number
1st Edition
Pages
1-886
Subjects
Land economy, land planning, rural development, resource management, real estates, agricultural policies
Cite this article as:
Gavrilyeva, T. N., & Parilova, V. D. (2022). Food Consumption Patterns In Yakutia Based On The Analysis Of State Statistics. In D. S. Nardin, O. V. Stepanova, & E. V. Demchuk (Eds.), Land Economy and Rural Studies Essentials, vol 124. European Proceedings of Social and Behavioural Sciences (pp. 192-202). European Publisher. https://doi.org/10.15405/epsbs.2022.02.24